Managing smart city tenders without a structured performance system often leads to delays, compliance risks, and missed opportunities. Many organizations still rely on scattered spreadsheets and manual reports, which makes tracking tender performance complex and time-consuming. That is exactly why the Smart Cities Tender KPI Dashboard in Excel is a powerful, practical, and sales-ready solution for modern smart city governance.
This professionally designed Excel dashboard transforms raw tender data into clear, visual, and actionable insights. It helps decision-makers monitor performance, compare targets, analyze trends, and maintain transparency—without expensive BI tools or complex software.
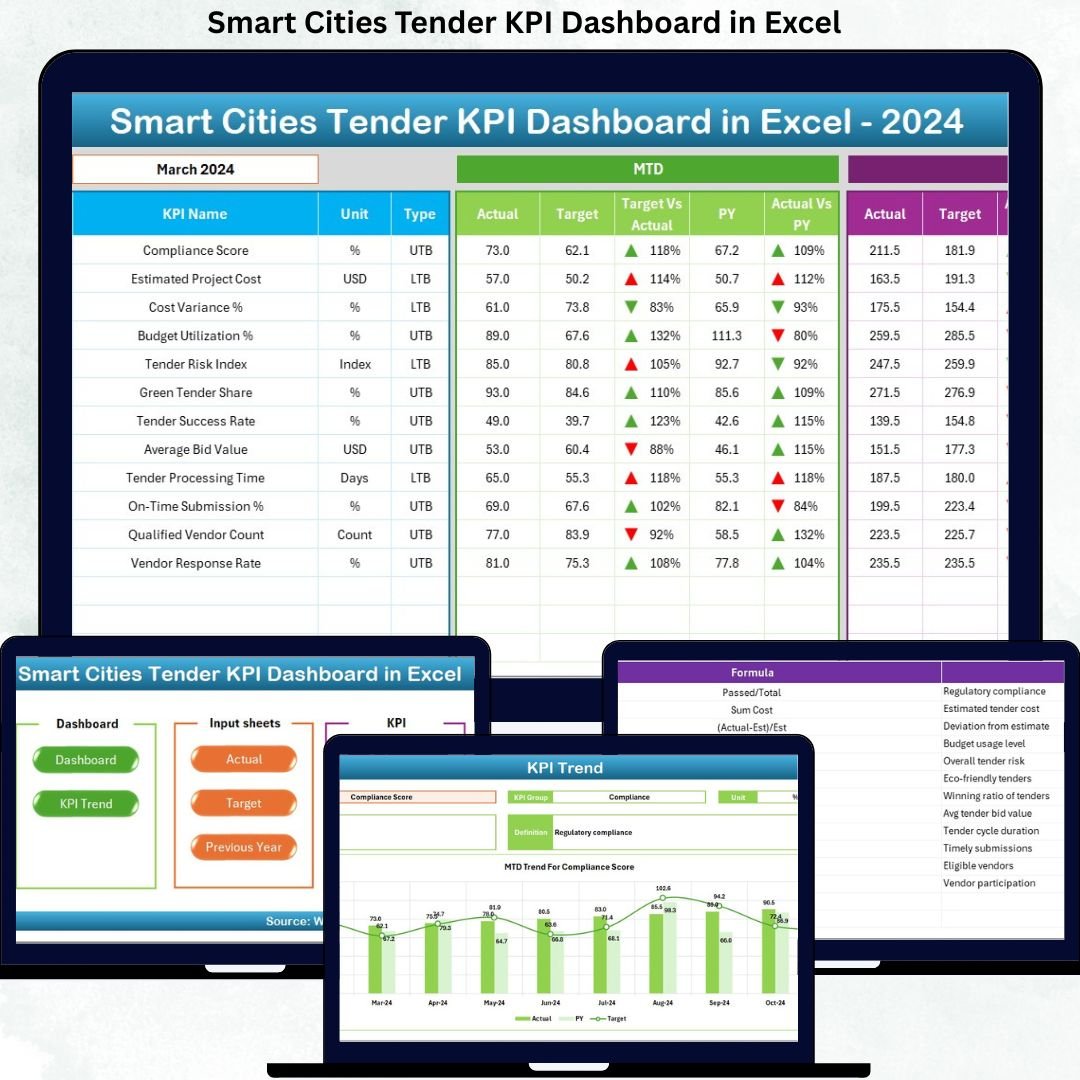
🔑 Key Features of Smart Cities Tender KPI Dashboard in Excel
📊 Centralized KPI Monitoring – Track all smart city tender KPIs in one structured Excel file instead of managing multiple spreadsheets.
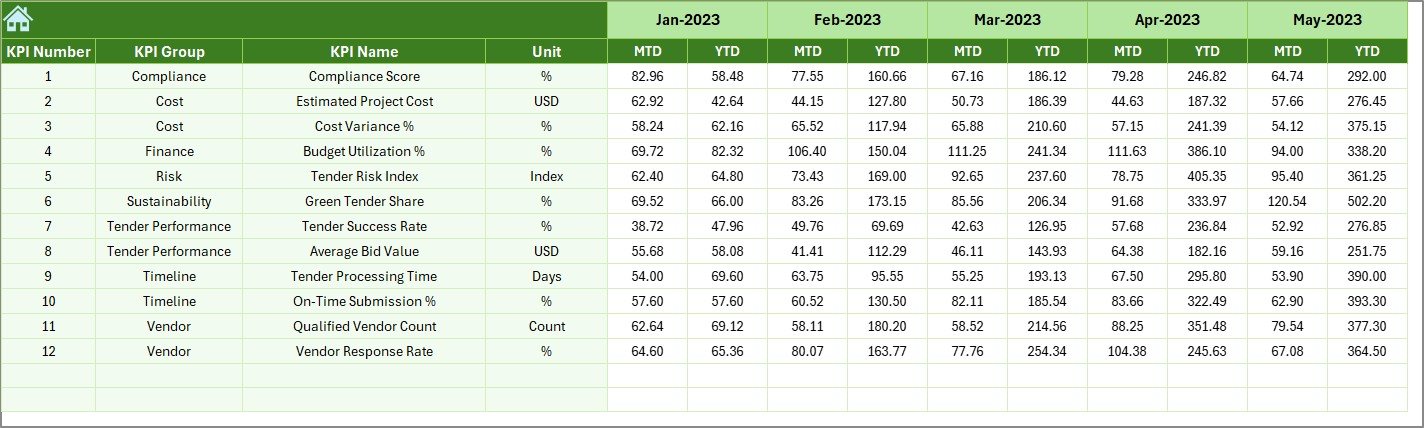
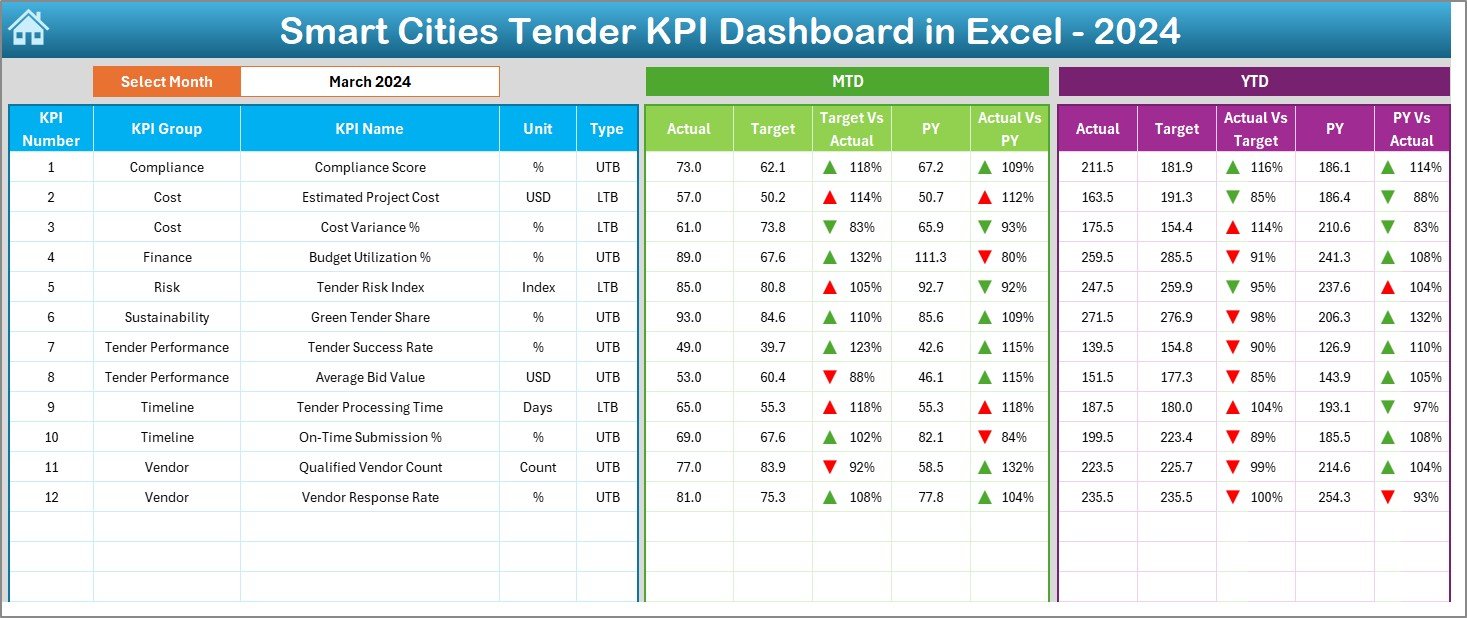
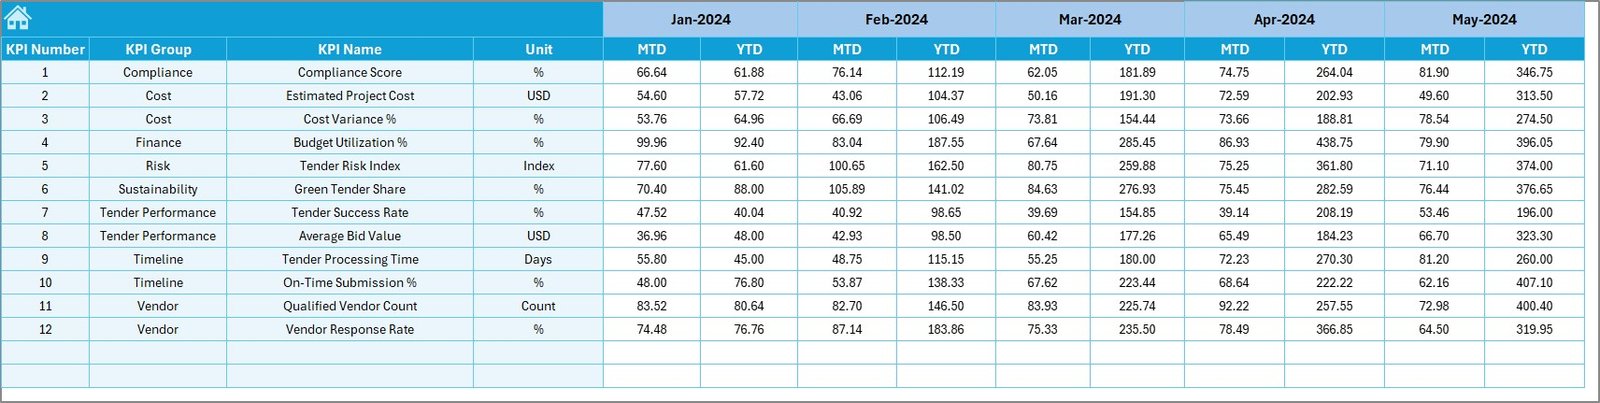
📅 MTD & YTD Performance Tracking – Monitor Month-to-Date and Year-to-Date Actuals, Targets, and Previous Year values in a single dashboard view.
🎯 Target vs Actual Comparison – Instantly identify performance gaps using automated variance calculations and visual indicators.
📉 Previous Year Comparison – Analyze year-over-year trends to evaluate improvements, declines, and long-term performance patterns.
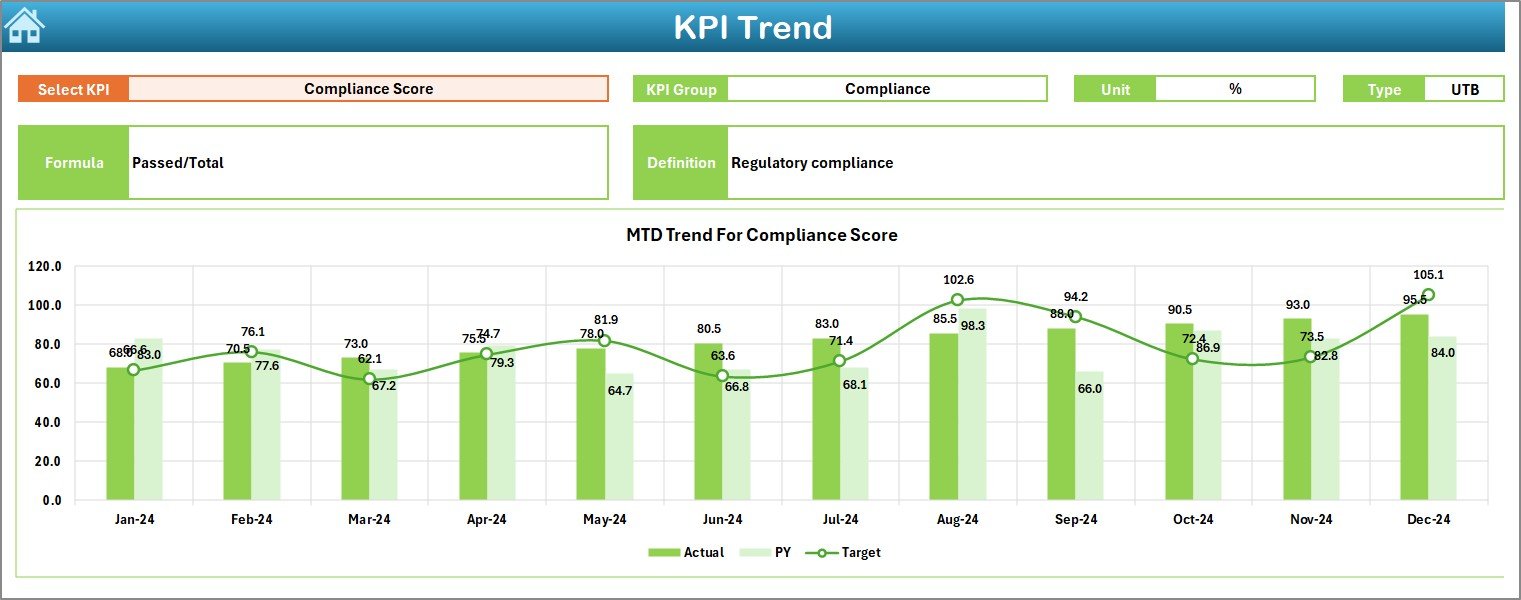
📈 Interactive Trend Analysis – Visual trend charts display KPI behavior over time, helping you detect risks and opportunities early.
🔄 Dynamic Month Selection – Change the reporting month from a dropdown (cell D3) and watch the entire dashboard update instantly.
🎨 Professional Visual Design – Clean layout, executive-ready charts, and conditional formatting with up/down arrows for quick insights.
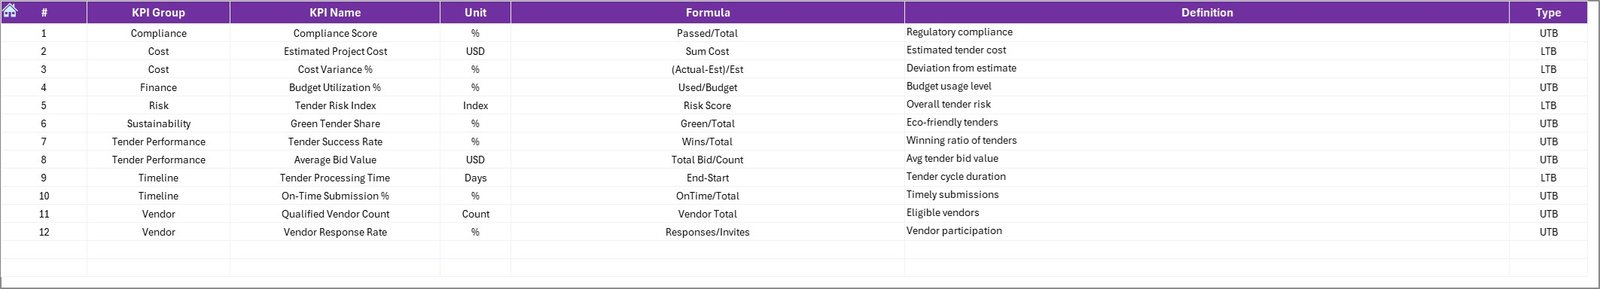
📘 Built-in KPI Definitions – Clear KPI logic ensures everyone understands what is measured and how it is calculated.
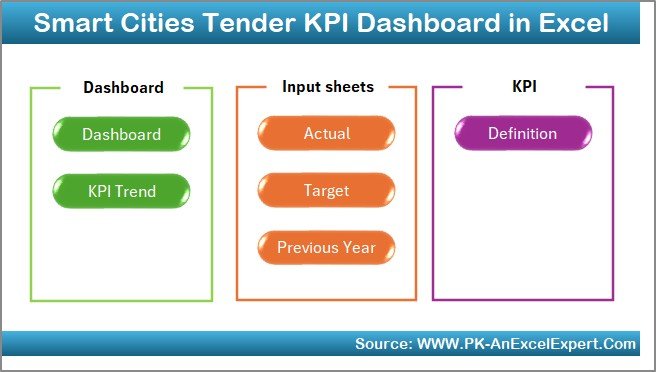
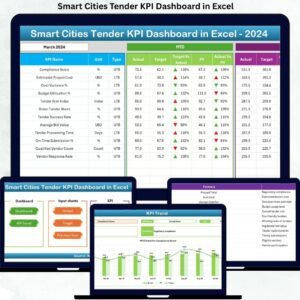
📦 What’s Inside the Smart Cities Tender KPI Dashboard in Excel
This digital product includes 7 well-structured worksheets, each designed for a specific purpose:
🧭 Summary Page – Acts as a control center with 6 navigation buttons to quickly jump to key sheets.
📊 Dashboard Sheet – Displays all KPIs with MTD, YTD, Target vs Actual, and Previous Year comparisons using visuals and indicators.
📈 Trend Sheet – Allows KPI selection and shows MTD and YTD trend charts along with KPI Group, Unit, Type, Formula, and Definition.
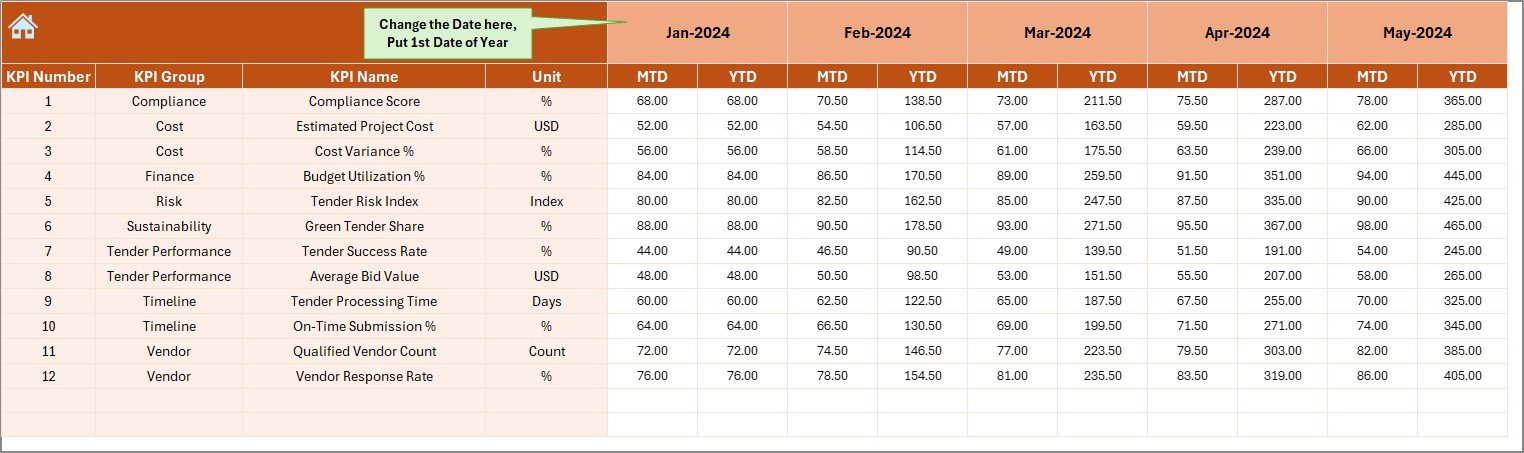
📝 Actual Numbers Input Sheet – Simple data entry sheet for entering monthly MTD and YTD actual values.
🎯 Target Sheet – Stores monthly and yearly KPI targets for structured goal tracking.
📆 Previous Year Numbers Sheet – Enables reliable year-over-year performance comparison.
📚 KPI Definition Sheet – Central reference for KPI Name, Group, Unit, Formula, and Definition to maintain clarity and consistency.
🛠️ How to Use the Smart Cities Tender KPI Dashboard in Excel
Using this dashboard is simple and efficient:
1️⃣ Enter actual performance data in the Actual Numbers Input Sheet.
2️⃣ Define planned values in the Target Sheet.
3️⃣ Add historical data in the Previous Year Numbers Sheet.
4️⃣ Select the reporting month from the dropdown.
5️⃣ Instantly review KPIs, comparisons, and trends on the Dashboard and Trend sheets.
Because calculations and visuals are automated, users avoid manual errors and save significant reporting time.
👥 Who Can Benefit from This Smart Cities Tender KPI Dashboard
🏛️ Government Procurement Teams – Improve transparency and tender evaluation accuracy.
🏙️ Smart City Project Offices – Track multiple tender KPIs in one dashboard.
📊 Consultants & Advisors – Deliver professional, data-driven reports to clients.
🧾 Audit & Compliance Teams – Support reviews with structured KPI logic and historical data.
🏗️ Infrastructure Planning Departments – Monitor tender efficiency and outcomes effectively.
Even non-technical users can operate this dashboard confidently with basic Excel knowledge.
Click here to read the Detailed blog post
Watch the step-by-step video tutorial:


Reviews
There are no reviews yet.