Managing refinery tenders is never simple. High-value bids, strict compliance requirements, multiple vendors, and complex cost structures make tender monitoring extremely challenging. When tender data is scattered across multiple Excel files and manual reports, visibility drops and risks increase.
That is exactly why the Refinery Tender Dashboard in Excel is a powerful, ready-to-use solution. 🚀
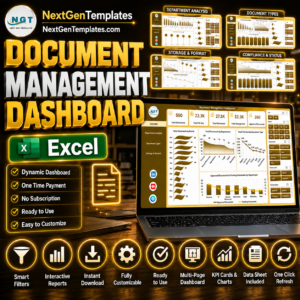
This professionally designed Excel dashboard converts complex tender data into clear KPIs, interactive charts, and actionable insights—helping refinery teams take faster, smarter, and more profitable decisions.
Built entirely in Microsoft Excel, this dashboard requires no coding, no BI tools, and no advanced technical skills, making it perfect for real-world refinery operations.
Key Features of Refinery Tender Dashboard in Excel 🔑
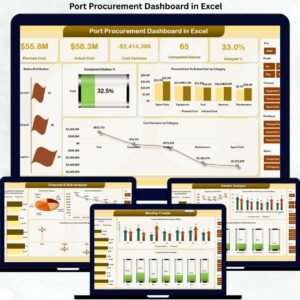
📊 Centralized Tender Monitoring
Track all refinery tenders, bids, estimated costs, profit margins, and vendor performance from one unified dashboard.
📈 Interactive KPI Cards
Instantly view Profit Margin %, Open Bid %, Estimated Cost, and Bid Value to assess overall tender health.
🧭 Smart Page Navigator
Quickly switch between Overview, Tender Type, Category, Vendor, and Month Analysis pages without confusion.
📉 Dynamic Charts & Visuals
All charts update automatically using slicers such as State, Tender Type, Category, Vendor, and Month.
⚡ Real-Time Decision Support
Spot cost overruns, low-margin tenders, and high-performing vendors in seconds.
🧮 Error-Free Calculations
Automated formulas and pivot tables eliminate manual calculation mistakes.
💼 Management-Ready Reporting
Perfect for monthly reviews, audits, leadership meetings, and performance evaluations.
What’s Inside the Refinery Tender Dashboard in Excel 📁
This ready-to-use Excel file includes:
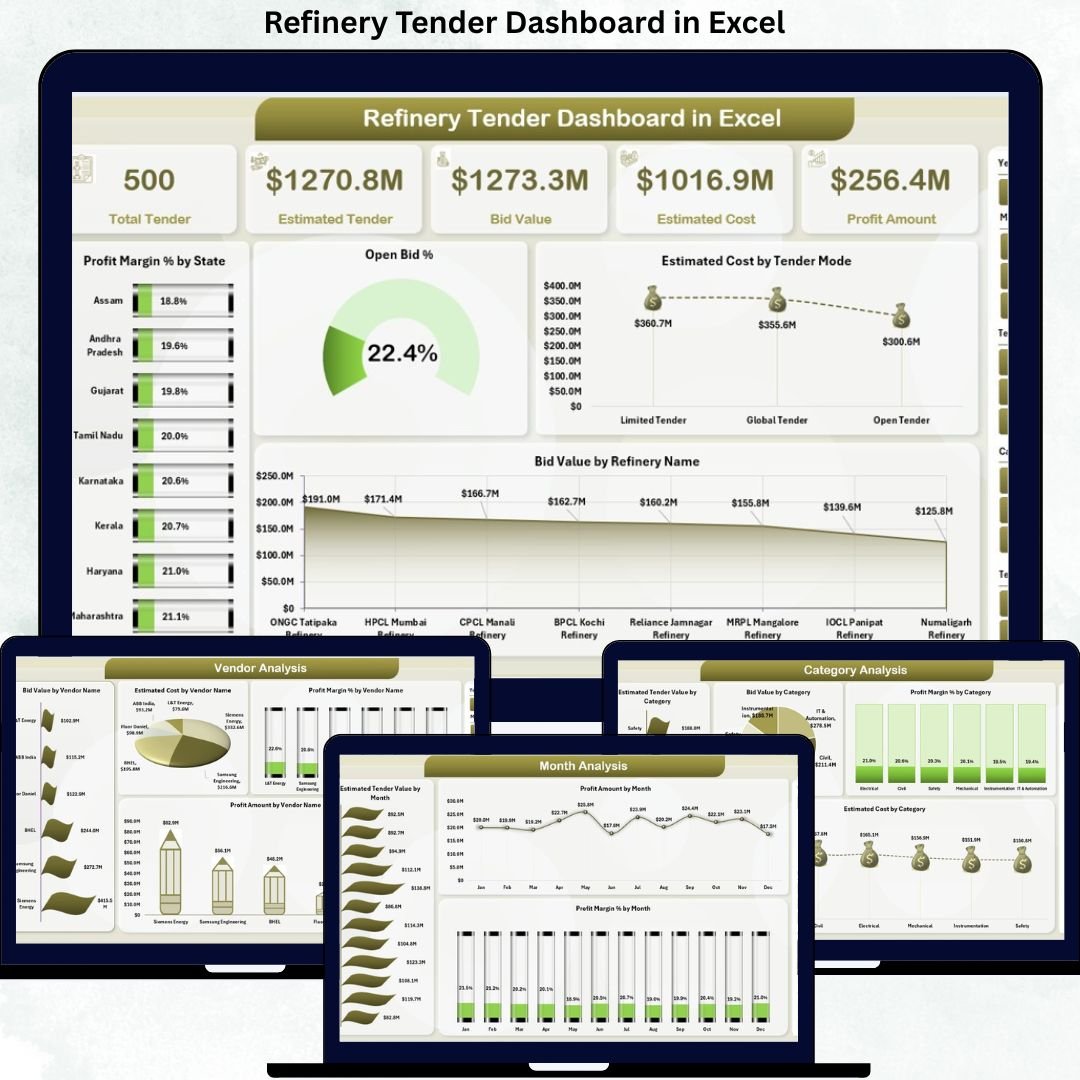
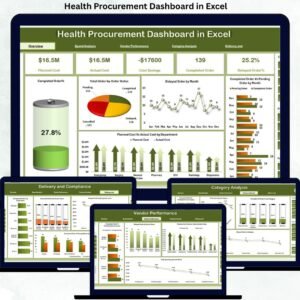
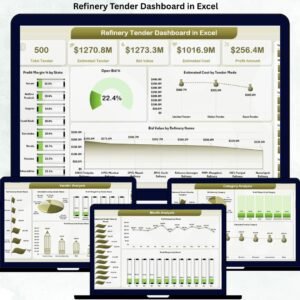
📄 Overview Page
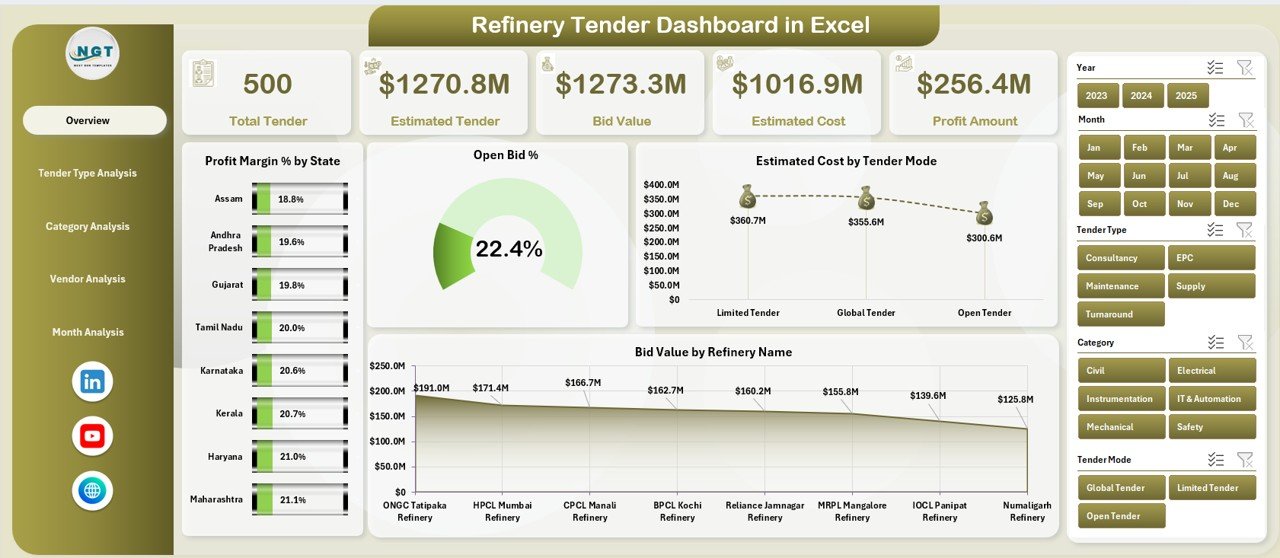
High-level snapshot with KPI cards and charts like Profit Margin % by State, Open Bid % by State, Estimated Cost by Tender Mode, and Bid Value by Refinery Name.
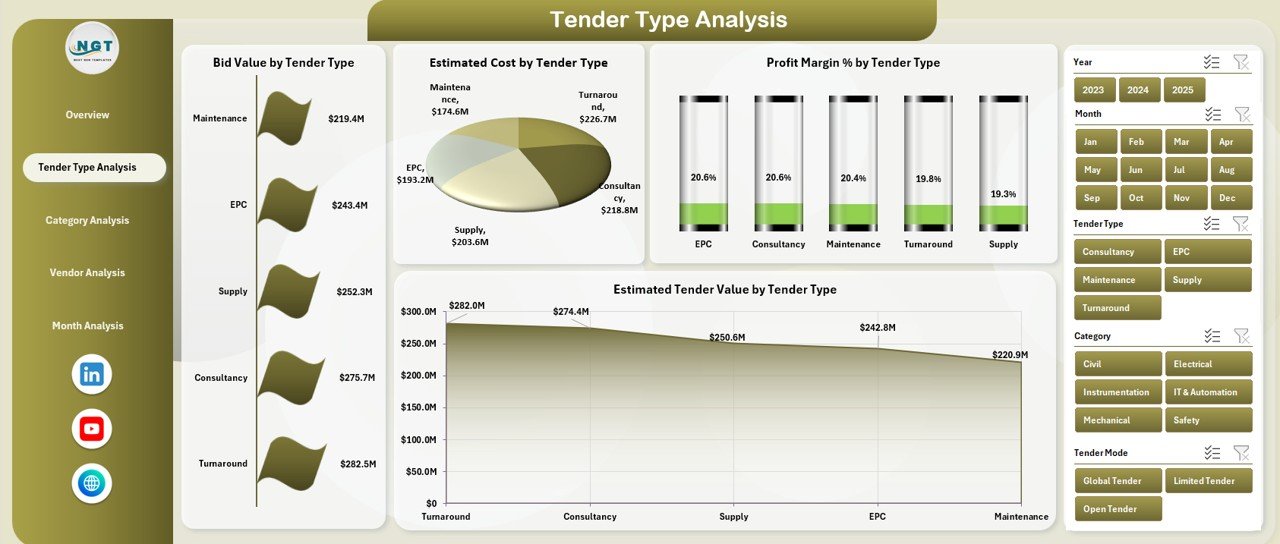
📄 Tender Type Analysis Page
Analyze bid value, estimated cost, profit margin %, and tender value by tender type.
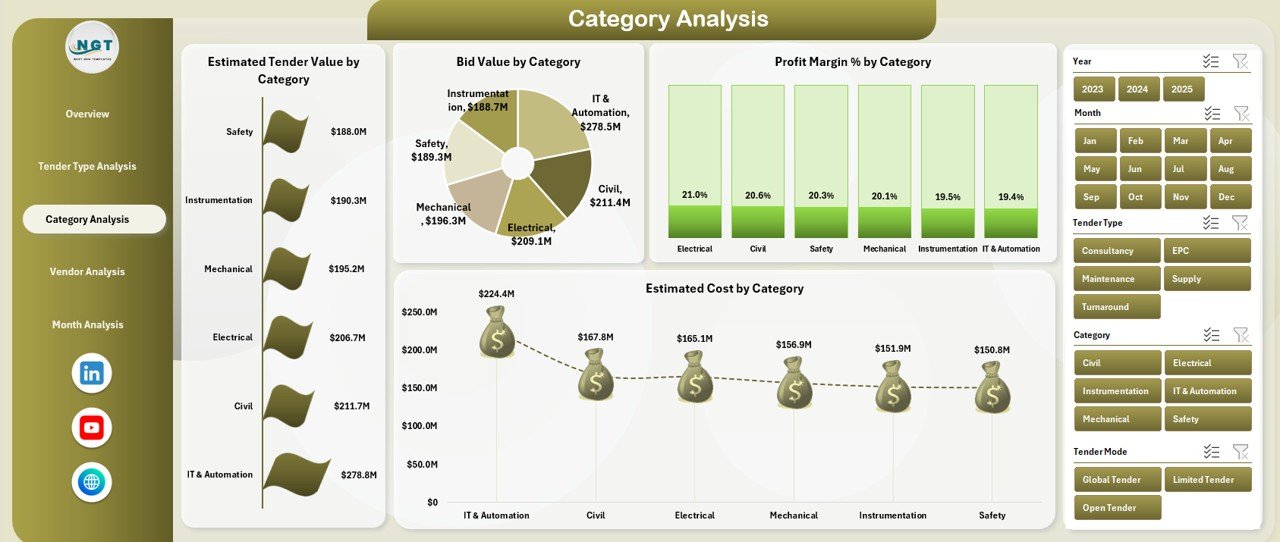
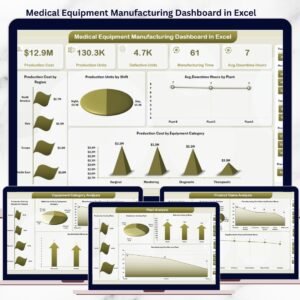
📄 Category Analysis Page
Understand performance by material or service category with cost, value, and margin insights.
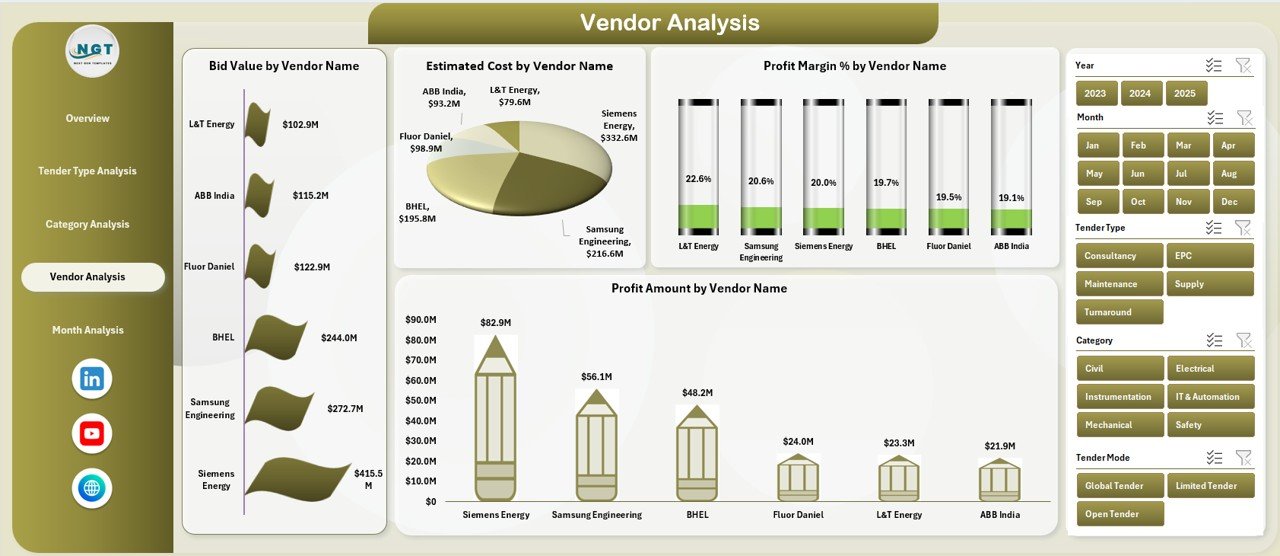
📄 Vendor Analysis Page
Evaluate vendor-wise bid value, estimated cost, profit amount, and profit margin.
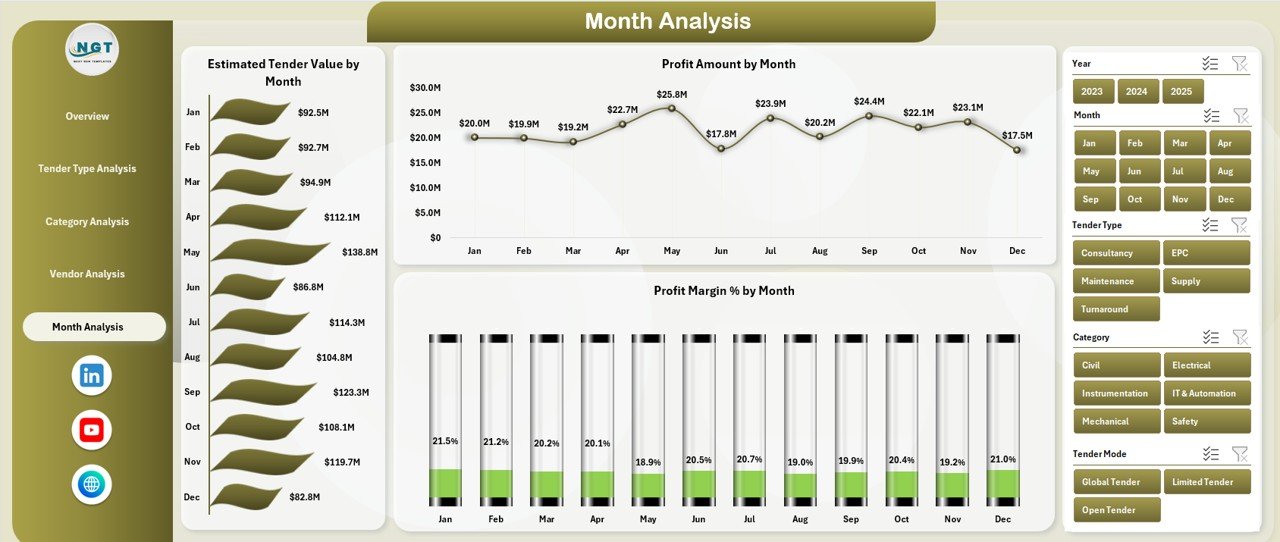
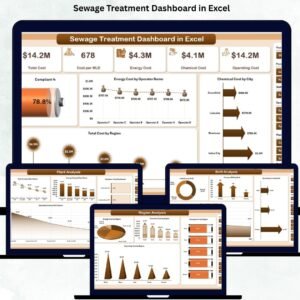
📄 Month Analysis Page
Track monthly trends in tender value, profit amount, and profit margin %.
📄 Data & Support Sheets
Clean data structure, drop-down lists, validations, and helper calculations for smooth performance.
How to Use the Refinery Tender Dashboard in Excel 🛠️
1️⃣ Enter or update tender data in the Data Sheet
2️⃣ Use drop-downs and slicers to filter by State, Vendor, Category, or Month
3️⃣ Instantly view updated KPIs and charts
4️⃣ Analyze trends, risks, and profitability
5️⃣ Export insights for management presentations
No training is required—basic Excel knowledge is enough to start using the dashboard effectively.
Who Can Benefit from This Refinery Tender Dashboard 👥
🏭 Refinery Procurement Managers – Monitor bids, vendors, and tender profitability
💰 Finance & Cost Control Teams – Track margins, costs, and financial exposure
📑 Commercial & Contract Teams – Compare tender performance and vendor efficiency
📊 Project Management Offices (PMO) – Support tender-driven project planning
👔 Senior Management & Leadership – Gain instant, data-driven insights for decisions
If your refinery handles multiple tenders and values cost control, transparency, and profitability, this dashboard is built for you.


Reviews
There are no reviews yet.