


Yoga has evolved into a full-scale wellness business. Modern yoga centres manage multiple classes, locations, instructors, membership plans, and customer experiences every single day. However, when session data, costs, ratings, and revenues are spread across spreadsheets, decision-making becomes slow and reactive. That is exactly why the Yoga Centres Dashboard in Power BI becomes a critical performance management tool for growing yoga studios and wellness centres.
This ready-to-use Power BI dashboard transforms scattered operational and financial data into a centralized, interactive, and visually powerful reporting system. Instead of guessing which yoga styles perform best or which memberships generate higher margins, owners and managers gain instant clarity across cities, regions, styles, memberships, and monthly trends. As a result, pricing, scheduling, marketing, and expansion decisions become data-driven and confident.
Because the dashboard runs on Microsoft Power BI, it offers dynamic filtering, drill-down analysis, and real-time visual updates. Users can slice performance by city, region, yoga style, membership type, or month in seconds—without writing formulas or complex code. Consequently, yoga centres move from intuition-based management to insight-led growth.
🔑 Key Features of Yoga Centres Dashboard in Power BI
🧘 Centralized Business Performance View – Track sessions, attendance, costs, revenue, profit, and margins in one dashboard.
📊 Executive KPI Cards & Visuals – Instantly understand financial health with clear, high-impact cards.
🎛️ Interactive Slicers – Filter insights by City, Region, Yoga Style, Membership Type, and Month.
📈 Multi-Dimensional Analysis – Analyze performance by style, location, membership, and time period.
⚡ Automated & Real-Time Insights – Reduce manual reporting and speed up decision-making.
📂 What’s Inside the Yoga Centres Dashboard in Power BI
This professionally designed dashboard includes five structured and insight-driven pages, each focused on a specific business question:
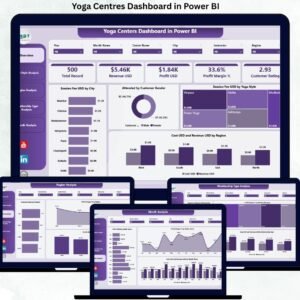
📊 Overview Page – An executive snapshot with cards for Total Session Fee, Total Revenue, Total Cost, and Total Profit, along with visuals like Session Fee by City, Attendance by Gender, Session Fee by Yoga Style, and Cost vs Revenue by Region.

🧘♂️ Yoga Style Analysis Page – Evaluate Customer Rating, Profit Margin %, and Cost vs Revenue by Yoga Style to identify high-performing classes.
🌍 Region Analysis Page – Compare Customer Rating, Profit Margin %, and Profit by Region to guide regional strategy.
🎟️ Membership Type Analysis Page – Analyze Customer Rating, Profit Margin %, and Cost vs Revenue by Membership Type to optimize pricing and packages.
📅 Monthly Trends Page – Track Profit, Profit Margin %, and Cost vs Revenue by Month to understand seasonality and growth patterns.
Each page responds instantly to slicer selections, allowing seamless movement from high-level summaries to detailed insights.
▶️ How to Use the Yoga Centres Dashboard in Power BI
Using this dashboard is simple and practical:
1️⃣ Maintain your yoga centre data in Excel or Google Sheets (sessions, costs, revenue, ratings).
2️⃣ Connect or refresh the data in Power BI.
3️⃣ Use slicers to filter performance by city, style, membership, or month.
4️⃣ Review KPI cards, charts, and trends to identify opportunities and risks.
5️⃣ Take data-driven actions to improve profitability and customer satisfaction.
No advanced Power BI skills are required for end users.
👥 Who Can Benefit from This Yoga Centres Dashboard in Power BI
This dashboard is ideal for:
🧘♀️ Yoga Studio Owners
🏢 Wellness Centre Managers
📈 Operations & Growth Teams
💰 Finance & Accounting Teams
📢 Marketing Managers
Each stakeholder gains clarity, control, and confidence in business decisions.
### 👉 Click here to read the Detailed Blog Post
Visit our YouTube channel to learn step-by-step video tutorials.


Reviews
There are no reviews yet.