


Digital streaming platforms operate in one of the most competitive and fast-evolving industries today. Digital Streaming Platforms KPI Dashboard in Excel Subscriber expectations continue to rise, content performance must be monitored closely, and leadership teams demand clear justification for investments. However, managing streaming KPIs using scattered spreadsheets and manual calculations often leads to delays, errors, and unclear insights.
That is exactly why the Digital Streaming Platforms KPI Dashboard in Excel is a powerful and practical performance management solution.
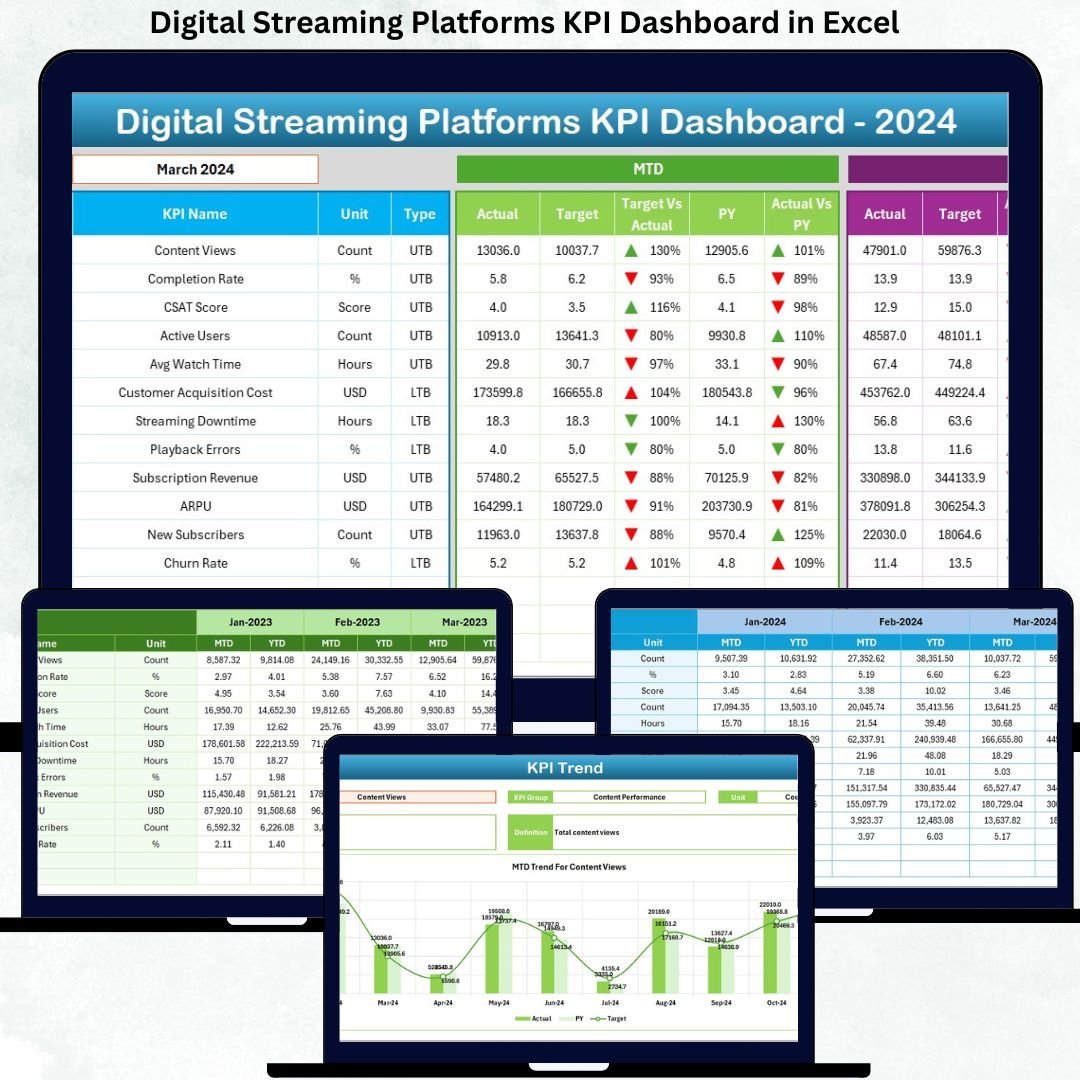
This ready-to-use Excel dashboard transforms raw streaming data into structured KPIs, automated calculations, and clear performance visuals. Instead of juggling multiple files, platform managers, analysts, and executives get one centralized dashboard to track actuals, targets, and previous-year performance with confidence. As a result, teams gain faster insights, better transparency, and stronger control over strategic decisions.
🔑 Key Features of Digital Streaming Platforms KPI Dashboard in Excel
📊 Centralized KPI Monitoring
Track all streaming performance KPIs in one professional Excel dashboard.
📅 MTD & YTD Performance Tracking
Analyze short-term and long-term performance together for better insights.
🎯 Target vs Actual Comparison
Instantly identify whether KPIs meet targets using percentages and indicators.
📈 Previous Year Benchmarking
Measure improvement or decline with year-over-year comparisons.
🧭 Interactive Month & KPI Filters
Use dropdowns to analyze specific months or KPIs without manual effort.
📊 Dynamic Trend Charts
Visualize MTD and YTD trends for Actual, Target, and Previous Year values.
⚙️ Excel-Based & Cost-Effective
No advanced BI tools required—works seamlessly in Microsoft Excel.
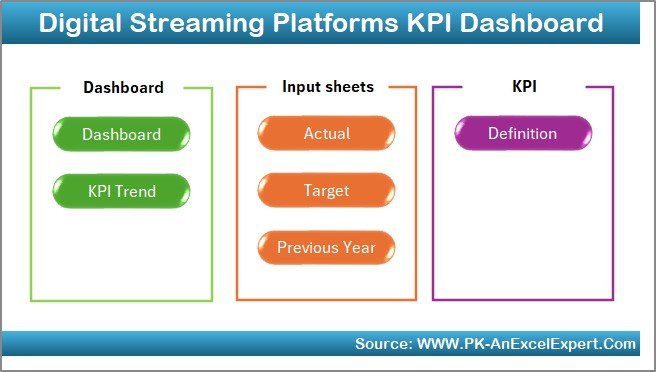
📦 What’s Inside the Digital Streaming Platforms KPI Dashboard in Excel
This dashboard includes 7 well-structured worksheets; each designed for clarity and ease of use:
🏠 Home Sheet

A clean navigation hub with buttons that provide one-click access to all major sheets.
📊 Dashboard Sheet
The main performance overview featuring:
-
Month selection (Cell D3)
-
MTD and YTD Actual, Target, and Previous Year values
-
Target vs Actual % and PY vs Actual %
-
Conditional formatting with up/down arrows for instant interpretation
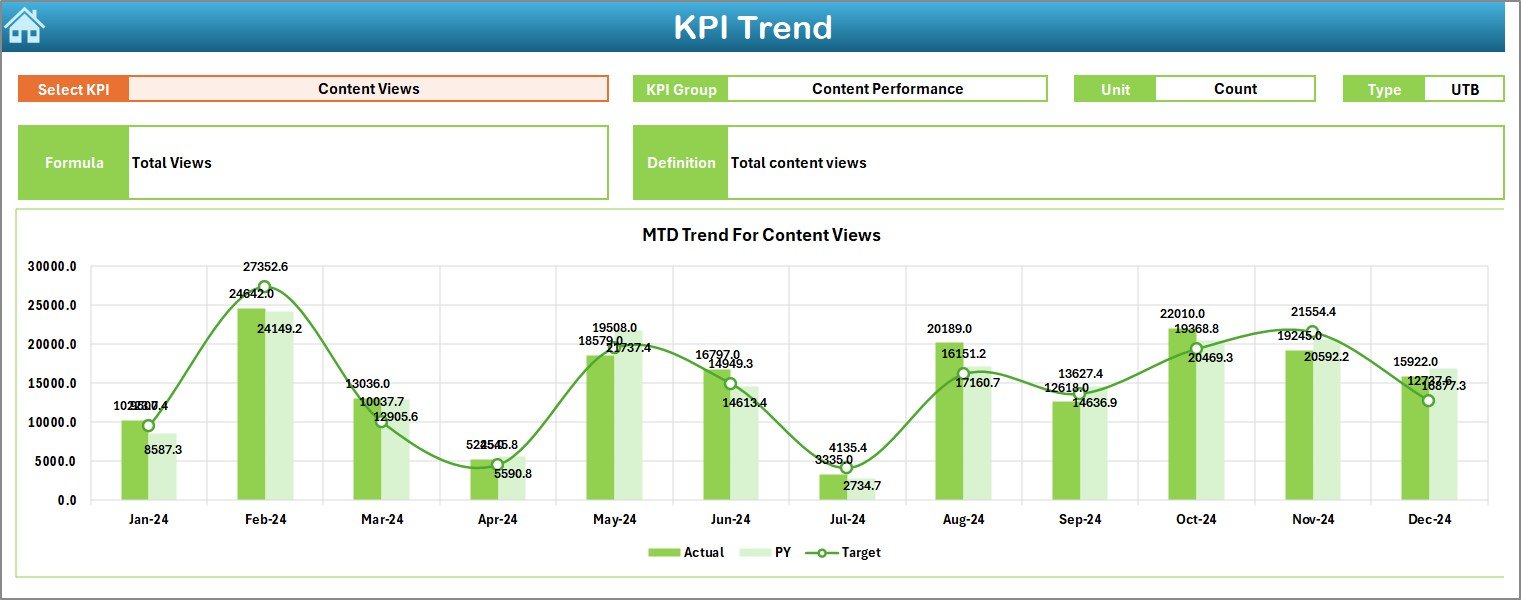
📈 KPI Trend Sheet
Provides deep KPI-level analysis with:
-
KPI selection drop-down
-
KPI metadata (Group, Unit, Type, Formula, Definition)
-
MTD and YTD trend charts comparing Actual, Target, and Previous Year
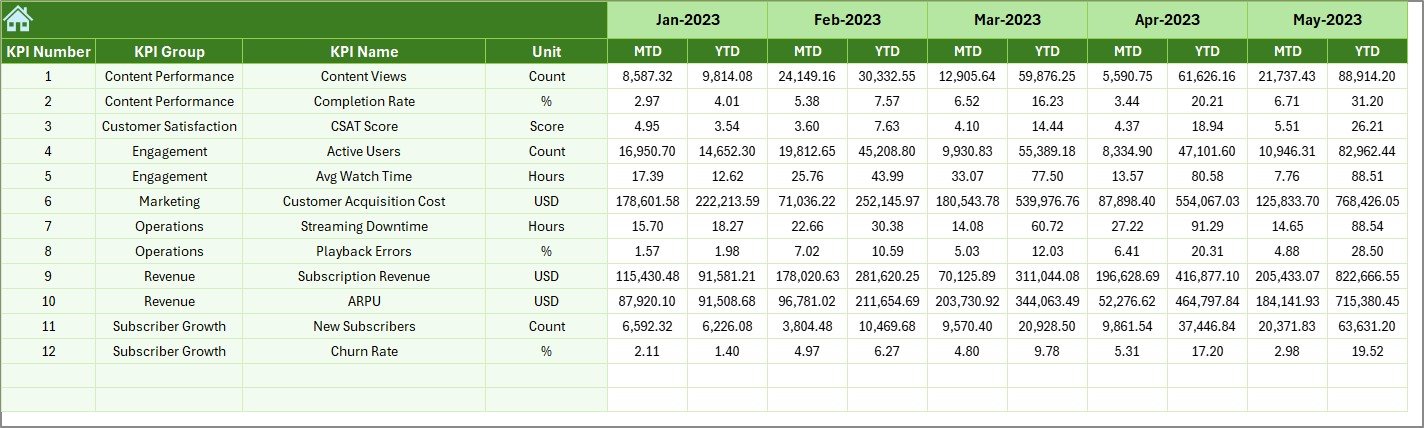
📝 Actual Numbers Input Sheet
Used to enter current-year MTD and YTD actual performance data.
🎯 Target Sheet
Stores monthly MTD and YTD target values for each KPI.
📜 Previous Year Number Sheet
Holds historical data to support year-over-year analysis and benchmarking.
📘 KPI Definition Sheet
Maintains KPI Name, Group, Unit, Formula, and Definition for consistency.
▶️ How to Use the Digital Streaming Platforms KPI Dashboard in Excel
Using the dashboard is simple and efficient:
1️⃣ Enter actual performance data in the Actual Numbers Input sheet
2️⃣ Update targets in the Target sheet
3️⃣ Maintain KPI details in the KPI Definition sheet
4️⃣ Select the reporting month from the drop-down
5️⃣ Review MTD and YTD performance on the Dashboard
6️⃣ Analyze trends and comparisons on the KPI Trend sheet
7️⃣ Use insights to guide content, growth, and investment decisions
No advanced Excel skills are required.
🎯 Who Can Benefit from This Digital Streaming Platforms KPI Dashboard in Excel
🎬 Streaming Platform Managers – Monitor growth, engagement, and efficiency
📊 Content Strategy Teams – Evaluate performance trends and outcomes
📈 Data & Business Analysts – Perform structured KPI analysis with ease
💰 Finance & Planning Teams – Align targets with actual performance
🏢 Senior Leadership & Stakeholders – Access clear, decision-ready insights
The dashboard supports both operational reviews and strategic planning.
👉 Click here to read the Detailed Blog Post
🔔 Visit our YouTube channel to learn step-by-step video tutorials
👉 YouTube.com/@PKAnExcelExpert


Reviews
There are no reviews yet.