
Public Health Programs Dashboard in Power BI play a vital role in improving community well-being. Governments, NGOs, and healthcare authorities invest significant resources in vaccination drives, maternal health initiatives, nutrition programs, disease prevention, and awareness campaigns. However, when program data is spread across spreadsheets, static reports, and delayed summaries, decision-makers struggle to measure impact, control budgets, and respond to regional challenges. That is exactly why the Public Health Programs Dashboard in Power BI becomes an essential analytics and governance solution.
This ready-to-use Power BI dashboard transforms complex public health data into a centralized, interactive, and visually compelling performance management system. Instead of manually consolidating reports from multiple sources, program managers and leadership teams can track program progress, beneficiary coverage, budget utilization, and outcome ratings in one unified dashboard. As a result, public health decisions become faster, more transparent, and evidence-based.
Because the dashboard is built using Microsoft Power BI, it offers dynamic filtering, drill-down analysis, and real-time updates. Users can analyze performance by program type, funding source, district, or time period without technical complexity. Consequently, organizations move from reactive reporting to proactive program optimization.
🔑 Key Features of Public Health Programs Dashboard in Power BI
🌍 Centralized Program Monitoring – Track all public health initiatives in one interactive Power BI dashboard.
📊 Executive KPI Cards & Visuals – Instantly understand program status, delays, and outcomes.
🎛️ Dynamic Slicers & Filters – Analyze performance by program type, funding source, region, or time period.
💰 Budget Allocation vs Utilization Tracking – Ensure financial transparency and accountability.
📈 Trend & Outcome Analysis – Monitor progress and impact over time with clear visuals.
📂 What’s Inside the Public Health Programs Dashboard in Power BI
This professionally designed dashboard includes five structured and insight-driven pages, each focused on a specific analysis area:
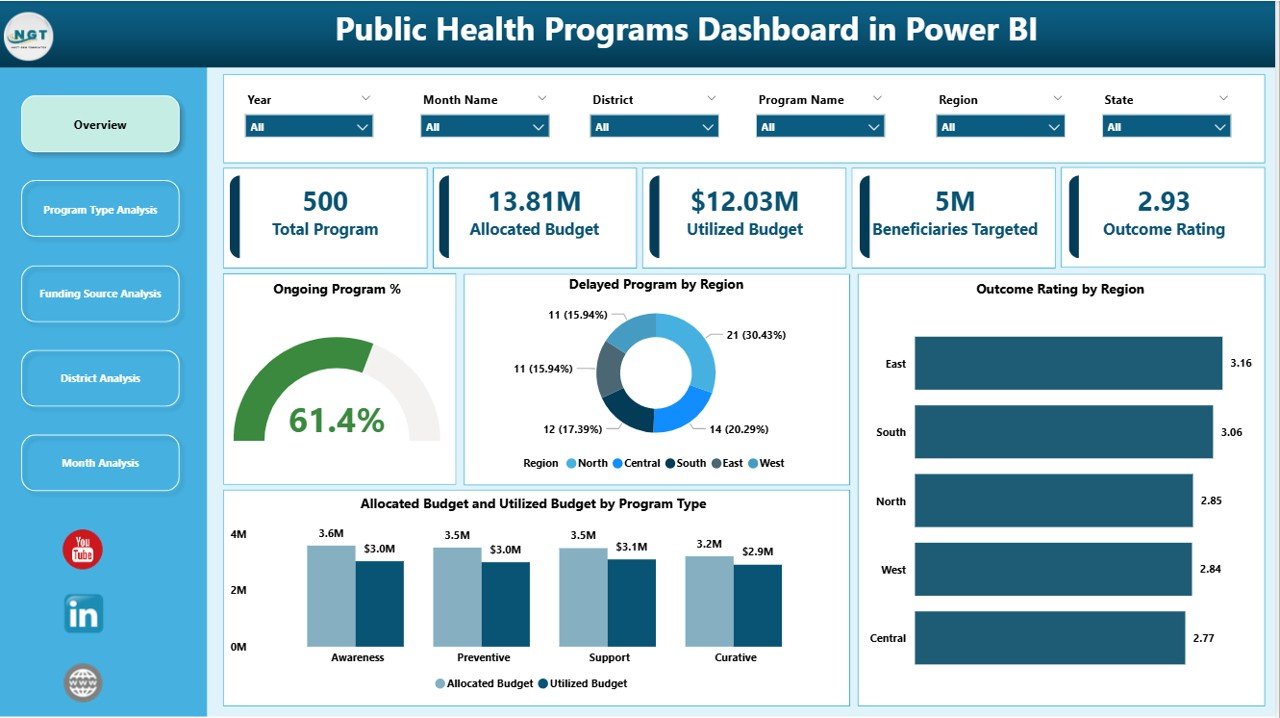
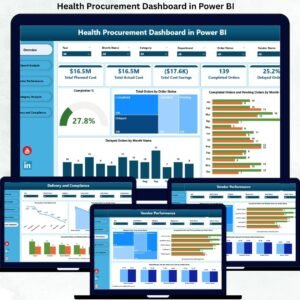
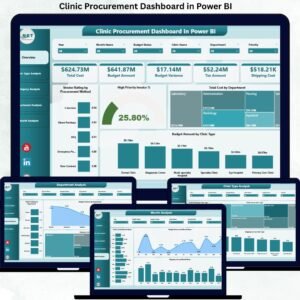
📊 Overview Page – An executive snapshot with KPI cards such as Total Programs, Ongoing Program %, Delayed Program %, and Average Outcome Rating, along with visuals like Outcome Rating by Region and Allocation Budget vs Utilized Budget by Program Type.
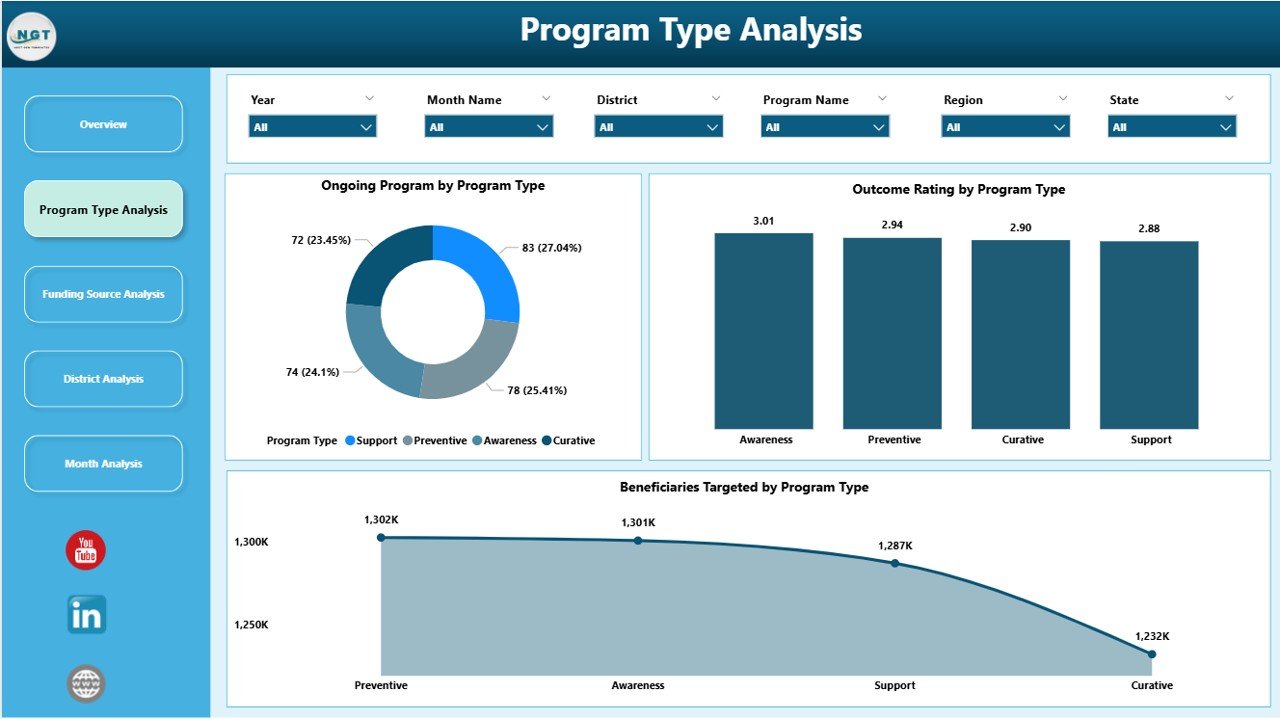
🏥 Program Type Analysis Page – Compare performance across health initiatives using Ongoing Programs, Beneficiaries Targeted, and Outcome Ratings by Program Type.
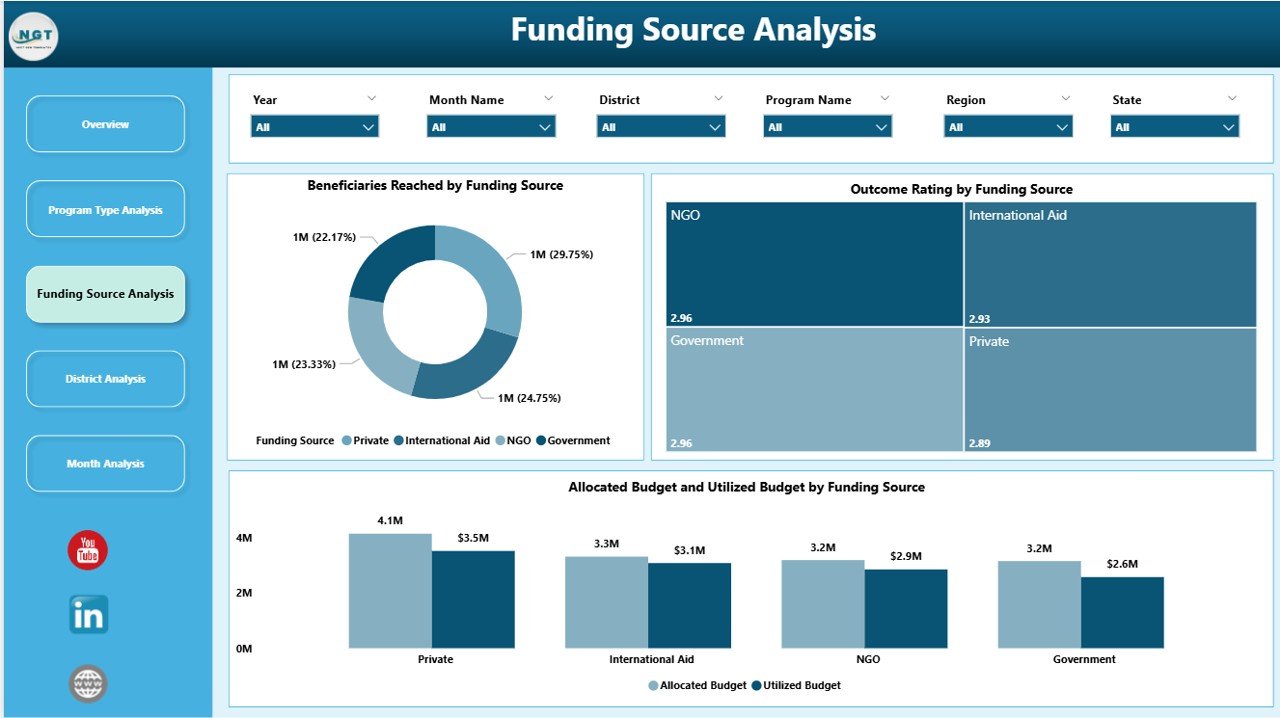
💵 Funding Source Analysis Page – Evaluate funding effectiveness with Beneficiaries Targeted, Outcome Rating, and Budget Allocation vs Utilization by Funding Source.
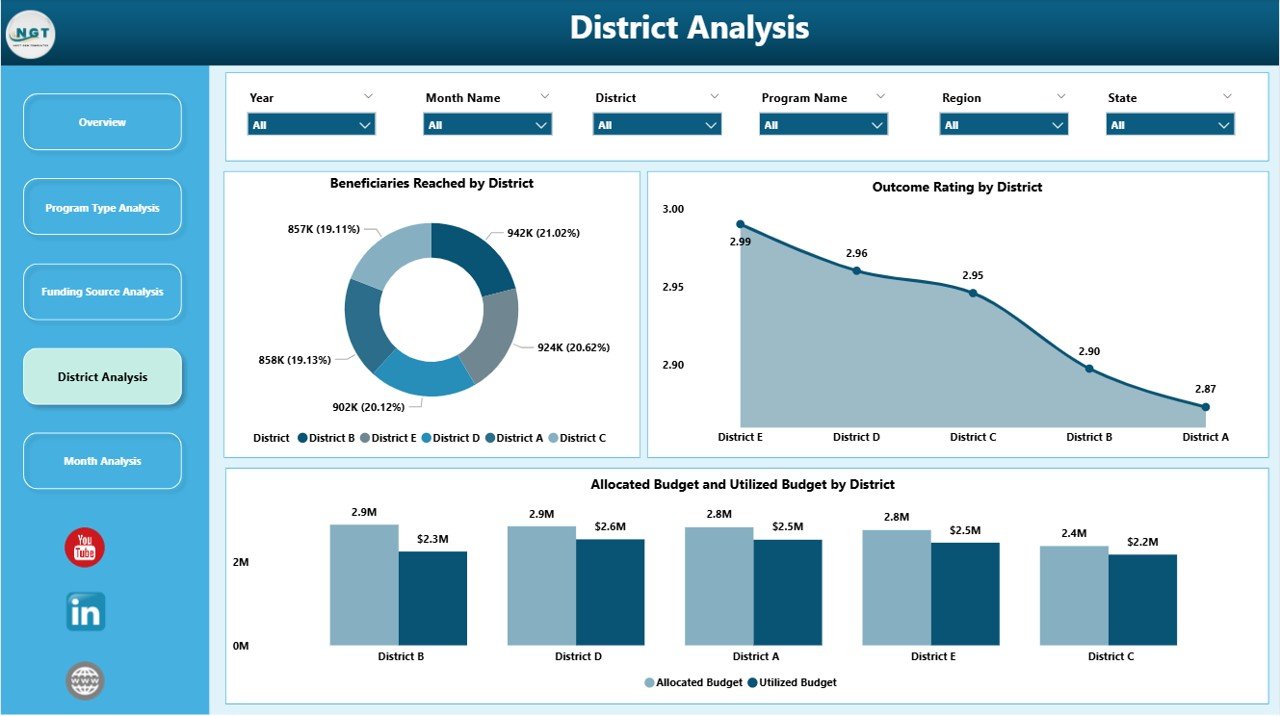
🗺️ District Analysis Page – Identify regional disparities using Beneficiaries Targeted, Outcome Rating, and Budget Utilization by District.
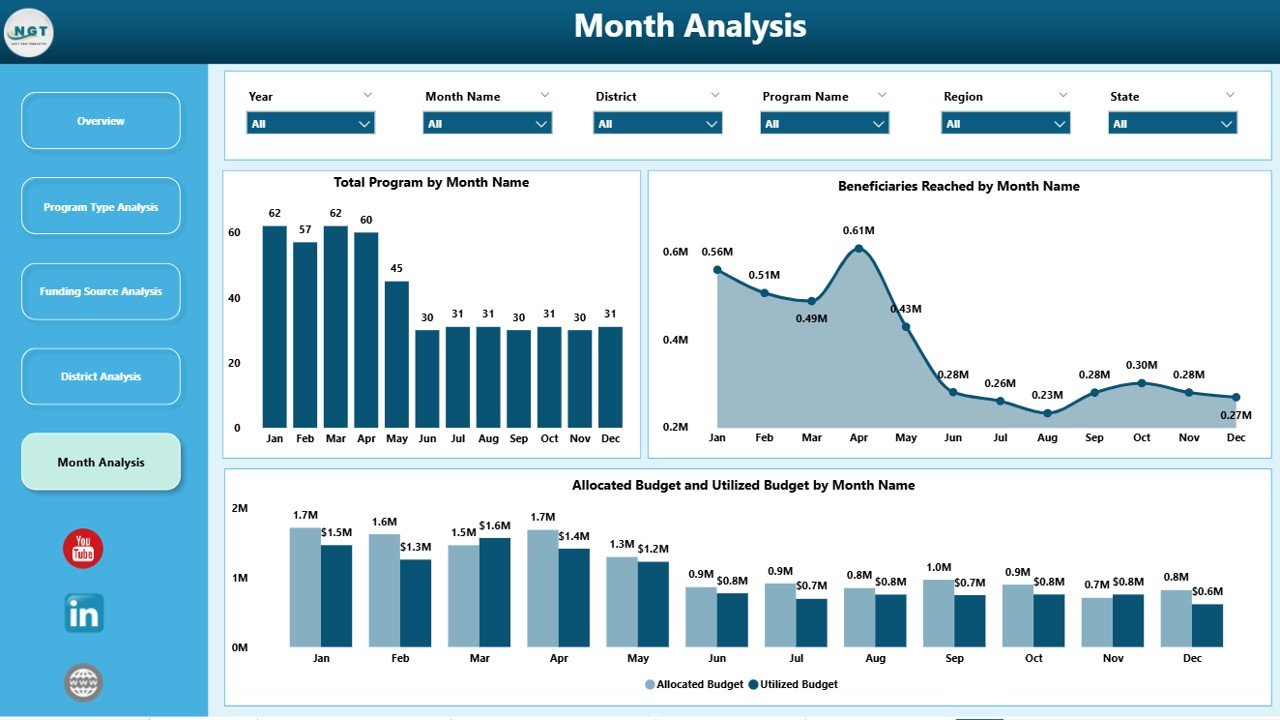
📅 Monthly Trends Page – Track Beneficiaries Targeted, Total Programs, and Budget Utilization by Month to understand progress over time.
Each page responds instantly to slicer selections, allowing users to move seamlessly from high-level insights to detailed regional and financial analysis.
▶️ How to Use the Public Health Programs Dashboard in Power BI
Using this dashboard is simple and practical:
1️⃣ Connect public health program data from Excel, databases, or health information systems.
2️⃣ Refresh the Power BI report to load the latest data.
3️⃣ Use slicers to filter insights by program type, funding source, district, or month.
4️⃣ Review KPI cards, charts, and trends to identify gaps and risks.
5️⃣ Take timely, data-driven actions to improve program outcomes and budget efficiency.
No advanced Power BI expertise is required for end users.
👥 Who Can Benefit from This Public Health Programs Dashboard in Power BI
This dashboard is ideal for:
🏛️ Government Health Departments
🏥 Public Health Administrators
📋 Program Managers
💰 Funding Agencies & Donors
🌍 NGOs & International Organizations
📊 Policy Analysts & Researchers
Each stakeholder gains clarity, transparency, and confidence in public health decision-making.
### 👉 Click here to read the Detailed Blog Post
Visit our YouTube channel to learn step-by-step video tutorials.


Reviews
There are no reviews yet.