The renewable energy sector is expanding faster than ever. However, managing performance data across solar, wind, hydro, and hybrid energy projects often becomes overwhelming. Multiple plants, regions, customer sectors, and PPA types generate huge volumes of data every month. Without a structured reporting system, decision-makers struggle to track performance and identify opportunities.
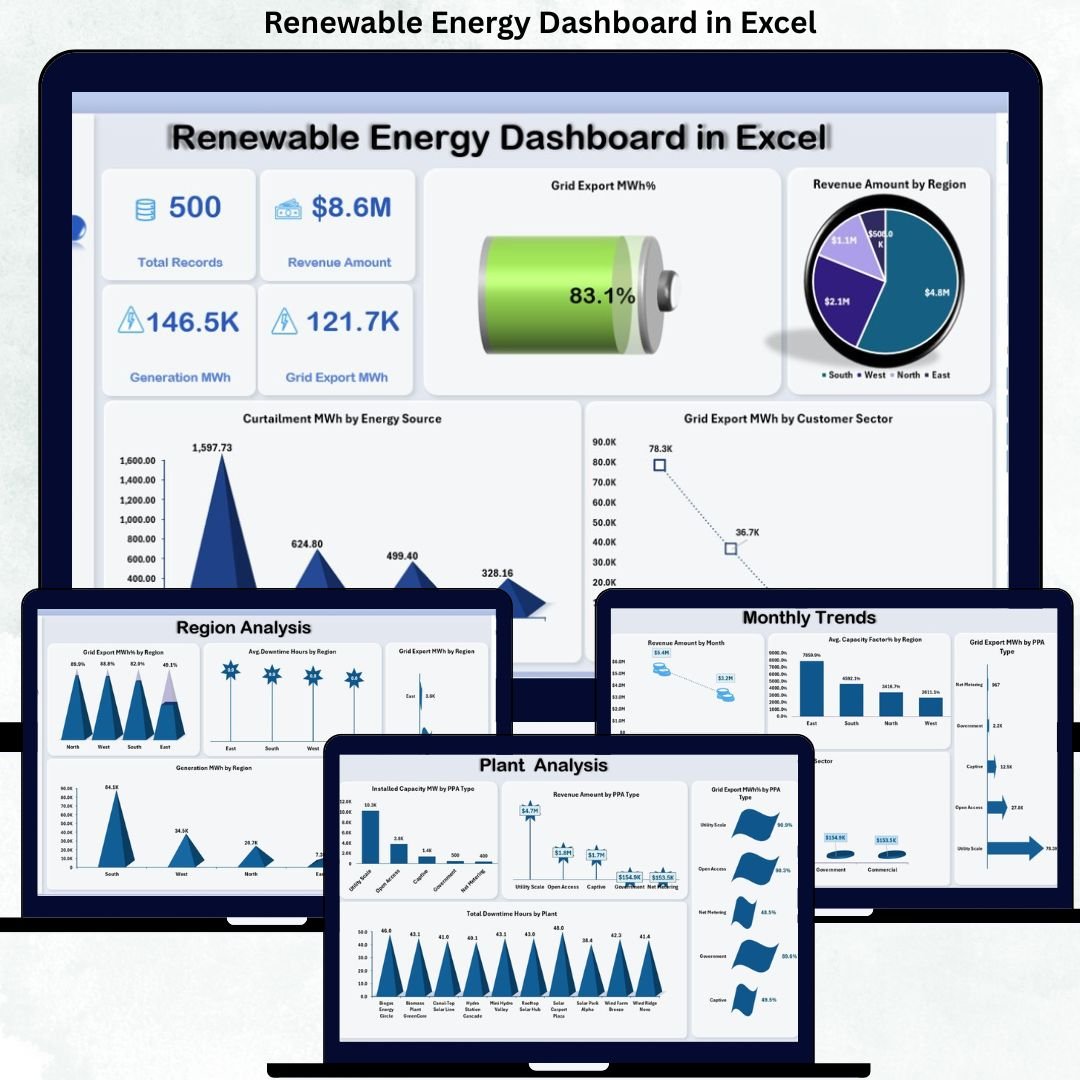
The Renewable Energy Dashboard in Excel is a ready-to-use, professional reporting solution designed to simplify renewable energy performance analysis. It transforms raw operational and financial data into clear, visual, and actionable insights—without the need for expensive BI tools or complex software.
Built entirely in Microsoft Excel, this dashboard helps energy companies, analysts, and project teams monitor generation, revenue, grid export, downtime, capacity, and efficiency using interactive sheets and automated KPIs. As a result, you save time, reduce errors, and make confident data-driven decisions.
⚡ Key Features of Renewable Energy Dashboard in Excel
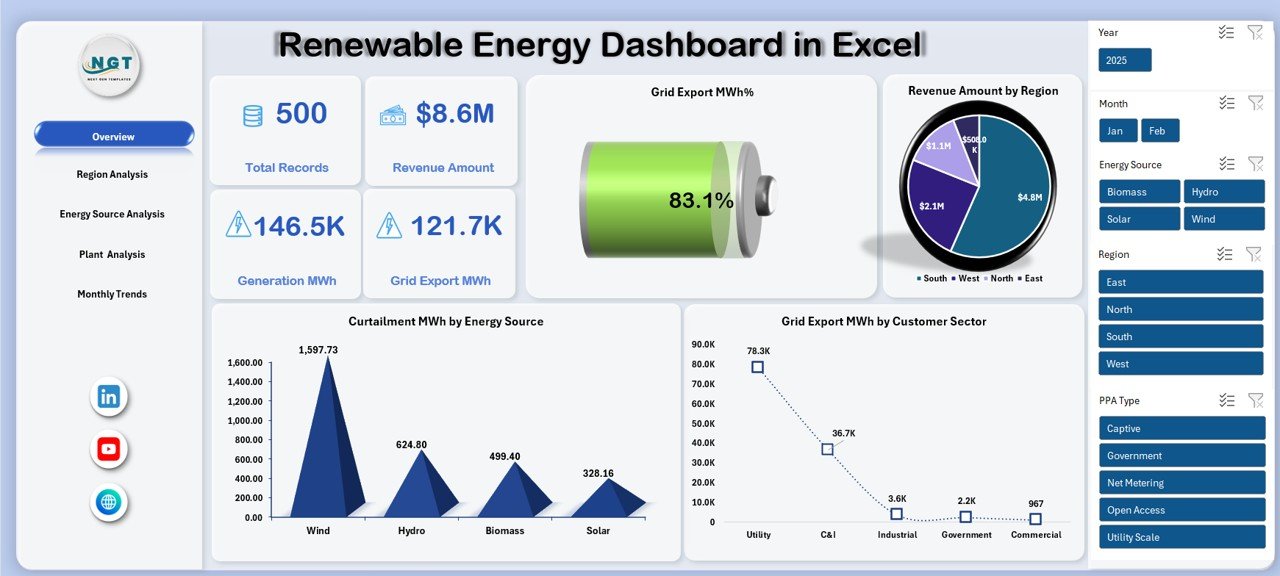
🚀 Executive Overview Sheet – Instantly view total records, revenue amount, generation MWh, grid export MWh, and export efficiency in one place.
📊 Multi-Dimensional Analysis – Analyze performance by region, energy source, plant, PPA type, and customer sector.
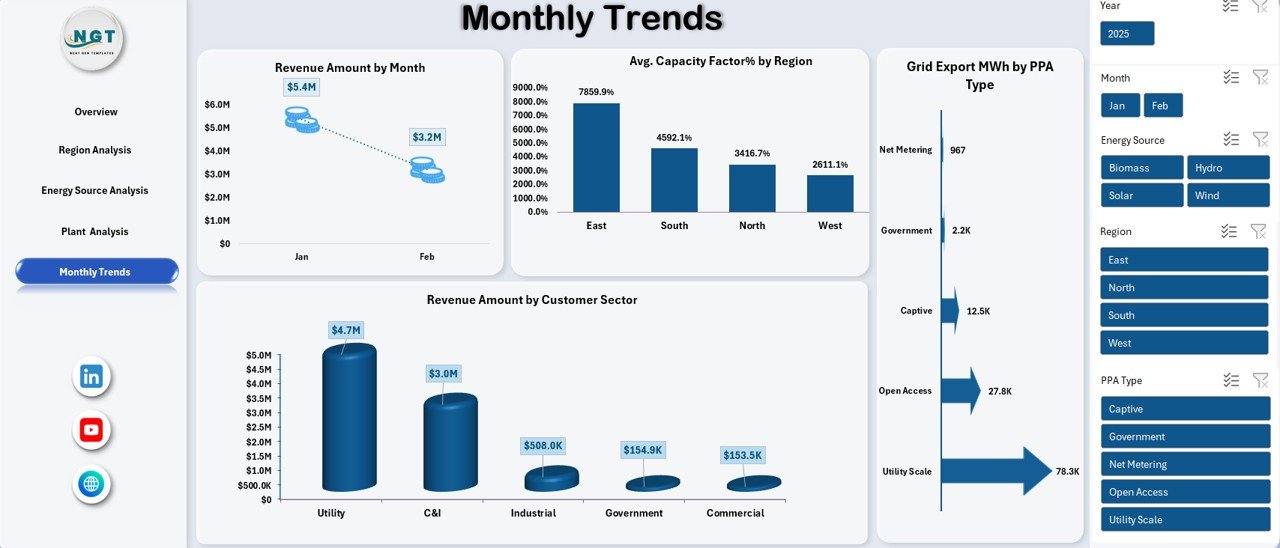
📈 Monthly Trend Tracking – Monitor revenue, capacity factor, and customer contribution trends over time.
🧭 Region-Wise Performance Comparison – Identify top and underperforming regions using export efficiency, downtime, and generation metrics.
🏭 Plant-Level Monitoring – Track downtime, capacity utilization, and revenue at the individual plant level.
🔄 Dynamic Pivot Charts & Slicers – Filter data instantly by region, energy source, PPA type, and time period.
💡 No Coding or Macros Required – 100% Excel-based using pivot tables and formulas.
💰 Cost-Effective Solution – No Power BI licenses or third-party tools needed.
📦 What’s Inside the Renewable Energy Dashboard in Excel
📄 Overview Sheet
Shows high-level KPIs such as total records, revenue amount, generation MWh, grid export MWh %, and curtailment analysis.
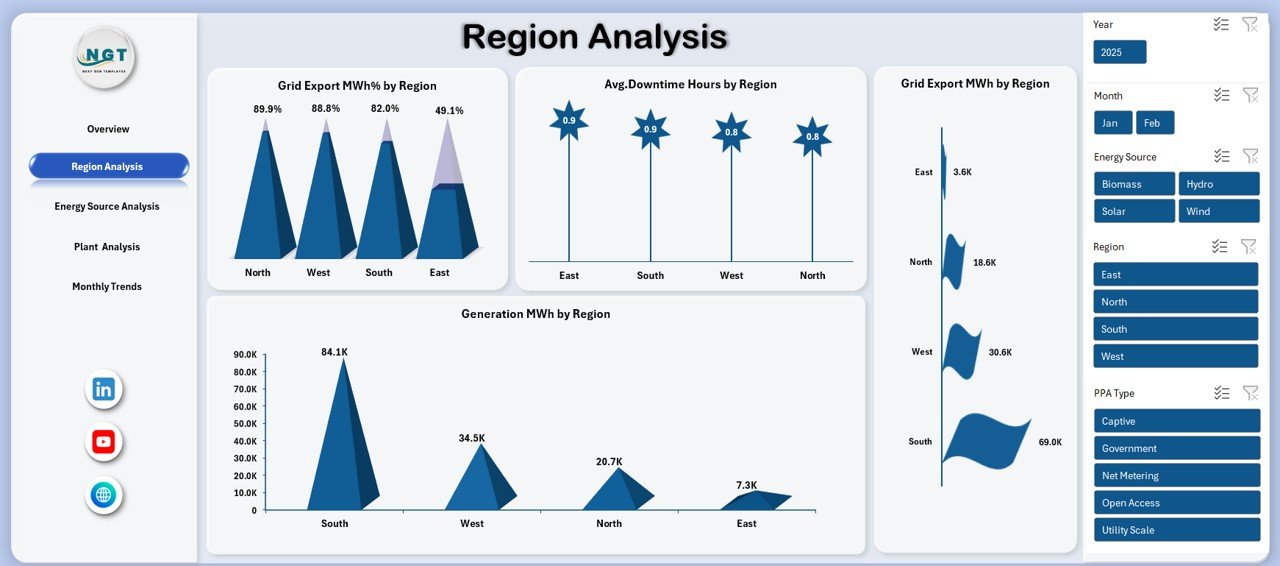
🌍 Region Analysis Sheet
Provides insights into grid export efficiency, downtime hours, and generation MWh across different regions.
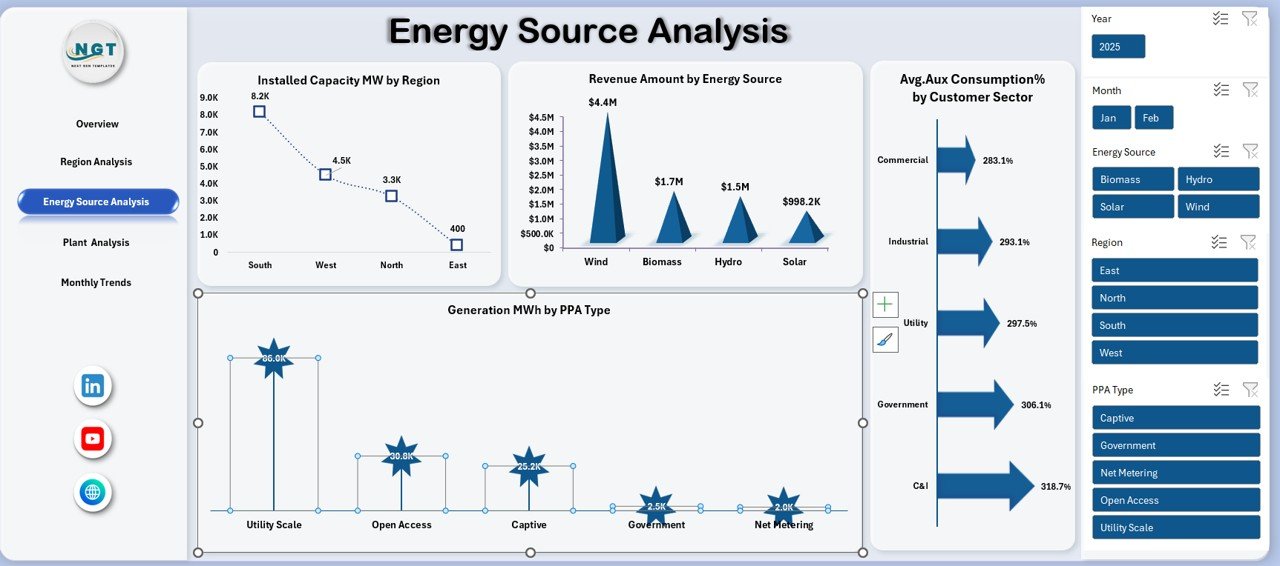
🔋 Energy Source Analysis Sheet
Breaks down performance by solar, wind, and other sources, including revenue contribution, installed capacity, and PPA-based generation.
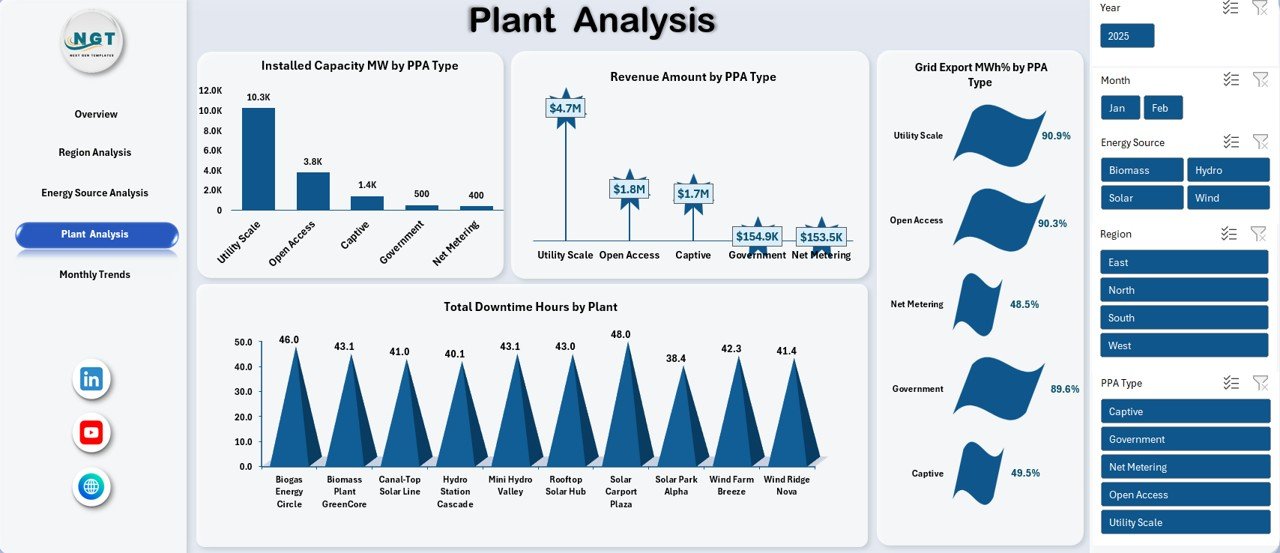
🏗️ Plant Analysis Sheet
Tracks plant-wise downtime, revenue by PPA type, installed capacity, and export efficiency.
📆 Monthly Trends Sheet
Visualizes revenue trends, average capacity factor %, and customer sector contribution month-by-month.
📊 Structured Excel Data Tables
Designed for easy data entry, accurate calculations, and scalable reporting.
🛠️ How to Use the Renewable Energy Dashboard in Excel
1️⃣ Enter or paste your renewable energy data into the structured input sheets
2️⃣ Refresh pivot tables with a single click
3️⃣ Use slicers to filter data by region, energy source, plant, or month
4️⃣ Analyze KPIs, trends, and performance gaps instantly
5️⃣ Use insights for reporting, planning, and decision-making
No advanced Excel skills are required—basic knowledge is enough to operate and customize the dashboard.
👥 Who Can Benefit from This Renewable Energy Dashboard in Excel
🌞 Renewable energy companies
🌬️ Solar and wind farm operators
📊 Energy analysts and consultants
⚙️ Operations & maintenance teams
💼 Finance and revenue managers
🌱 Sustainability and ESG professionals
🏛️ Energy project stakeholders and investors
Whether you manage a single plant or multiple regions, this dashboard adapts to your business scale.
Click here to read the Detailed Blog Post
Watch the step-by-step video tutorial:
Visit our YouTube channel to learn step-by-step video tutorials:


Reviews
There are no reviews yet.