Managing a packaging business without real-time visibility is like running a plant blindfolded. Production targets, waste levels, quality standards, machine efficiency, and delivery timelines change constantly—and relying on manual reports slows everything down.
That is exactly why the Packaging Industry KPI Dashboard in Excel is a must-have management tool for modern packaging companies.
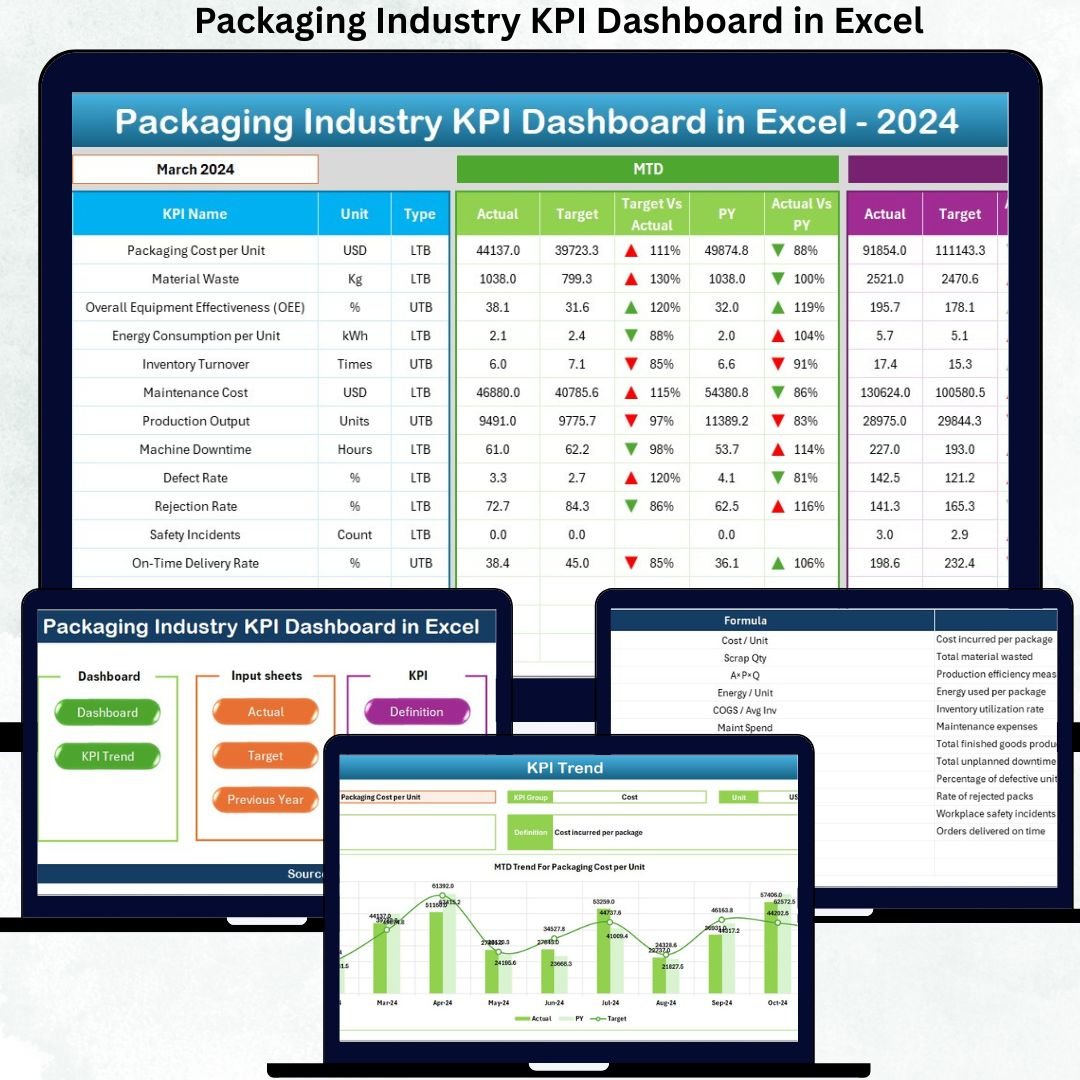
This ready-to-use Excel dashboard transforms raw operational data into clear insights, visual clarity, and action-ready KPIs. Instead of juggling multiple Excel files, this dashboard gives you one centralized performance control center—simple, flexible, and powerful.
Whether you operate in food packaging, pharma packaging, corrugated boxes, flexible packaging, or industrial packaging, this dashboard helps you monitor performance, control costs, and improve productivity—without expensive BI tools.
⭐ Key Feature of Packaging Industry KPI Dashboard in Excel
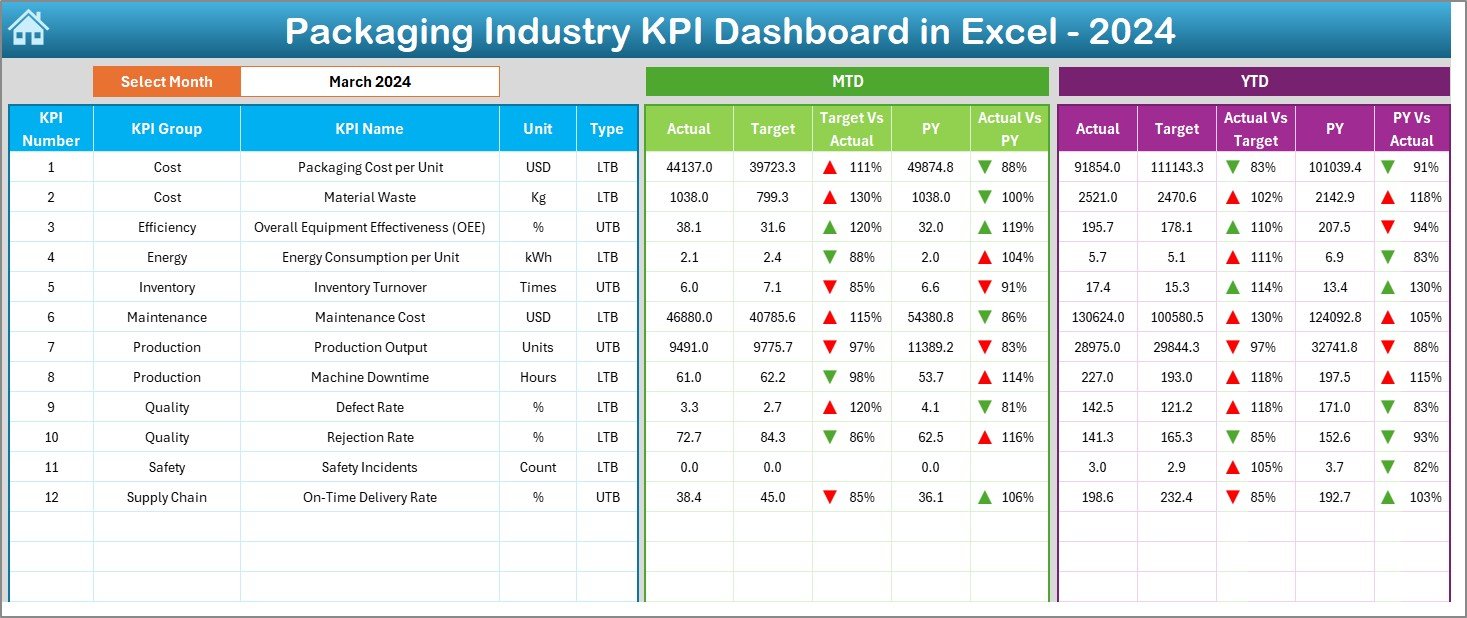
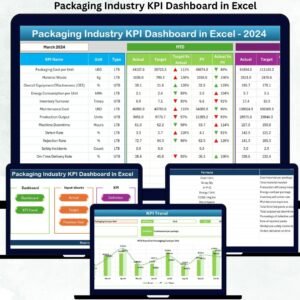
📊 All KPIs on One Screen – Track production, quality, cost, and delivery KPIs from a single dashboard
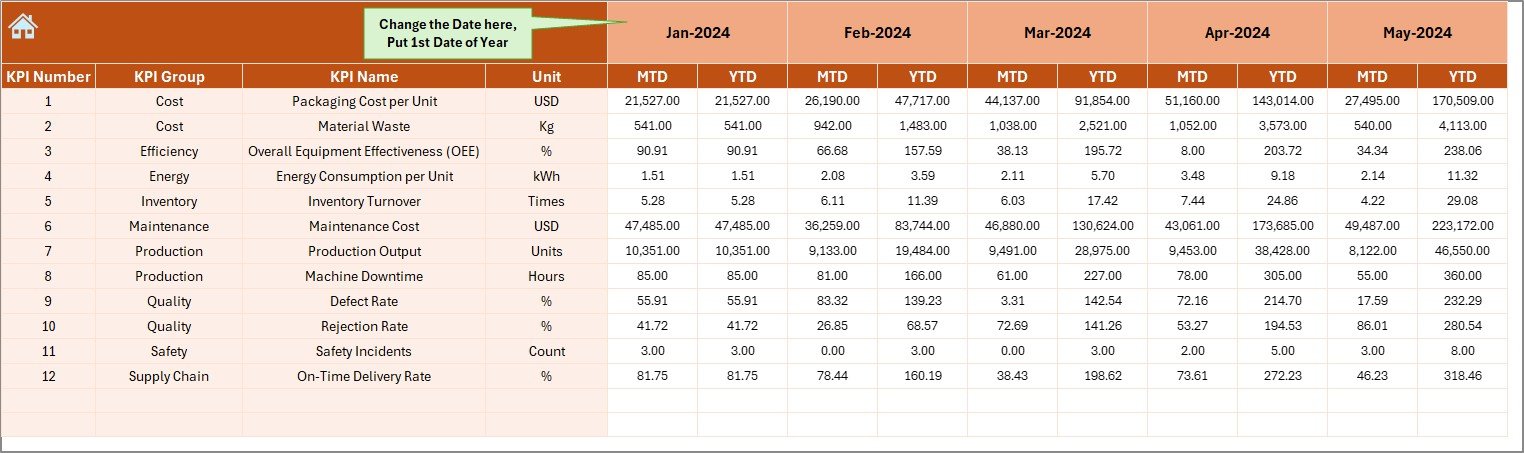
📅 Dynamic Month Selection – Change the month and instantly refresh the entire dashboard
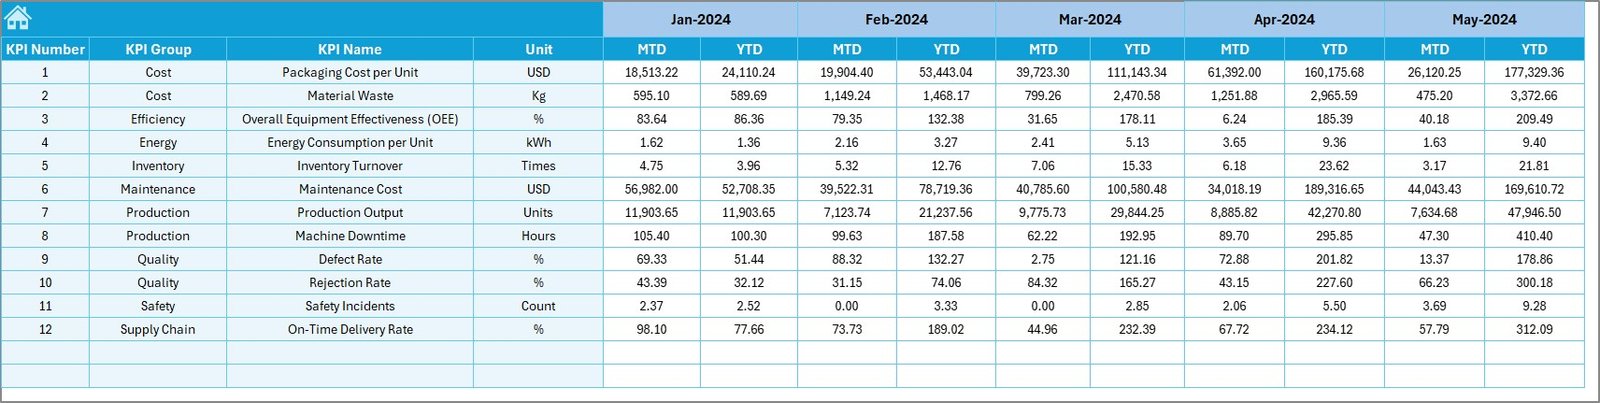
📈 MTD & YTD Performance Tracking – Compare Actual, Target, and Previous Year values effortlessly
🔼🔽 Smart Conditional Formatting – Instantly spot performance gaps with up/down arrows
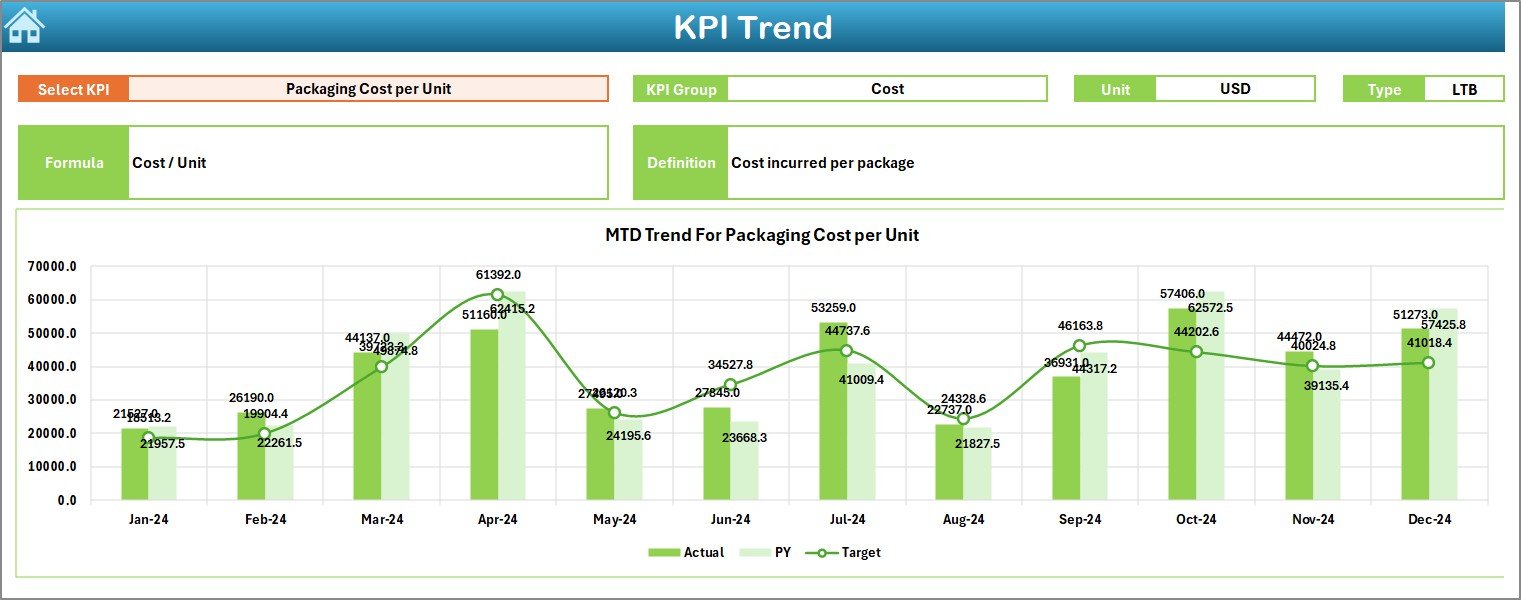
📉 Trend Analysis by KPI – Analyze performance movement over time, not just static numbers
🎯 Target vs Actual Monitoring – Keep teams accountable to defined operational goals
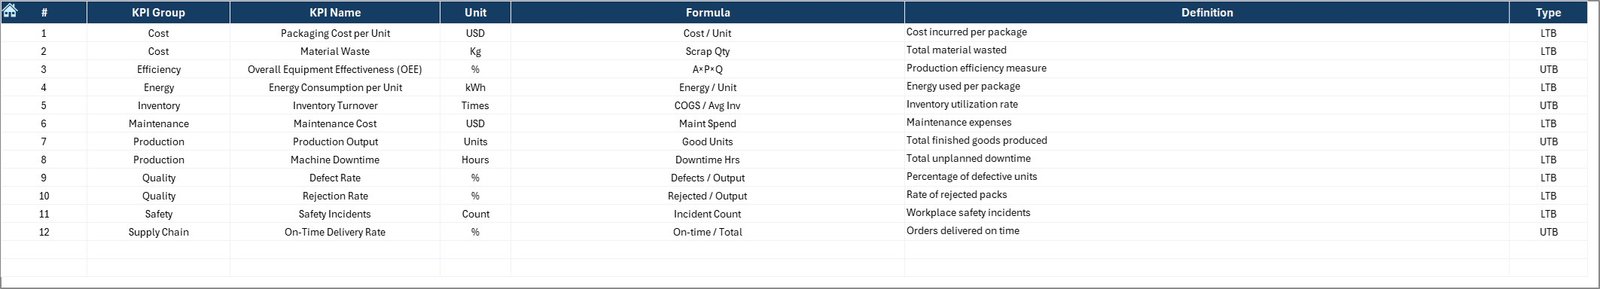
🧠 Fully Documented KPI Definitions – Avoid confusion with built-in KPI logic and explanations
💼 100% Excel-Based Solution – No Power BI, no coding, no additional software costs
📂 What’s Inside the Packaging Industry KPI Dashboard?
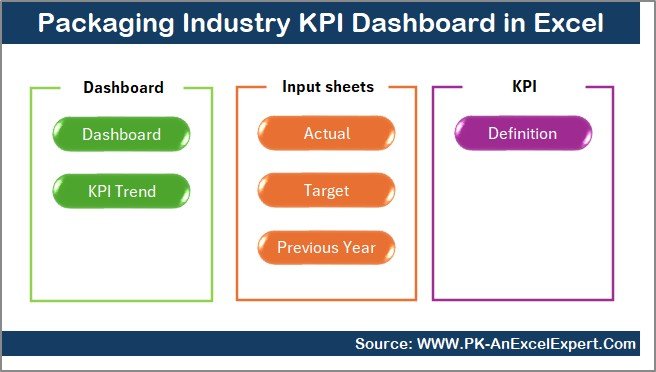
This digital product includes 7 well-structured Excel worksheets, each serving a clear business purpose:
📌 Summary Page (Index Sheet)
A clean navigation hub with six buttons to jump to any analysis instantly.
📌 Dashboard Sheet
The central KPI view showing MTD & YTD Actual, Target, and Previous Year values with variance indicators.
📌 Trend Sheet
Select any KPI and analyze monthly and yearly performance trends, including KPI formula and definition.
📌 Actual Numbers Input Sheet
Simple, controlled data-entry area to maintain accuracy and protect formulas.
📌 Target Sheet
Define monthly and yearly KPIs aligned with operational and strategic goals.
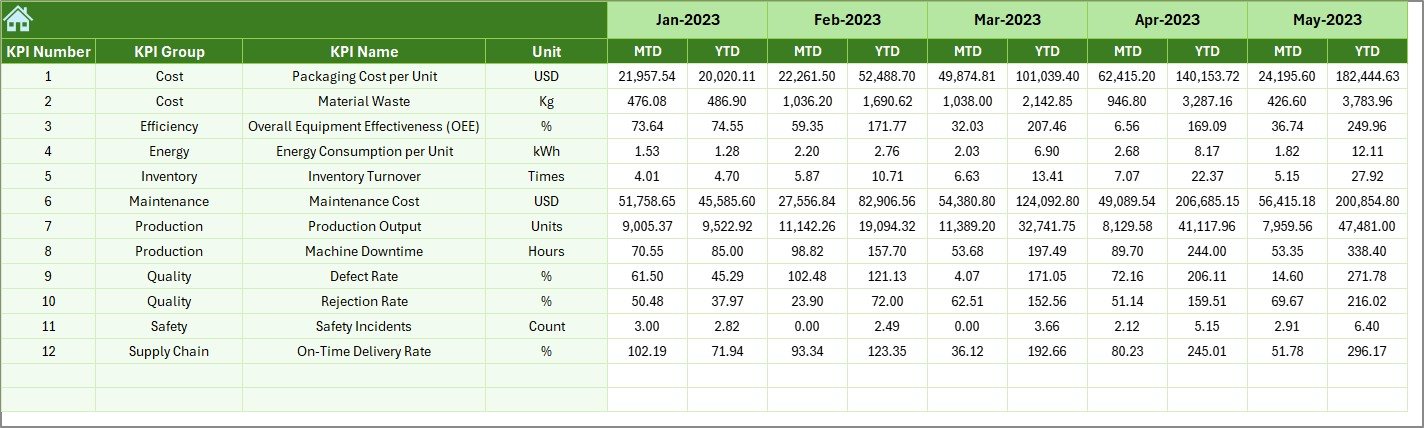
📌 Previous Year Number Sheet
Enable year-on-year comparison to assess growth and seasonal impact.
📌 KPI Definition Sheet
A complete documentation layer covering KPI name, group, unit, formula, and explanation.
🚀 How to Use the Packaging Industry KPI Dashboard
✅ Step 1: Enter your actual performance data in the input sheet
✅ Step 2: Define monthly and yearly targets
✅ Step 3: Select a month from the dashboard drop-down
✅ Step 4: Instantly view MTD & YTD comparisons
✅ Step 5: Analyze performance trends and gaps
✅ Step 6: Use insights in review meetings and decision-making
No advanced Excel knowledge required—if you can use Excel, you can use this dashboard.
👥 Who Can Benefit from This Product?
🏭 Packaging Plant Managers – Monitor production and efficiency
🔧 Production Supervisors – Track output, downtime, and waste
✅ Quality Control Teams – Analyze rejection and compliance trends
📊 Operations Heads – Align targets with performance
💰 Finance & Costing Teams – Control cost per unit and inefficiencies
🧑💼 Business Owners & Leadership – Make faster, data-backed decisions
📖 Click here to read the Detailed blog post
Watch the step-by-step video tutorial:


Reviews
There are no reviews yet.