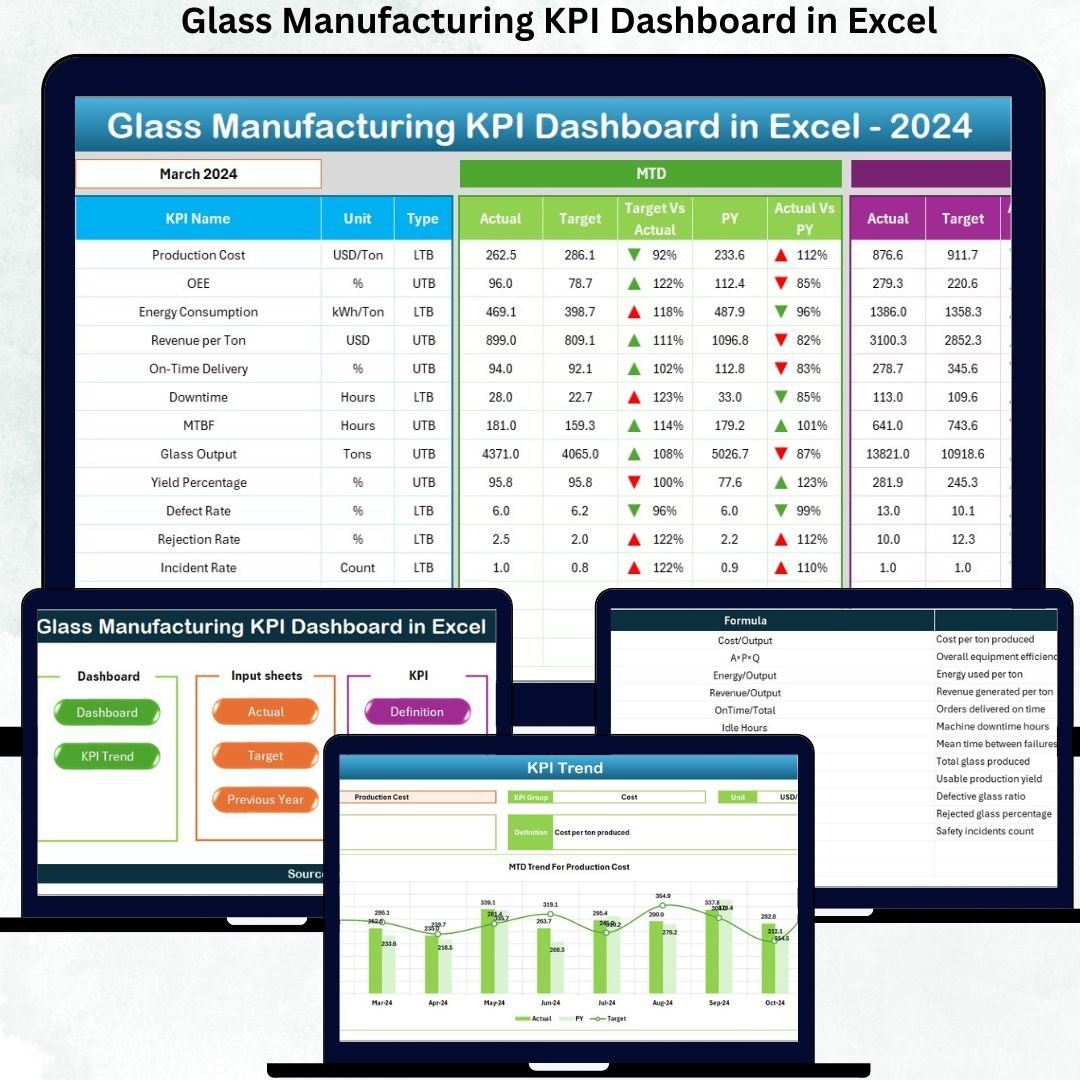
Running a glass manufacturing plant without real-time KPI visibility can quietly drain profits. Rising scrap, unplanned downtime, missed production targets, and delayed corrective actions are often the result of fragmented reports and manual tracking. That is why the Glass Manufacturing KPI Dashboard in Excel is designed as a powerful, ready-to-use performance control system for glass manufacturers.
This professionally designed Excel dashboard converts your raw production data into clear, visual, and actionable KPIs—without Power BI, coding, or complex systems. Whether you manage float glass, container glass, or specialty glass operations, this dashboard gives you instant clarity across production, quality, targets, and trends.
Built entirely in Microsoft Excel, this solution is easy to use, scalable, and ideal for daily, monthly, and yearly performance monitoring.
✅ Key Features of Glass Manufacturing KPI Dashboard in Excel
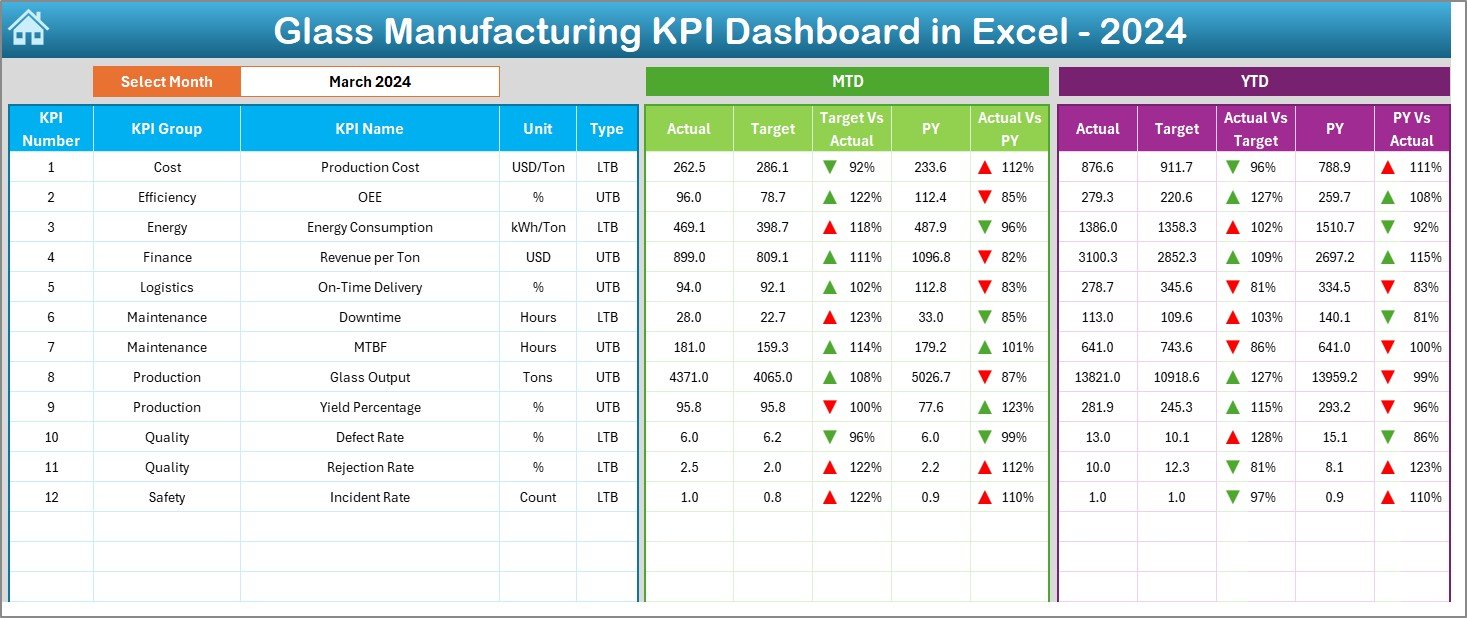
🔥 Dynamic Month Selector – Instantly switch months and see the entire dashboard update automatically.
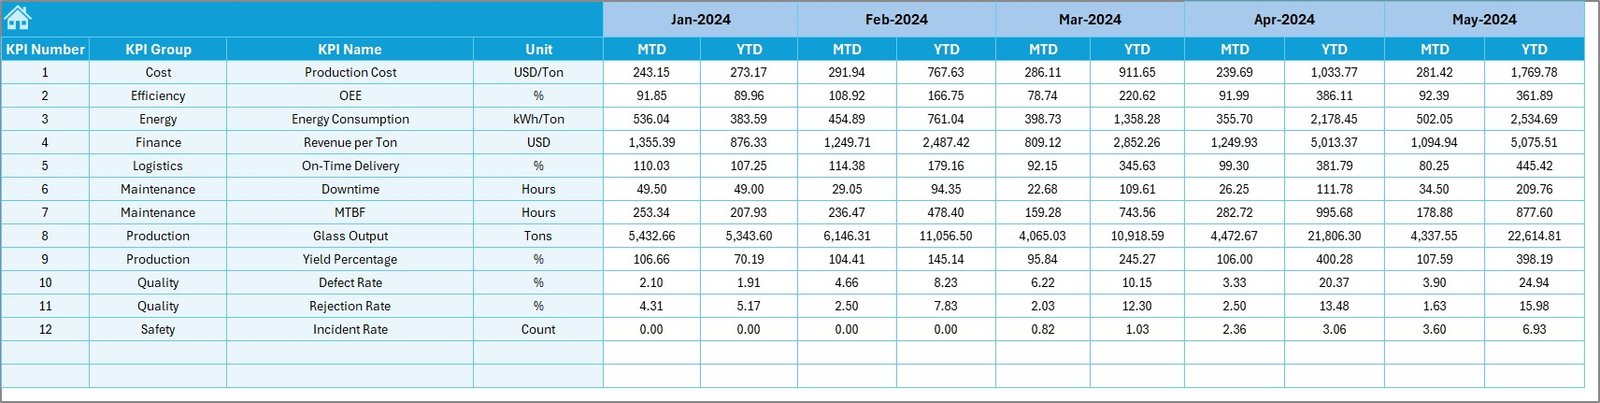
📊 MTD & YTD Performance Tracking – Monitor Month-to-Date and Year-to-Date Actual, Target, and Previous Year values.
🎯 Target vs Actual Analysis – Identify performance gaps using visual comparisons and indicators.
📈 Previous Year (YOY) Comparison – Track growth, decline, or consistency over time.
🔺 Conditional Formatting Alerts – Up and down arrows highlight performance improvement or deterioration instantly.
🧭 Centralized KPI View – All critical KPIs displayed in one executive-friendly dashboard.
🧩 Customizable KPI Framework – Easily modify KPIs to match your glass manufacturing process.
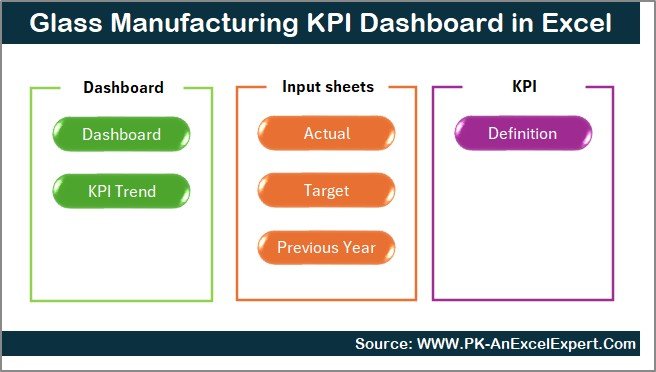
📦 What’s Inside the Glass Manufacturing KPI Dashboard
This ready-to-use Excel file includes 7 structured worksheets, each serving a specific analytical purpose:
📌 Summary Page (Index Sheet)
A clean navigation hub with clickable buttons to jump between all dashboard sections.
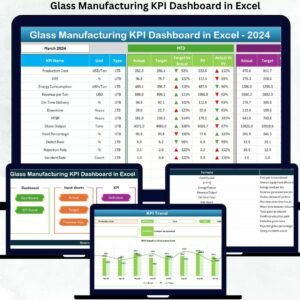
📌 Dashboard Sheet (Main View)
The core performance screen showing:
-
MTD Actual, Target & PY
-
YTD Actual, Target & PY
-
Target vs Actual & PY vs Actual
-
Visual indicators for faster decision-making
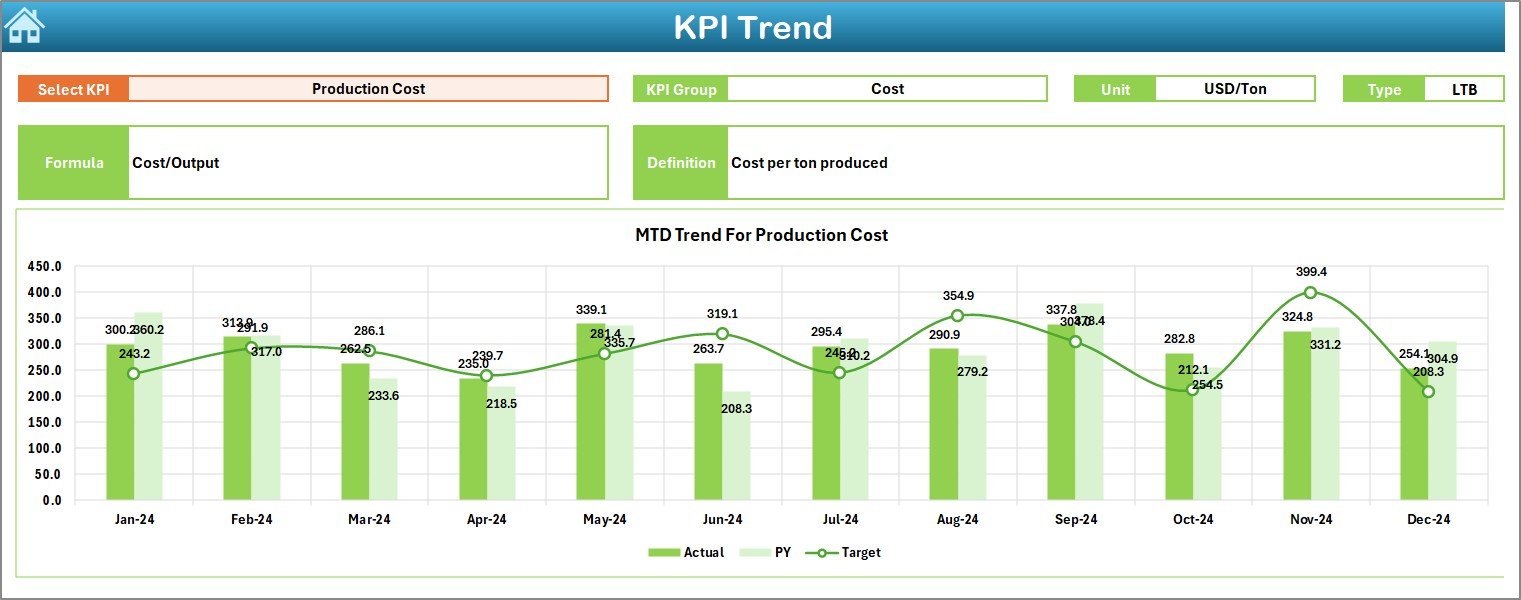
📌 Trend Sheet
Track individual KPIs over time with:
-
MTD and YTD trend charts
-
KPI group, unit, formula, and definition details
-
Drop-down KPI selection
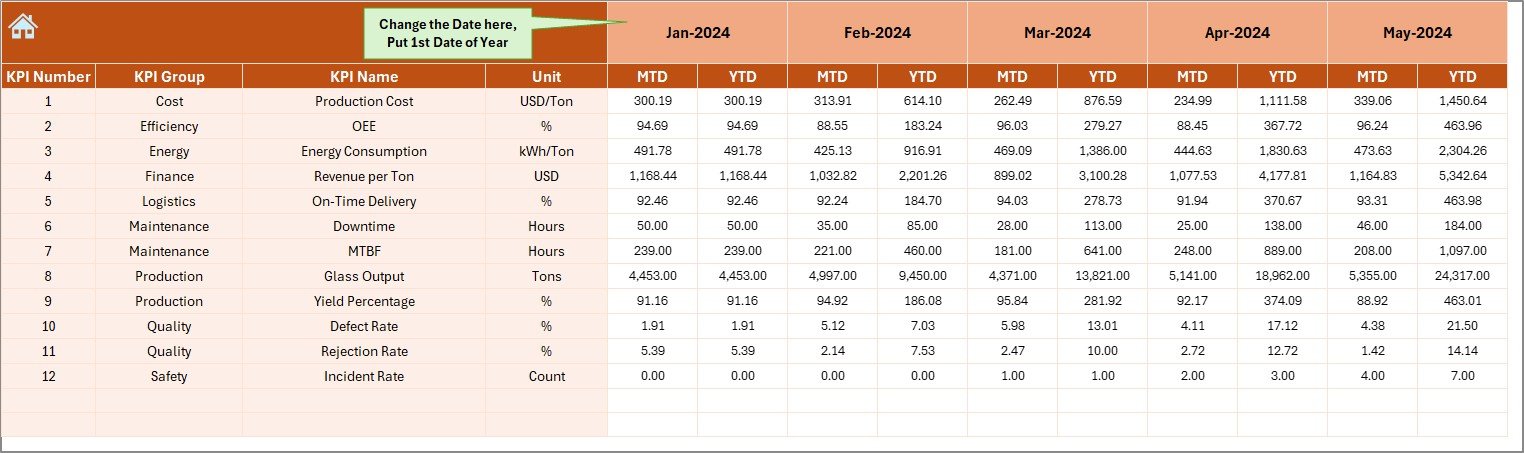
📌 Actual Numbers Input Sheet
Simple, structured input for MTD and YTD actual values with automatic month handling.
📌 Target Sheet
Enter monthly MTD and YTD targets to enable accurate performance benchmarking.
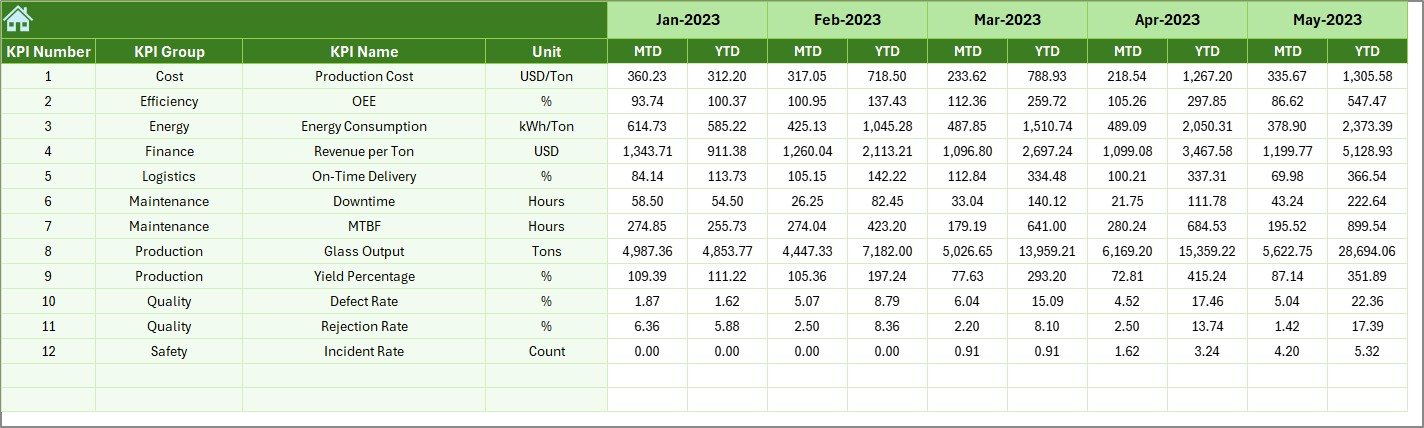
📌 Previous Year Numbers Sheet
Store last year’s KPI data to enable meaningful year-over-year comparisons.
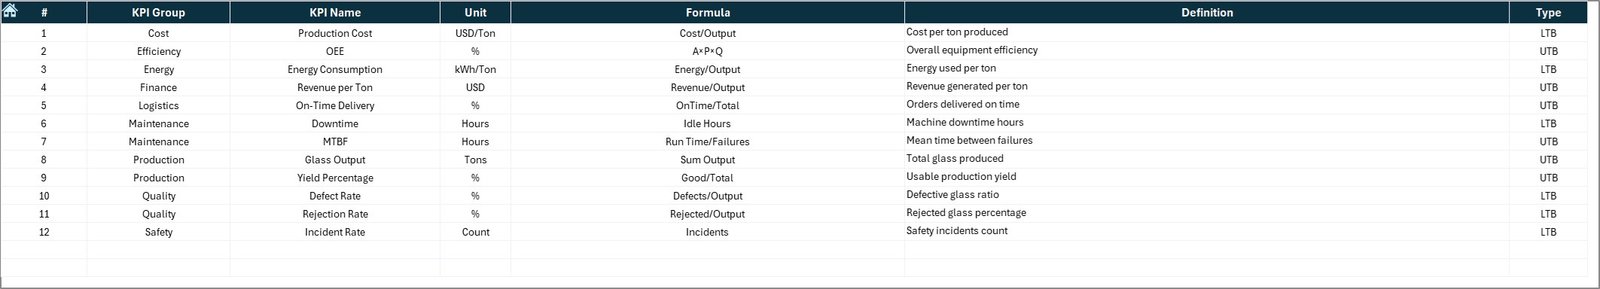
📌 KPI Definition Sheet
Define KPI names, groups, units, formulas, and definitions to maintain consistency across teams.
🧭 How to Use the Glass Manufacturing KPI Dashboard
1️⃣ Enter KPI definitions and structure in the KPI Definition sheet
2️⃣ Update Actual, Target, and Previous Year data
3️⃣ Select the desired month using the dashboard drop-down
4️⃣ Instantly analyze MTD, YTD, trends, and variances
5️⃣ Use insights to take quick corrective actions
No advanced Excel knowledge is required—basic Excel skills are enough.
🎯 Who Can Benefit from This Product
👷 Plant Managers – Monitor operational efficiency and bottlenecks
🏭 Production Heads – Track yield, downtime, and capacity utilization
✅ Quality Managers – Control scrap, rework, and defect trends
📊 Operations & CI Teams – Drive continuous improvement initiatives
🧑💼 Manufacturing Leadership – Make faster, data-driven decisions
📘 Click here to read the Detailed Blog Post
Watch the step-by-step video tutorial:


Reviews
There are no reviews yet.