In modern digital workplaces, knowledge sharing and collaboration are no longer optional—they directly impact productivity, innovation, and employee engagement. Yet, most organizations still struggle to measure collaboration performance in a structured and meaningful way. Data often sits across emails, documents, LMS tools, and chat platforms, making analysis slow and unclear.Knowledge Sharing & Collaboration KPI Dashboard in Excel
That is exactly why the Knowledge Sharing & Collaboration KPI Dashboard in Excel is a must-have digital solution.
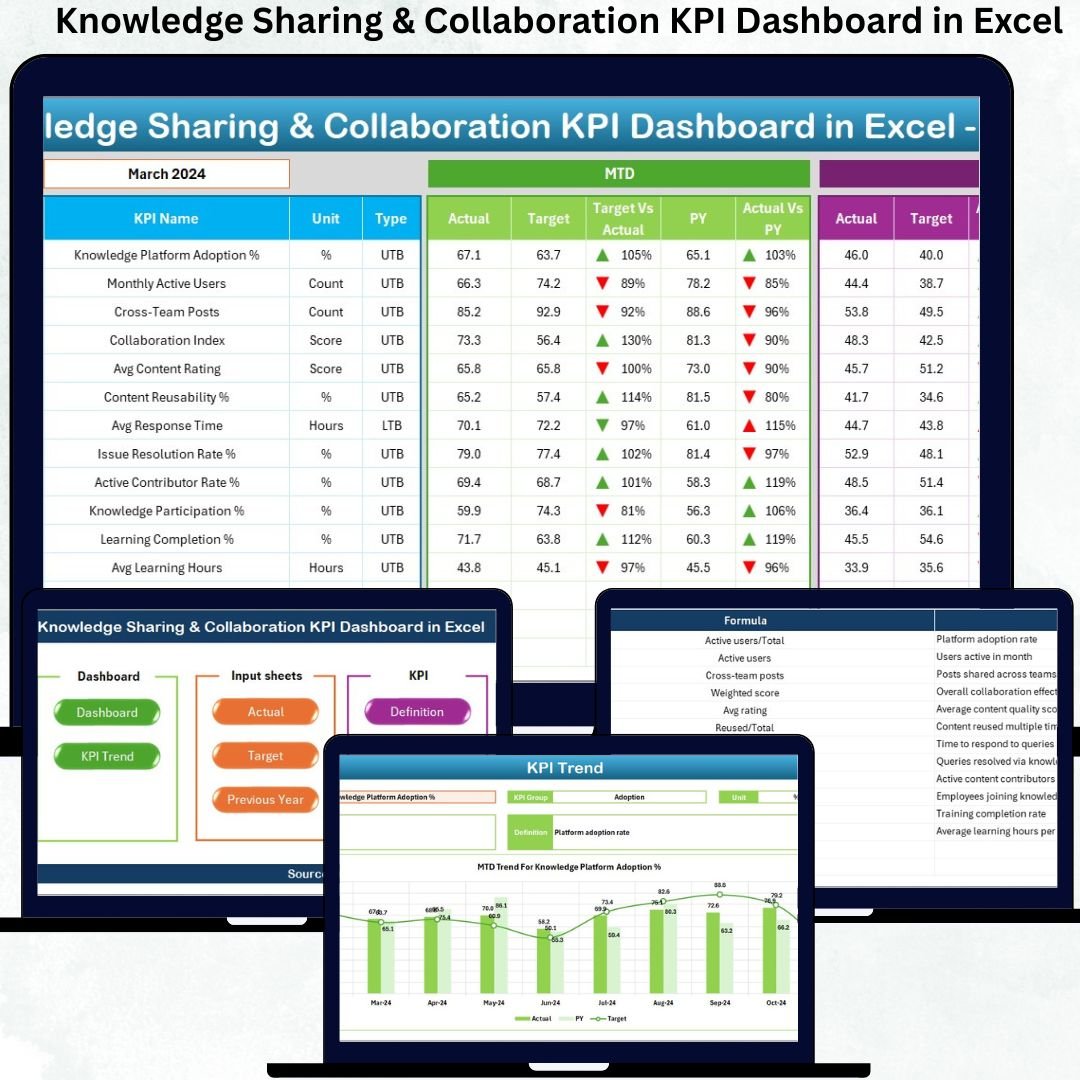
This ready-to-use Excel dashboard helps organizations track, measure, and improve collaboration performance using clearly defined KPIs, automated calculations, and powerful visual insights—without requiring complex BI tools or advanced technical skills.
🔑 Key Features of Knowledge Sharing & Collaboration KPI Dashboard in Excel
✅ Centralized KPI Monitoring – Track all collaboration and knowledge-sharing KPIs in a single Excel dashboard
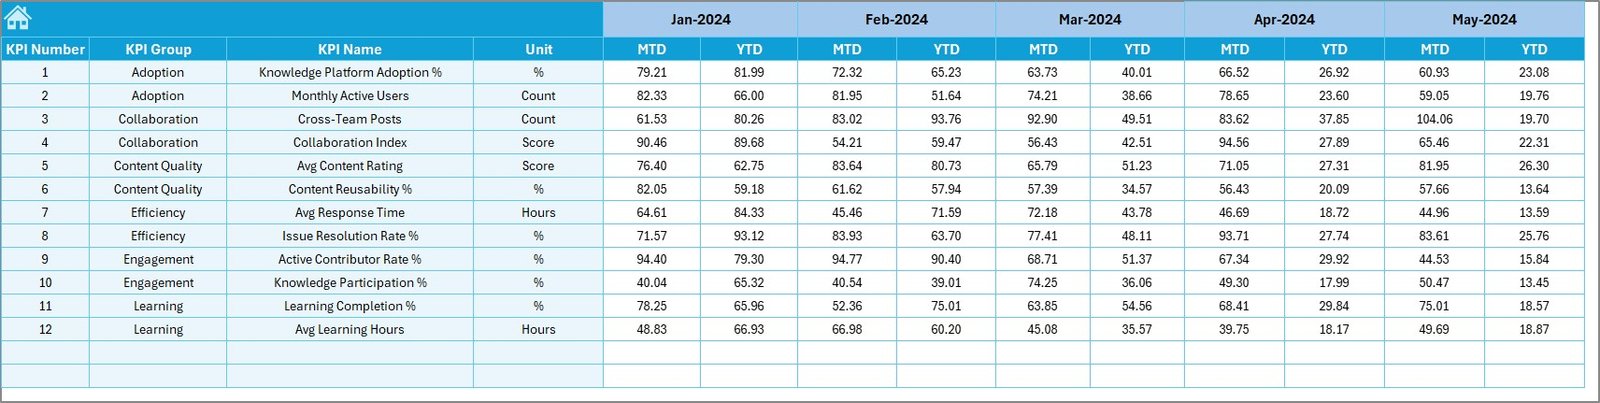
✅ MTD & YTD Performance Tracking – Monitor Month-to-Date and Year-to-Date performance instantly
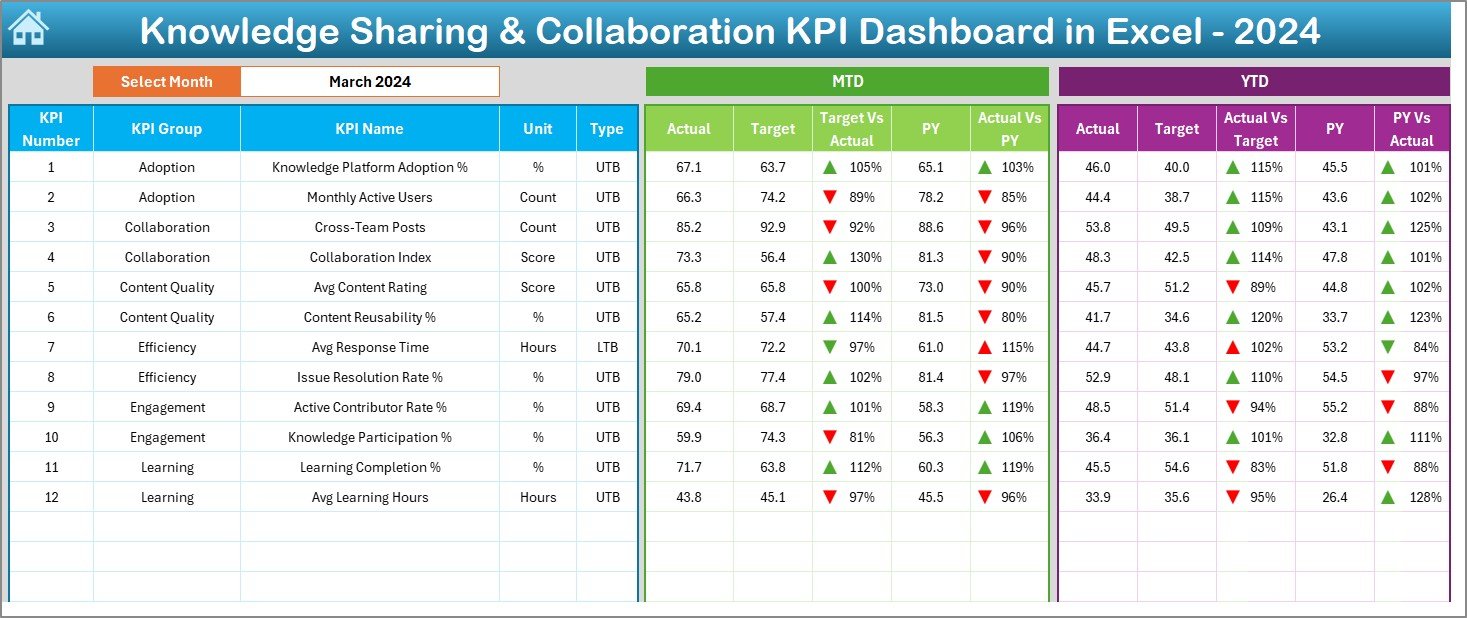
✅ Target vs Actual Analysis – Identify performance gaps using automatic comparisons
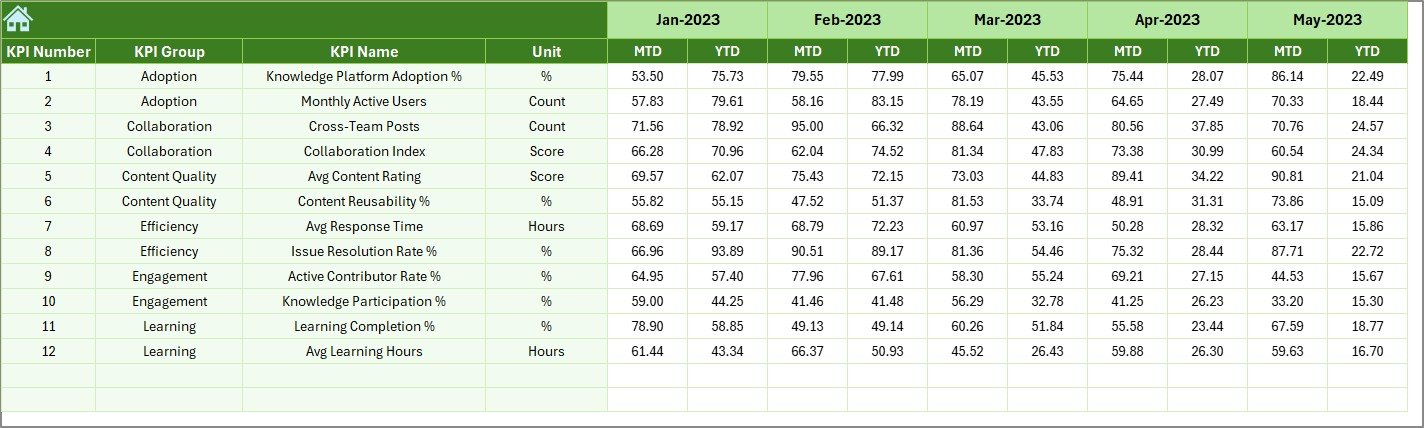
✅ Previous Year Benchmarking – Measure long-term improvement with PY vs Current Year analysis
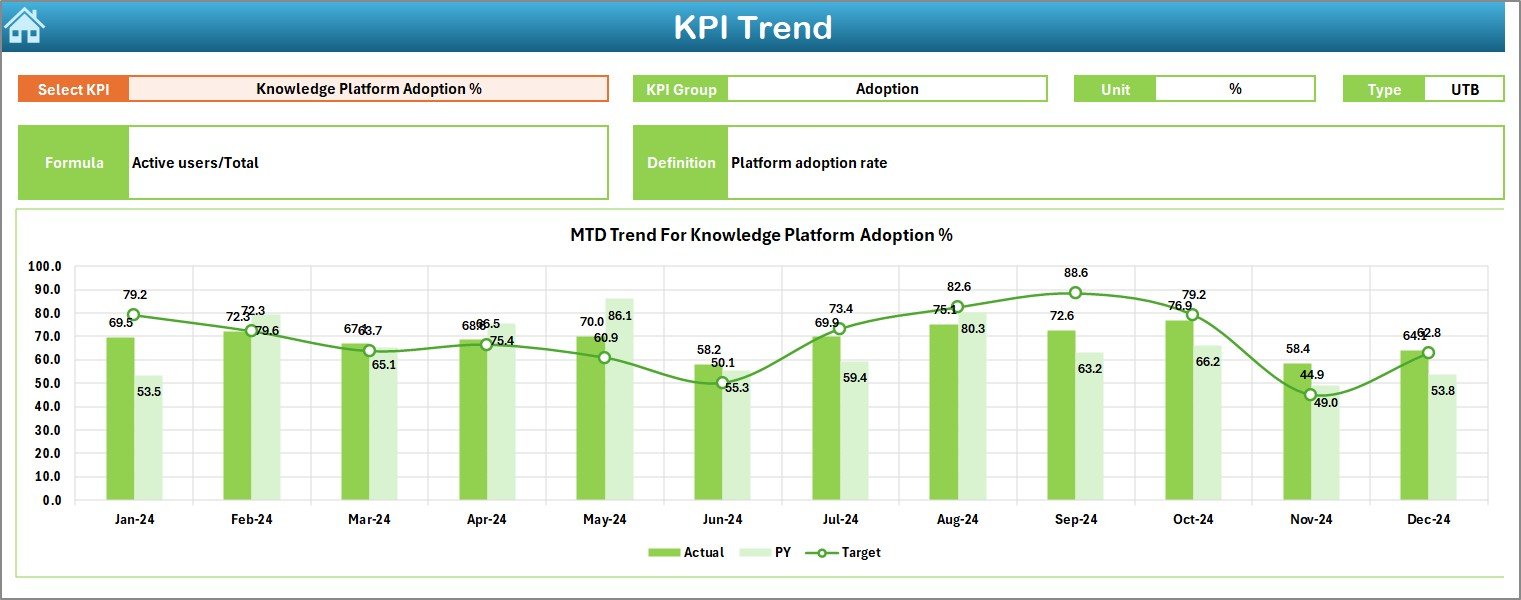
✅ Trend Analysis – Understand performance direction through KPI-wise trend charts
✅ Conditional Formatting Indicators – Up/down arrows highlight improvement or decline instantly
✅ User-Friendly Navigation – One-click buttons for smooth movement between dashboard sheets
As a result, teams spend less time compiling reports and more time driving collaboration improvements.
📦 What’s Inside the Knowledge Sharing & Collaboration KPI Dashboard in Excel
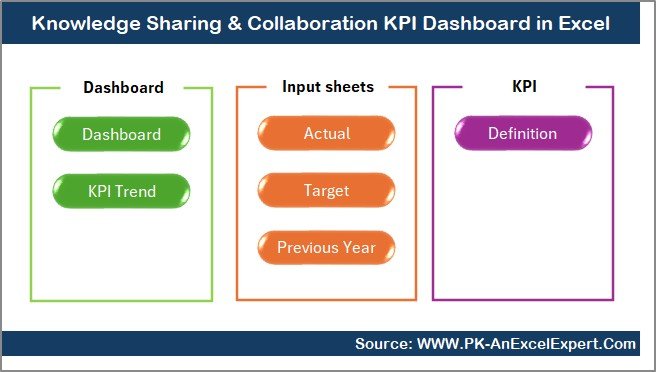
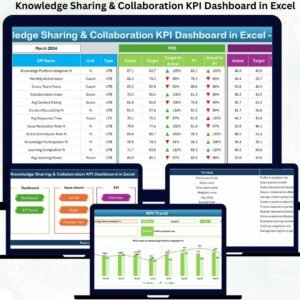
This digital product includes a structured 7-worksheet Excel dashboard, designed for clarity and ease of use:Knowledge Sharing & Collaboration KPI Dashboard in Excel
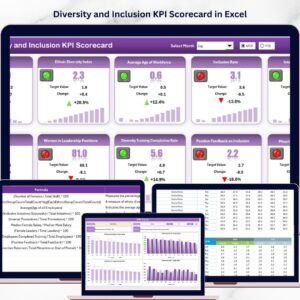
📊 Summary Page – A clean navigation hub with six clickable buttons for quick access
📈 Dashboard Sheet – Main KPI performance view showing MTD, YTD, Target, and PY comparisons
📉 Trend Sheet – Deep KPI-wise trend analysis with KPI definitions, units, and performance charts
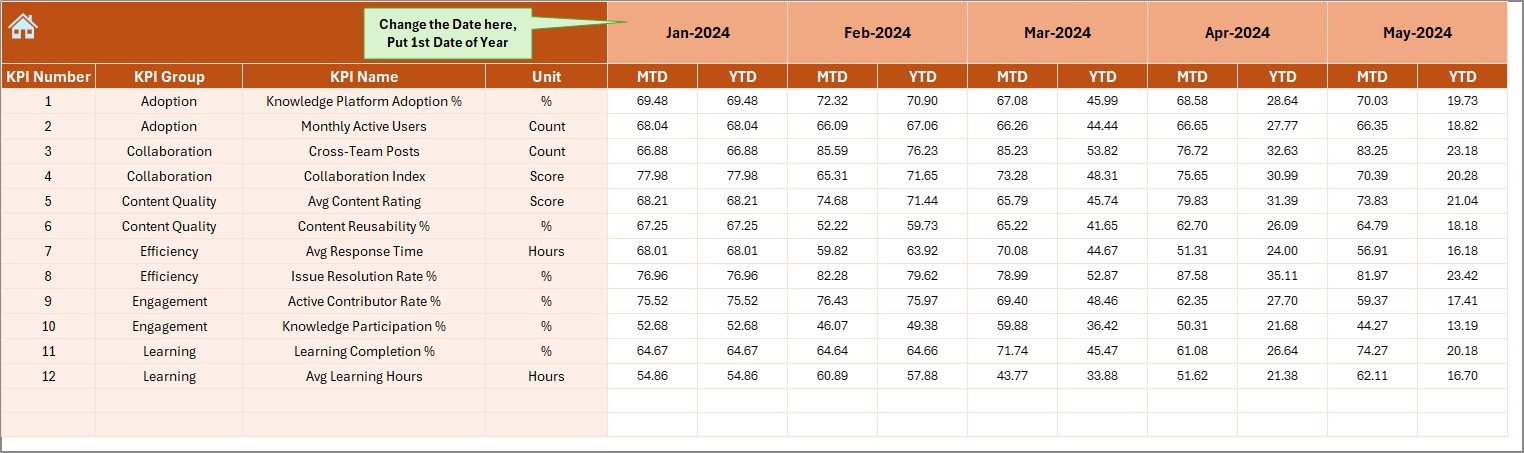
✍️ Actual Numbers Input Sheet – Simple monthly data entry for MTD and YTD values
🎯 Target Sheet – Define realistic KPI targets for effective performance measurement
📜 Previous Year Numbers Sheet – Enable year-over-year benchmarking
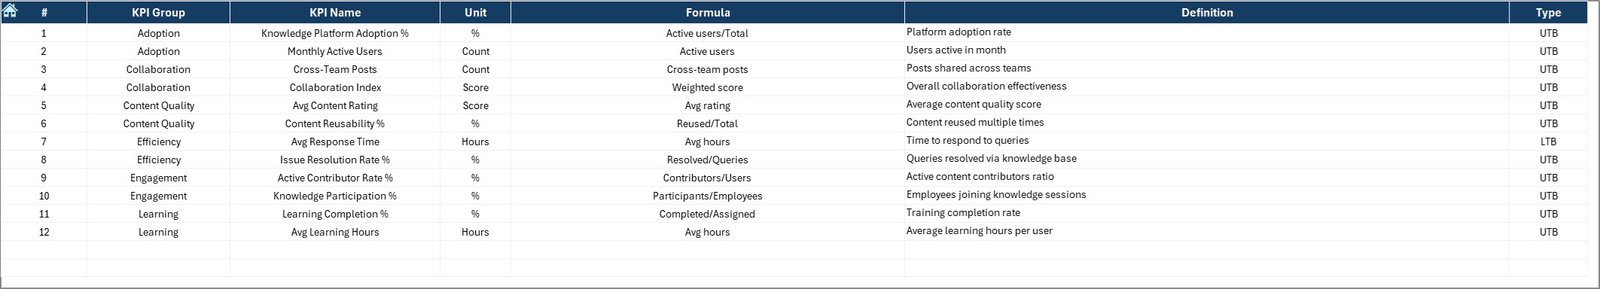
📘 KPI Definition Sheet – Central reference with KPI name, group, unit, formula, definition, and KPI type (LTB/UTB)
Together, these sheets create a robust and scalable KPI tracking system.
🚀 How to Use the Knowledge Sharing & Collaboration KPI Dashboard in Excel
Using this dashboard is simple and intuitive:
1️⃣ Enter monthly actual values in the Actual Numbers Input Sheet
2️⃣ Define KPI targets in the Target Sheet
3️⃣ Add last year’s data in the Previous Year Numbers Sheet
4️⃣ Select the desired month from the dropdown in the Dashboard Sheet
5️⃣ Review performance indicators, comparisons, and trends instantly
No macros, no coding, and no advanced Excel skills required.Knowledge Sharing & Collaboration KPI Dashboard in Excel
👥 Who Can Benefit from This Knowledge Sharing & Collaboration KPI Dashboard?
This Excel KPI dashboard is ideal for:
👤 HR & People Analytics Teams – Measure collaboration and engagement
📚 Learning & Development Managers – Track learning participation and effectiveness
🧠 Knowledge Management Teams – Monitor content creation and reuse
📋 Project & Program Managers – Ensure cross-team collaboration efficiency
🏢 Leadership & Strategy Teams – Make data-driven decisions
🏪 SMEs & Large Enterprises – Scalable for organizations of all sizes
If your organization values learning culture and continuous improvement, this dashboard delivers immediate value.
🔗 Click here to read the Detailed blog post
Watch the step-by-step video tutorial:
🎥 Visit our YouTube Channel to learn step-by-step video tutorials


Reviews
There are no reviews yet.