
Managing water resources is now more important than ever. Whether you oversee industrial plants, commercial facilities, municipal systems, or sustainability programs, you need a simple and reliable way to track how water is consumed, treated, stored, and saved. The Water Resource Management KPI Dashboard in Excel gives you that clarity with a clean, automated, and fully interactive reporting system. Built for professionals who want accuracy without complexity, this dashboard turns scattered data into meaningful insights within seconds. 💧📊
Designed using Excel’s powerful formulas, charts, drop-downs, and conditional formatting, this dashboard helps you monitor critical KPIs such as water consumption, leakage percentage, recycling rate, treatment efficiency, pump energy usage, storage levels, and more. With just one click, you can switch months, compare year-on-year performance, and track how each KPI is progressing over time. This makes it a perfect tool for daily operations, audits, planning, and compliance reporting.
Key Features of Water Resource Management KPI Dashboard in Excel 🌟
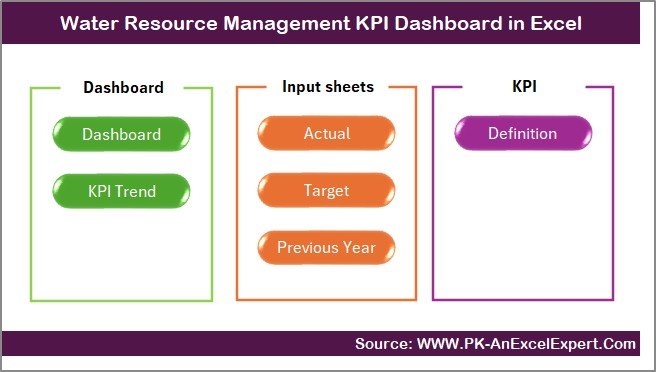
The dashboard includes seven expertly designed worksheets, each tailored to simplify water monitoring:
-
Summary Page – Quick navigation buttons to jump instantly to any sheet
-
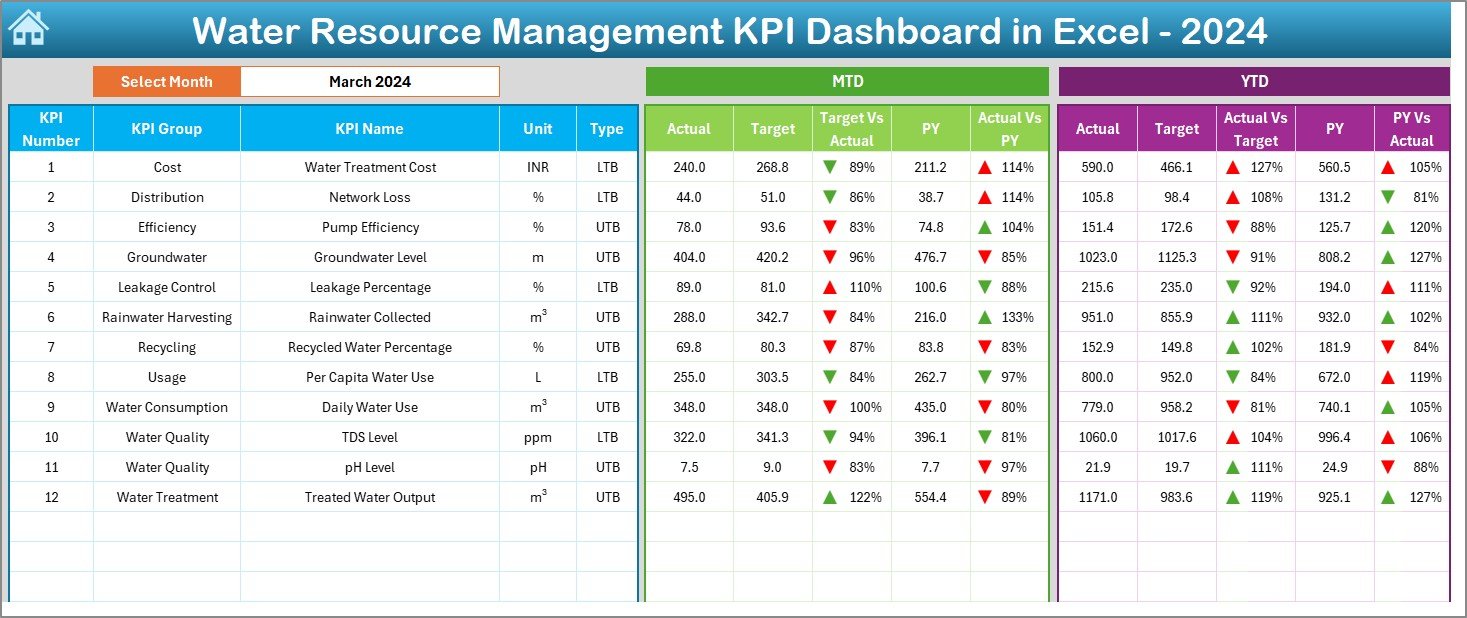
Dashboard Page – Displays all KPIs with MTD, YTD, Target, and Previous Year comparisons
-
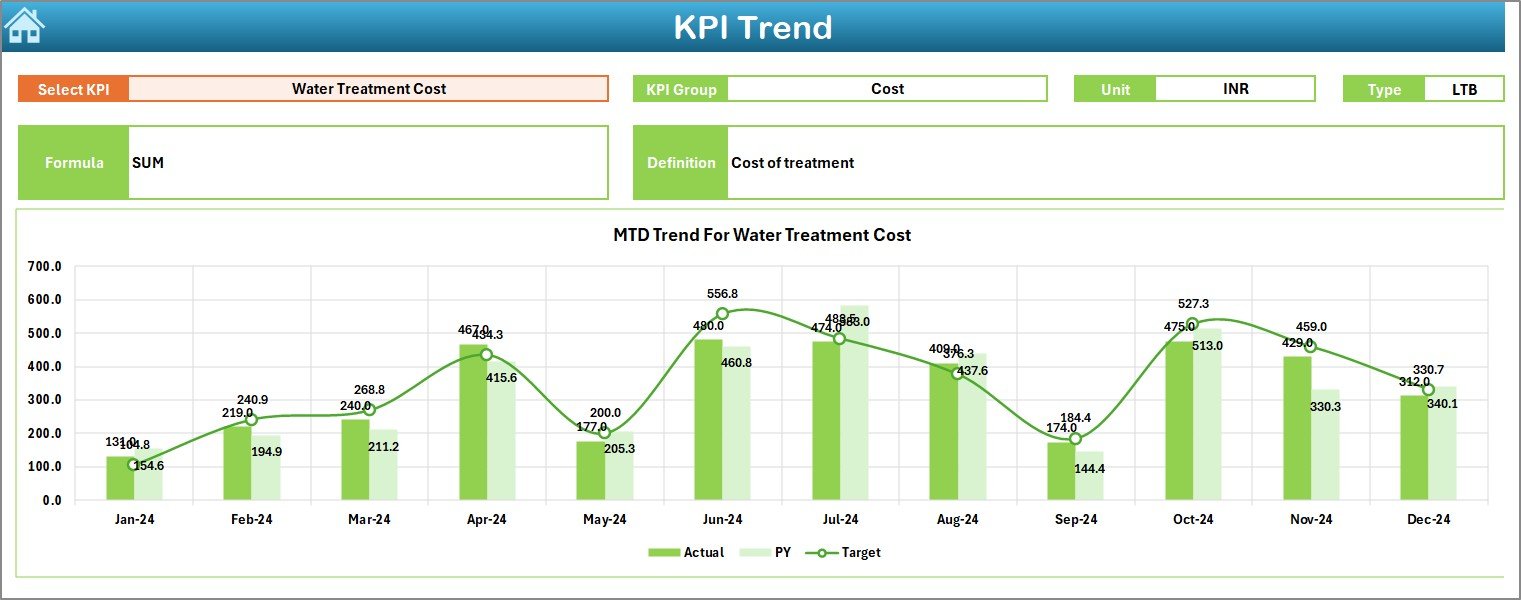
Trend Page – Shows graphical performance trends for every KPI selected
-
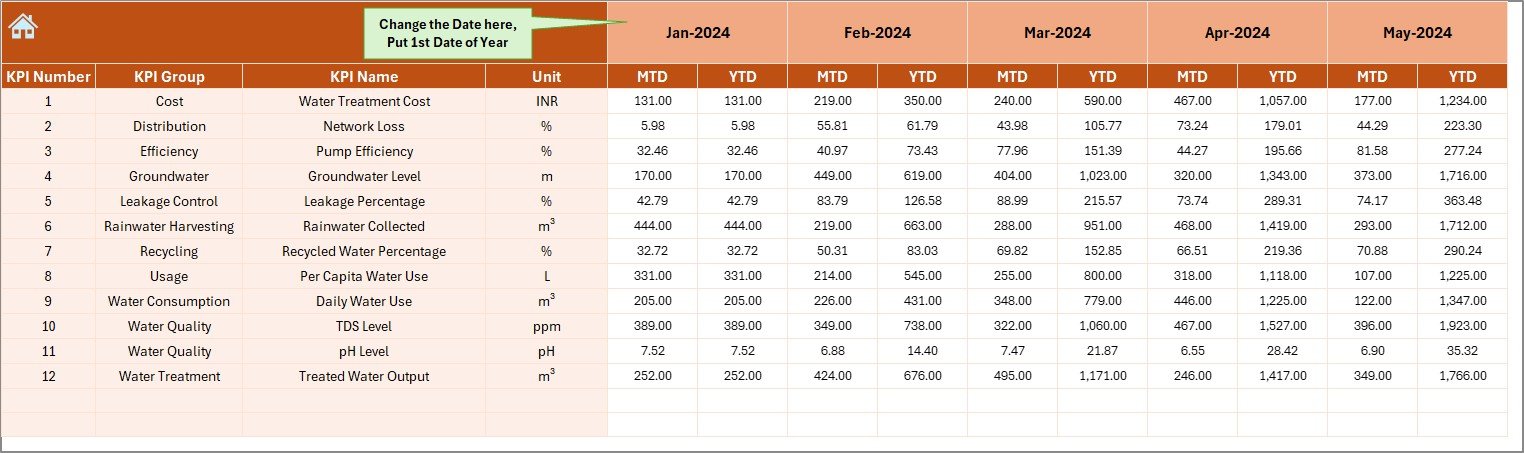
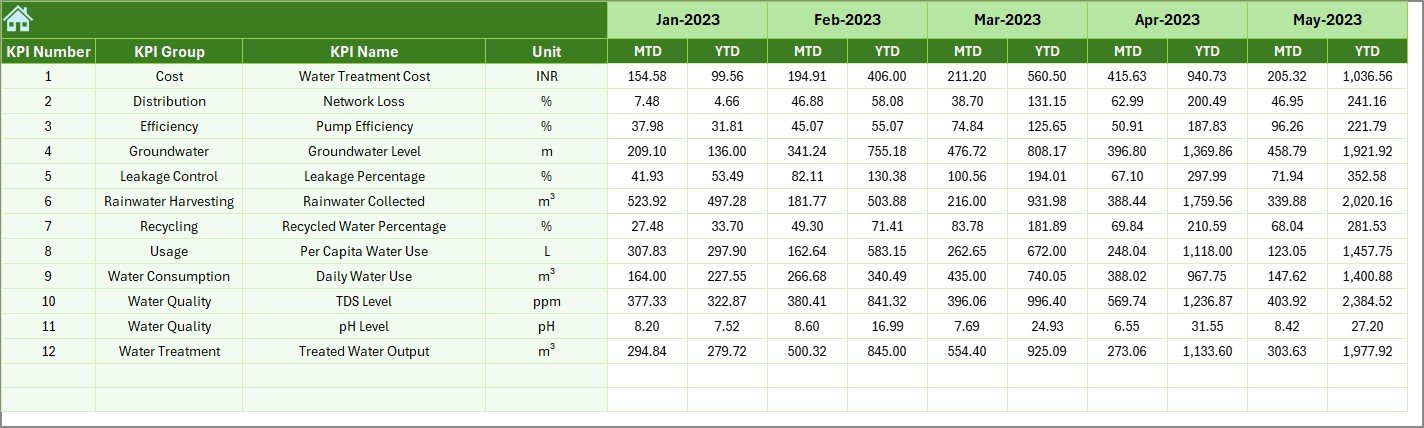
Actual Input Sheet – Enter MTD & YTD actual values easily
-
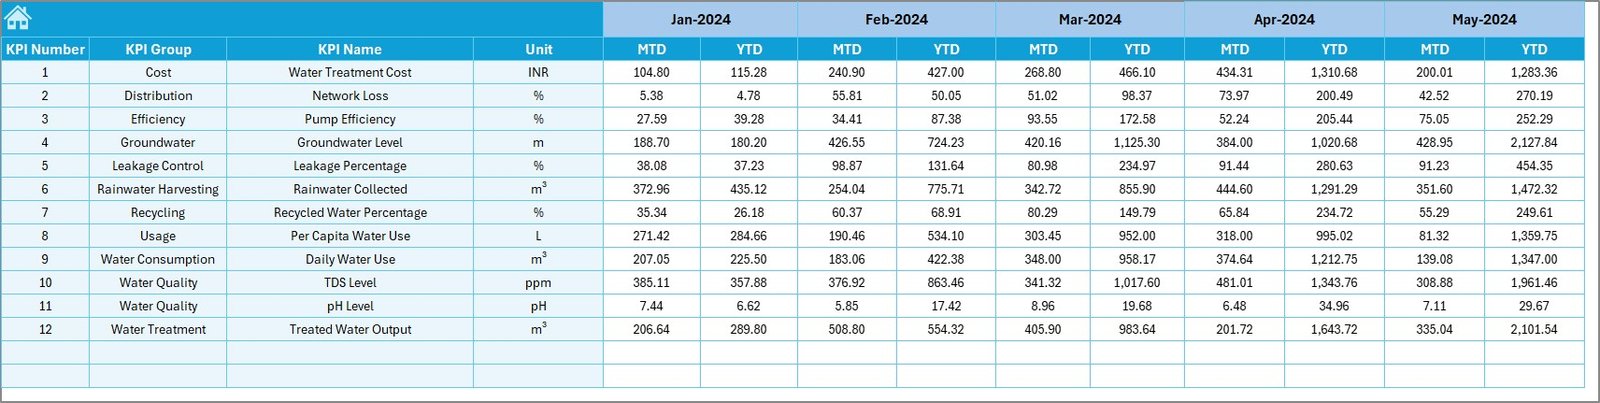
Target Sheet – Set month-wise and year-wise performance targets
-
Previous Year Sheet – Store historical data for accurate comparison
-
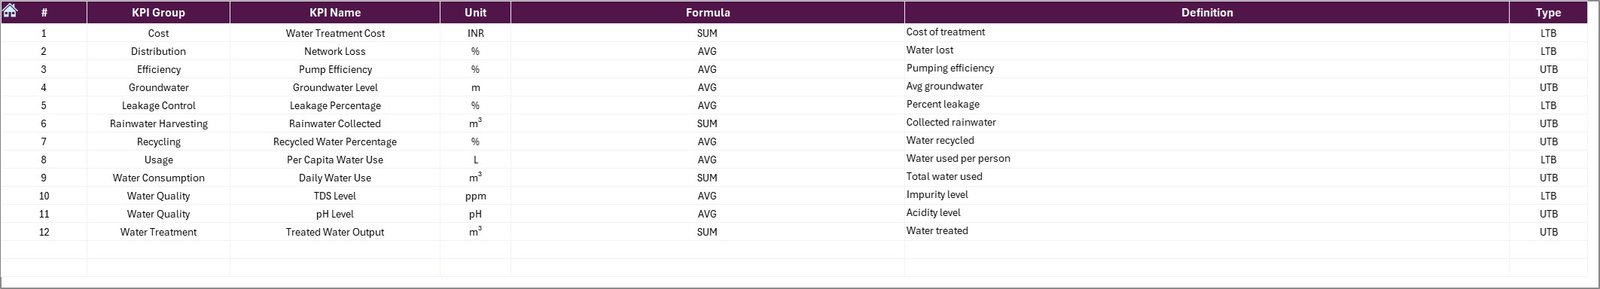
KPI Definition Page – Clear details for each KPI, formula, group, and type
Every part of the dashboard updates automatically, ensuring error-free reporting and instant insights.
What’s Inside the Water Resource Management KPI Dashboard in Excel 📂
When you download this product, you will receive:
✨ A ready-to-use Excel file
✨ Pre-built dashboard with slicers and automated formulas
✨ Trend charts for clearer decision-making
✨ KPI Definition table with UTB/LTB classification
✨ Clean and structured data input sheets
✨ Conditional formatting with intuitive up/down arrows
✨ Professional layout and color theme
✨ Customizable framework to add more KPIs anytime
This structured design ensures smooth reporting for teams of all sizes and industries.
How to Use the Water Resource Management KPI Dashboard in Excel 🧭
Using the dashboard is extremely simple:
-
Open the Actual Input Sheet and fill monthly values
-
Update targets in the Target Sheet only once
-
Enter previous-year numbers for comparison
-
Go to the Dashboard Page and select the month using the drop-down
-
Instantly view MTD/YTD performance, growth, and gaps
-
Switch to the Trend Page to analyze KPI movements
-
Review the KPI Definition Page for clarity on formulas and units
That’s it! You get a complete, automated reporting system without any coding.
Who Can Benefit from This Water Resource Management KPI Dashboard in Excel 👥
This dashboard is perfect for:
💧 Water resource managers tracking usage and efficiency
🏭 Industrial plant operators monitoring consumption & treatment
🌱 Sustainability and ESG teams reporting water savings
🏢 Facility management teams optimizing operational water use
🏙️ Government water departments improving supply planning
🚰 Utilities and service providers managing distribution losses
📝 Auditors and compliance teams reviewing performance data
🎓 Students & researchers studying water management KPIs
Anyone who wants simplified, accurate, and organized water reporting will benefit from this tool.
Click Here to Read the Detailed Blog Post


Reviews
There are no reviews yet.