
Scrum teams work in a fast, dynamic environment where speed, clarity, and continuous improvement are essential. With sprint cycles moving quickly and multiple priorities happening at the same time, leaders need real-time visibility into how their teams are performing. However, many Agile teams still struggle to measure sprint velocity, backlog health, planning accuracy, defect trends, team capacity, and overall delivery quality. The Scrum Team KPI Dashboard in Google Sheets solves these issues by providing a powerful, simple, and cost-effective performance tracking system.
This ready-to-use dashboard converts your monthly or sprint-level data into clear visuals, KPI cards, trend charts, and comparison metrics. Because it is built entirely in Google Sheets, it offers instant updates, easy collaboration, and zero software cost. Whether you are a Scrum Master, Product Owner, Agile Coach, or Project Manager, this dashboard equips you with the insights needed to drive continuous improvement and deliver high-performing sprints consistently.
✨ Key Features of the Scrum Team KPI Dashboard in Google Sheets
📊 1. Month-to-Month KPI Tracking
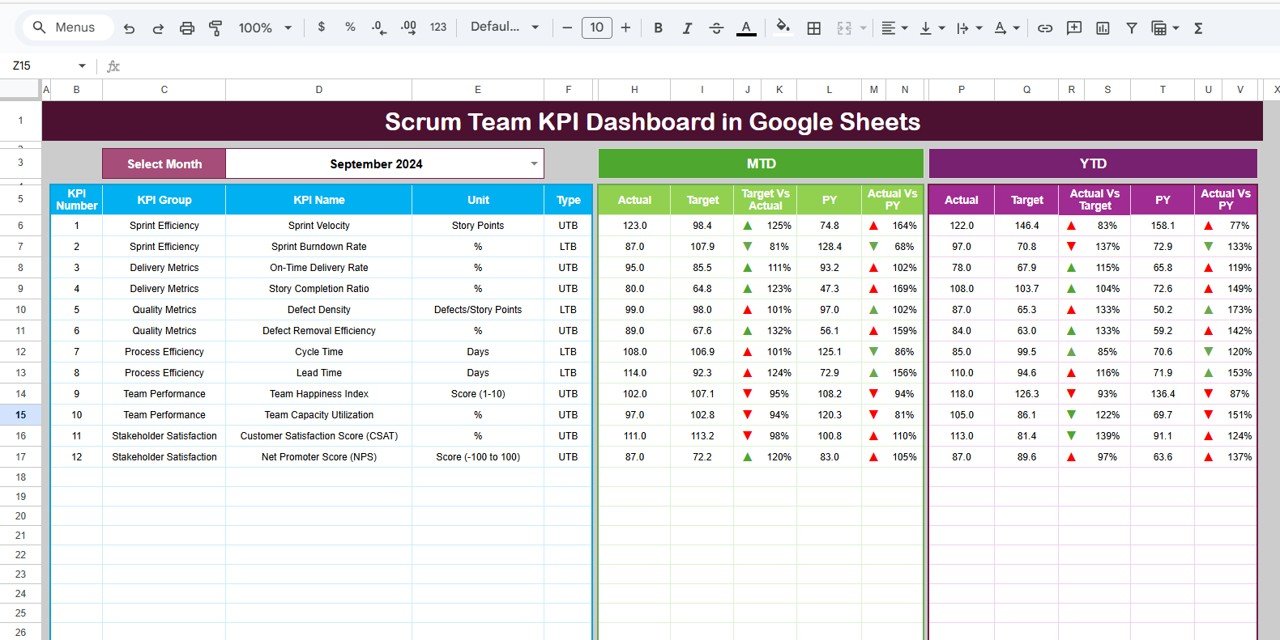
The dashboard automatically updates all values—MTD Actual, MTD Target, MTD Previous Year, YTD Actual, YTD Target, and YTD Previous Year—when you select a month. You instantly see whether your sprint performance is improving or declining.
⬆️⬇️ 2. Conditional Performance Arrows
Green arrows indicate improvement, red arrows signal decline, and yellow arrows show neutral performance. Leaders get instant clarity without reading lengthy reports.
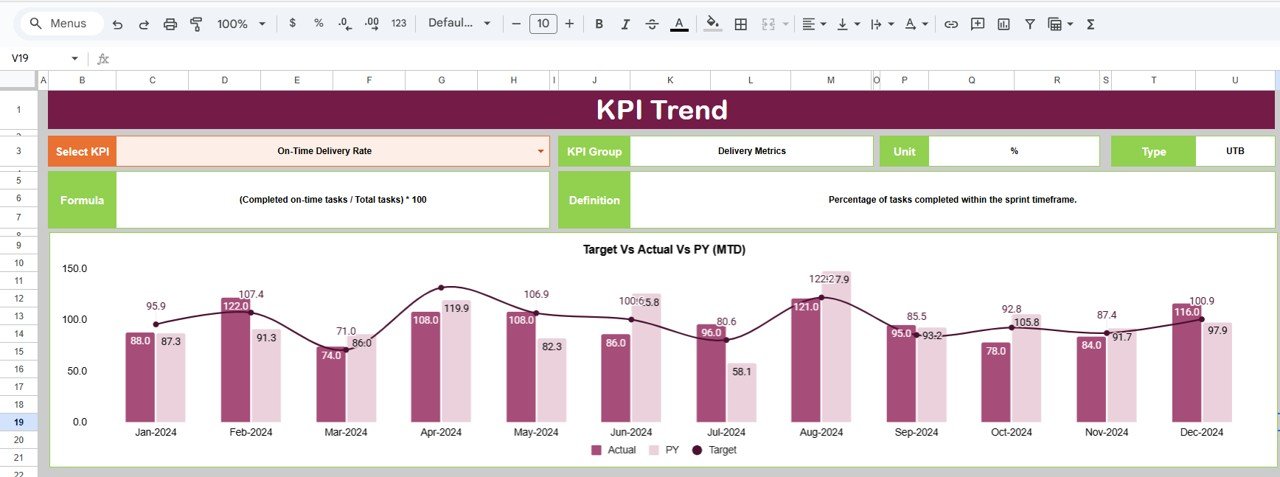
📈 3. Detailed KPI Trend Analysis
Select any KPI from a dropdown, and the system displays KPI formula, definition, group, type (UTB or LTB), and a 12-month trend chart. Perfect for reviewing sprint velocity, defect trends, cycle time, burn rate, backlog quality, and customer satisfaction.
📝 4. Structured Data Entry Sheets
The Actual, Target, and Previous Year sheets make it easy to enter and update KPIs. No formulas or coding required.
📚 5. Clear KPI Definitions for the Entire Team
The KPI Definition sheet ensures every team member understands how metrics are calculated. This improves transparency and aligns teams on performance expectations.
📦 What’s Inside the Scrum Team KPI Dashboard in Google Sheets
🖥️ 1. Dashboard Sheet (Main Page)
This is the heart of the system. It shows sprint KPIs for both MTD and YTD, including:
-
Sprint Velocity
-
Sprint Goal Achievement Rate
-
Planned vs Delivered Story Points
-
Cycle Time
-
Defect Leakage
-
Reopened Issues
-
Backlog Health Score
-
Customer Satisfaction
-
Team Capacity Utilization
All metrics update instantly based on your monthly selection, making reviews fast and accurate.
📊 2. KPI Trend Sheet
Choose any KPI and instantly view:
-
KPI Group
-
KPI Type (LTB/UTB)
-
KPI Unit
-
KPI Formula
-
KPI Definition
-
Full-year line chart
This helps teams identify patterns, improvements, or bottlenecks in every sprint.
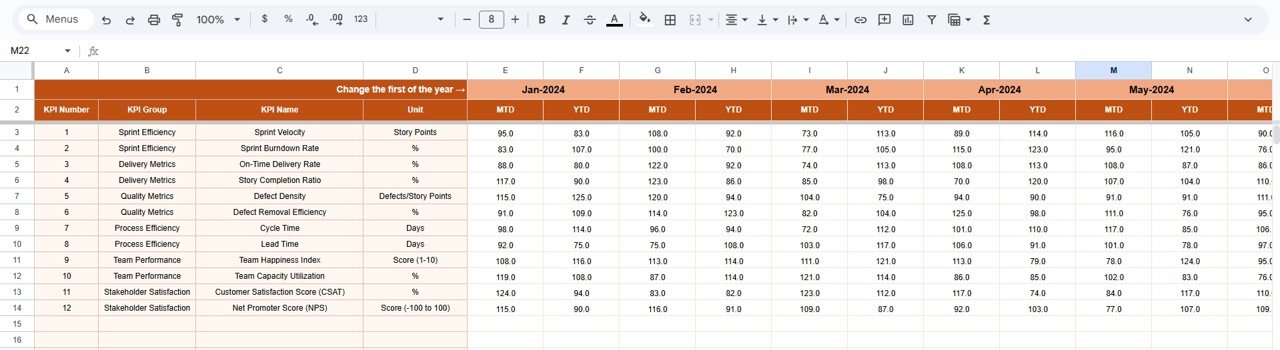
🧮 3. Actual Number Sheet
Enter monthly or sprint actuals here. The sheet adjusts automatically when you select the starting month of the year.
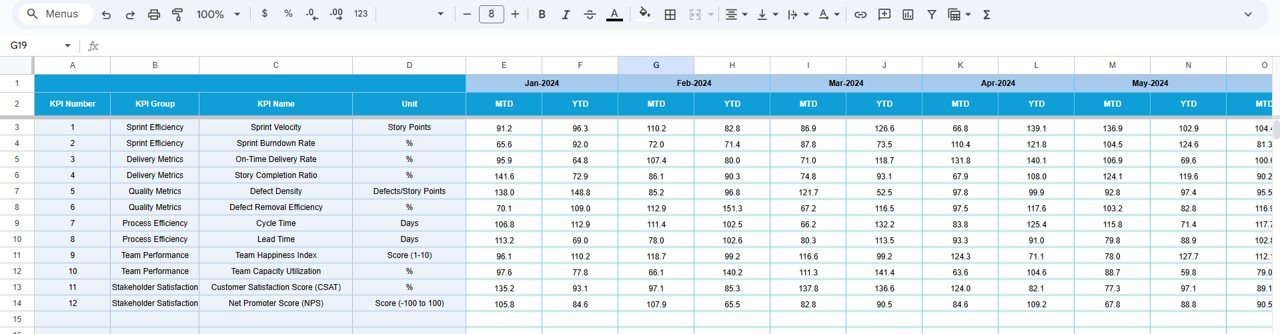
🎯 4. Target Number Sheet
Set monthly or sprint targets for velocity, defects, backlog items, customer satisfaction, and more. These targets help teams plan sprints intelligently.
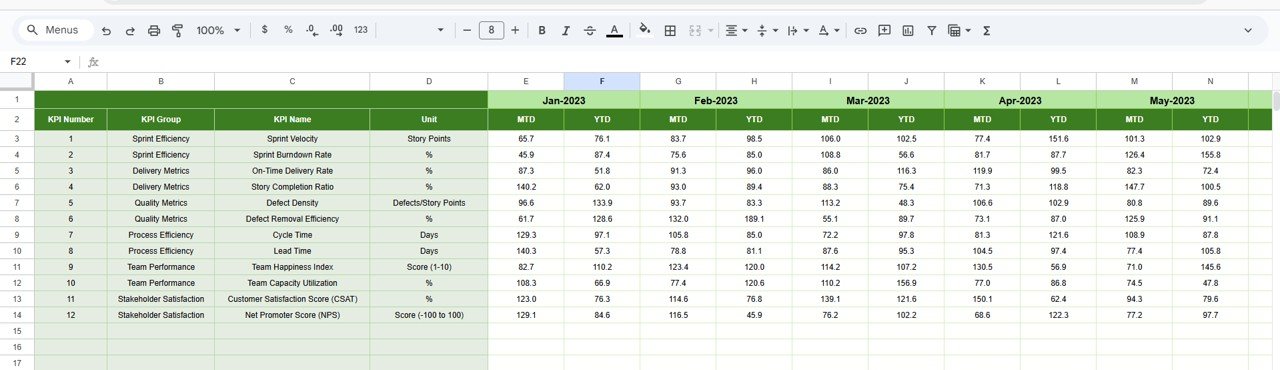
📅 5. Previous Year Data Sheet
Review year-over-year progress for deeper performance insight.
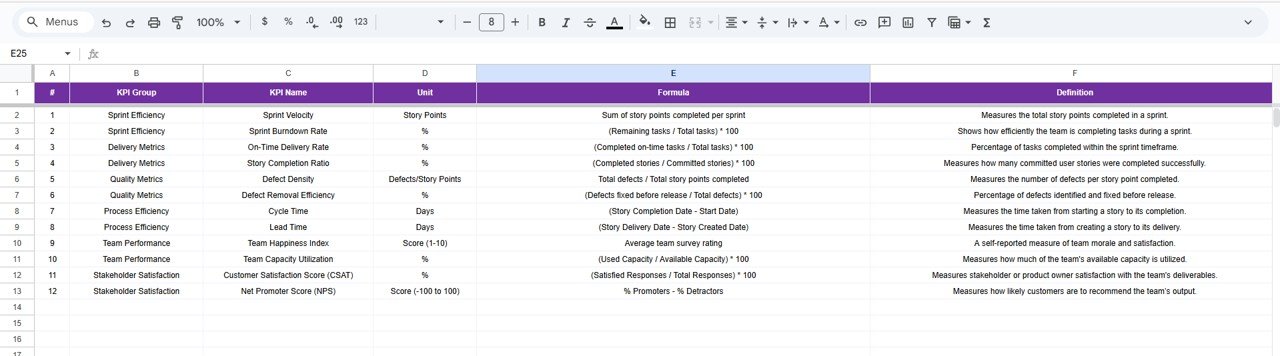
📘 6. KPI Definition Sheet
A reference table containing:
-
KPI Names
-
Units
-
Definitions
-
Formulas
-
KPI Group
-
KPI Type
Consistent KPI definitions ensure reliable reporting.
🎯 Who Can Benefit from This Scrum Team KPI Dashboard in Google Sheets
🧭 Scrum Masters
Track sprint performance and remove bottlenecks.
📘 Product Owners
Monitor backlog health, sprint outcomes, and delivery predictability.
📊 Agile Coaches
Identify improvement areas across multiple teams.
🏢 Managers & Executives
Gain high-level visibility into Agile performance.
🚀 Development Teams
Improve planning accuracy and overall sprint quality.
Click here to read the Detailed blog post
Watch the step-by-step video tutorial:


Reviews
There are no reviews yet.