Managing water utilities requires quick insights, accurate monitoring, and complete control over operations. From water production and distribution to quality, billing, energy usage, and service levels—teams handle thousands of data points every month. Water Utilities KPI Dashboard in Power BI When these numbers sit inside scattered spreadsheets, reporting becomes slow, mistakes happen, and early warning signals get missed.
💡 This is where the Water Utilities KPI Dashboard in Power BI becomes a powerful game-changer.
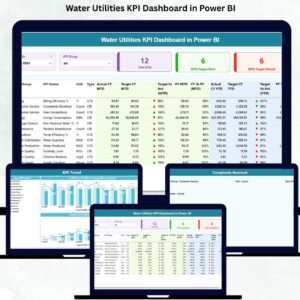
It centralizes all your KPIs, shows instant performance insights, highlights target achievements, and helps you compare month-wise and year-wise performance effortlessly. With clean visuals, smart slicers, automated calculations, and Excel-based inputs, it becomes the most intelligent monitoring tool for any water utility team.
Water Utilities KPI Dashboard in Power BI Whether you manage production plants, distribution networks, or utility operations, this dashboard ensures you never make decisions in the dark again. Water Utilities KPI Dashboard in Power BI It transforms raw data into a visually rich, user-friendly, and fully automated performance reporting system.
Below is everything included in this digital product 👇
✨ Key Features of the Water Utilities KPI Dashboard in Power BI
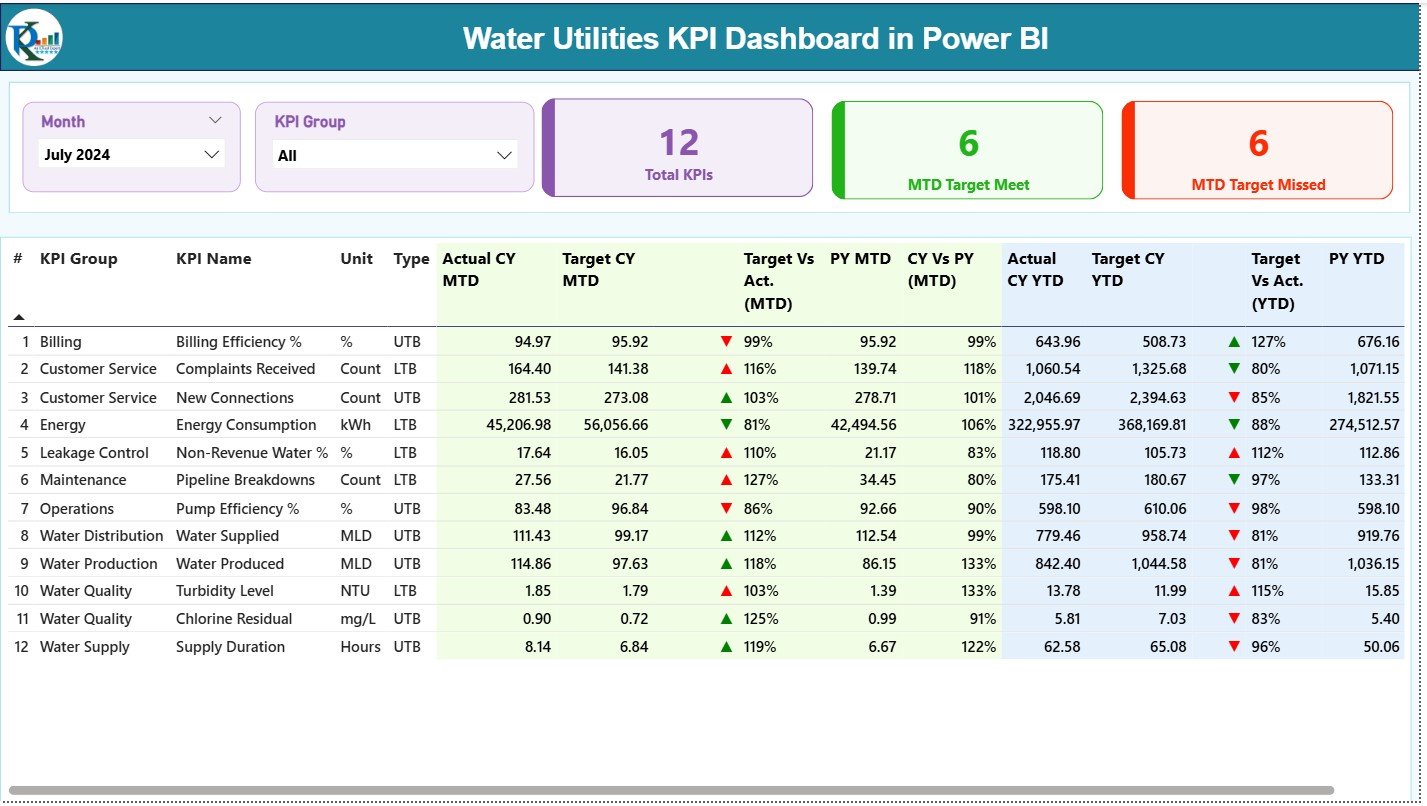
🔹 Centralized KPI Monitoring
Track production, distribution losses, quality, energy usage, billing, complaints, and operational KPIs—all in one dashboard.
🔹 Smart & Interactive Filters
Use the Month Slicer and KPI Group Slicer to instantly filter data and focus on what’s important.
🔹 Automated MTD & YTD Insights
See MTD Actuals vs Targets, YTD Actuals vs Targets, and compare performance with the previous year.
🔹 Performance Icons (Green/Red Arrows)
Easily identify whether KPIs are meeting or missing their targets.
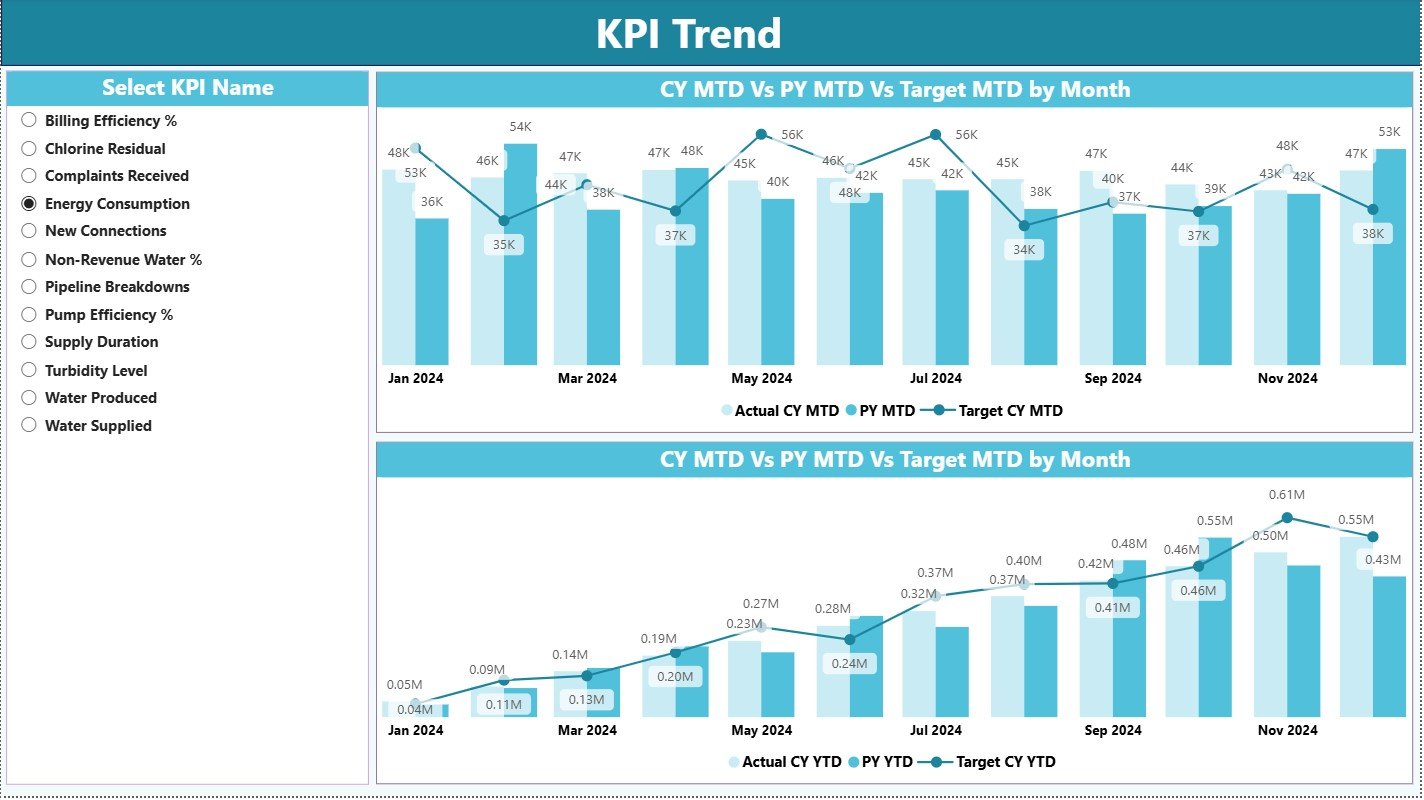
🔹 Trend Analytics
Combo charts for MTD and YTD help you track long-term progress and compare CY vs PY.
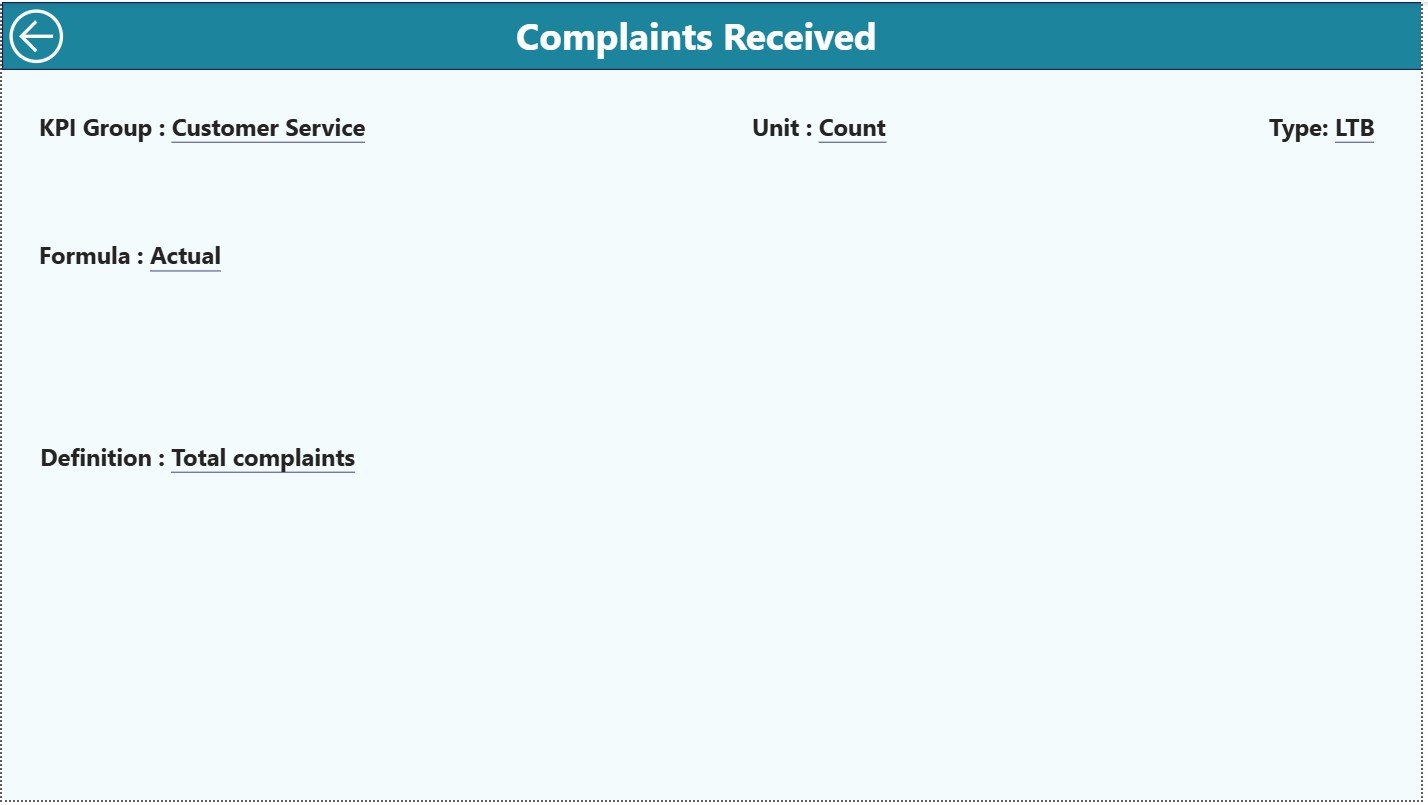
🔹 Drill-Through KPI Details
Open KPI Definition Page to see the KPI formula, meaning, type (UTB/LTB), and unit.
🔹 No Manual Formatting Needed
Just update the Excel file → Refresh Power BI → Get instant updated visuals.
🔹 Fully Editable Power BI File
Customize colors, themes, visuals, and slicers as per your reporting needs.
📦 What’s Inside the Water Utilities KPI Dashboard in Power BI
Your digital download includes everything needed for smooth reporting:
✔ Power BI Desktop (.pixy) File
Fully designed & pre-connected with the dataset structure.
✔ Excel Input File (3 Structured Sheets)
-
Input Actual
-
Input Target
-
KPI Definition
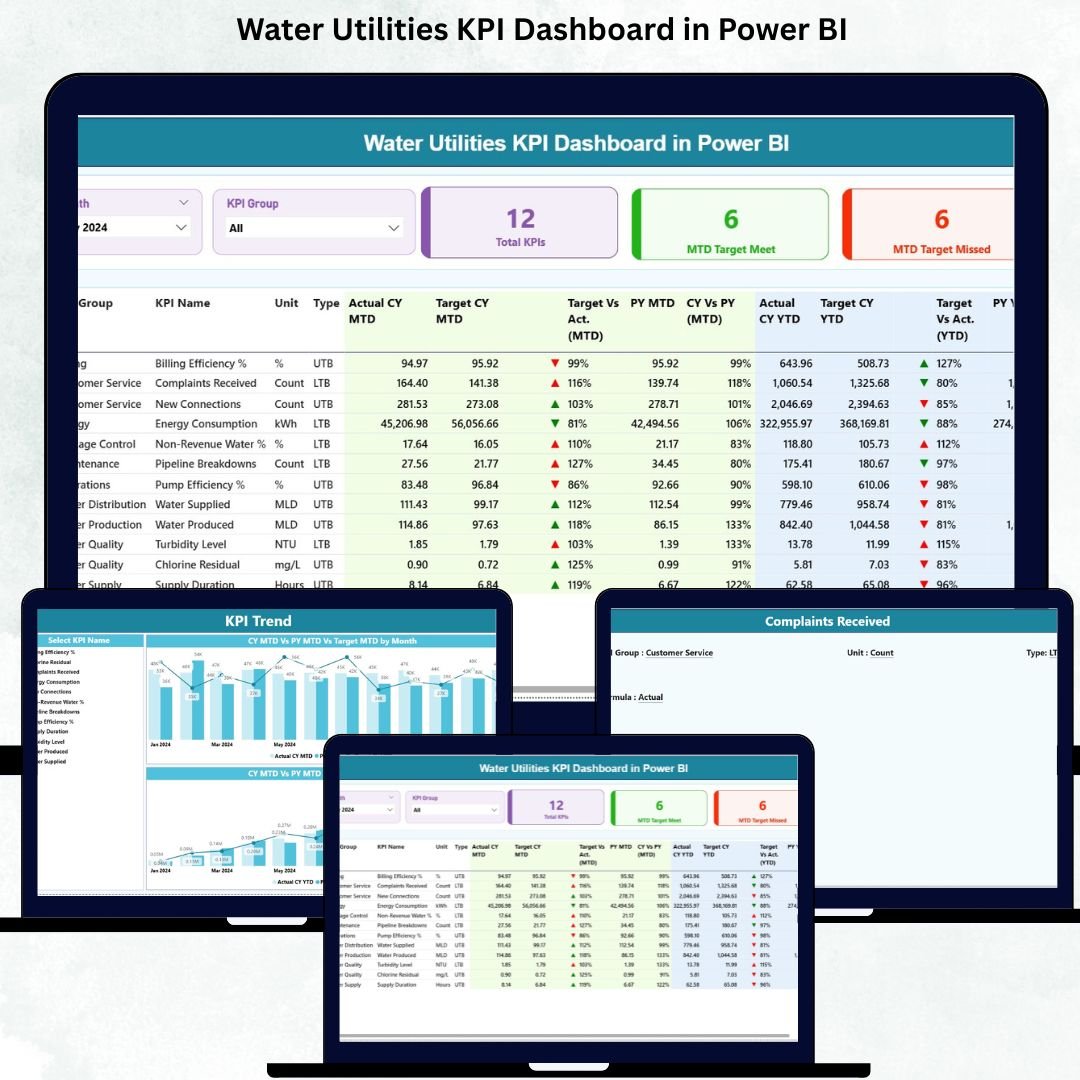
✔ Three Interactive Pages
1️⃣ Summary Page – Main KPI view, slicers, performance icons, MTD/YTD table
2️⃣ KPI Trend Page – Combo charts for monthly & yearly trends
3️⃣ KPI Definition Page – Drill-through detail sheet
✔ Navigation Buttons & Clean Layout
Move smoothly between pages with a user-friendly interface.
✔ Ready-to-Use KPI Logic
Automated formulas for MTD%, YTD%, CY vs PY, Actual vs Target.
🛠 How to Use the Water Utilities KPI Dashboard in Power BI
Using this dashboard is extremely simple 👇
➤ Step 1: Open the Excel File
Fill in KPI Actuals, Targets, and Definitions in the structured sheets.
➤ Step 2: Open the Power BI File
The dashboard automatically reads the Excel data.
➤ Step 3: Click “Refresh”
Power BI loads all updated values automatically.
➤ Step 4: Use Filters to Analyze
Apply Month or KPI Group slicers to focus on specific metrics.
➤ Step 5: Drill Through for Details
Right-click any KPI → Go to KPI Definition Page → View entire KPI logic.
➤ Step 6: Explore Trend Analysis
Check how KPIs performed across multiple months and years.
That’s it! No coding. No complex setup. No manual reporting.
Just update → refresh → analyze.
👥 Who Can Benefit from This Water Utilities KPI Dashboard
This dashboard is perfect for a wide range of water utility functions:
💧 Water Distribution Departments
Monitor losses, leakages, pressure issues, and supply efficiency.
🏭 Water Treatment Plants
Track production, quality parameters, and operational KPIs.
📊 Utility Performance Monitoring Units
Get a clear view of targets, achievements, and monthly variations.
🏢 Public Water Boards
Ensure transparency and smart reporting across departments.
🏗 Private Water Utility Companies
Improve decision-making and track KPIs in real time.
⚙ Operational Excellence Teams
Identify issues early using icons, charts, and trend analysis.
📈 Management & Leadership Teams
Use strategic insights for planning, budgeting, and performance evaluation.
If your team struggles with Excel reports, delayed insights, or scattered data, this dashboard will completely transform your reporting workflow.


Reviews
There are no reviews yet.