Plastics manufacturing runs on speed, accuracy, and continuous production. Every minute, machines produce thousands of units, consume energy, generate scrap, and require precise monitoring. Supervisors must track machine hours, output efficiency, resin performance, rework trends, customer segment demand, and monthly production variations. Doing all this manually slows the plant down and increases errors. That’s why the Plastics Manufacturing Dashboard in Excel becomes an essential tool for any plastics production environment.
This professionally designed Excel dashboard transforms raw production data into clean, visual, and fully interactive insights. It helps plant managers, shift leaders, quality engineers, and operations teams monitor real-time performance without searching through multiple spreadsheets. With just a click, you can filter data by month, shift, plant, product family, customer segment, and resin supplier. All charts, KPIs, and analysis pages update instantly—giving you the power to take quick, confident decisions.
Built entirely in Excel, this dashboard does not require Power BI, macros, or complex formulas. It is simple, lightweight, and highly efficient. You enter your data in the Data Sheet, and the dashboard uses pivot tables, slicers, and charts to create a complete production performance view.
🚀 Key Features of the Plastics Manufacturing Dashboard in Excel
This dashboard includes five analytical pages designed for plastics plants of all sizes. Every page focuses on the most important KPIs and trends so you can identify issues and opportunities quickly.
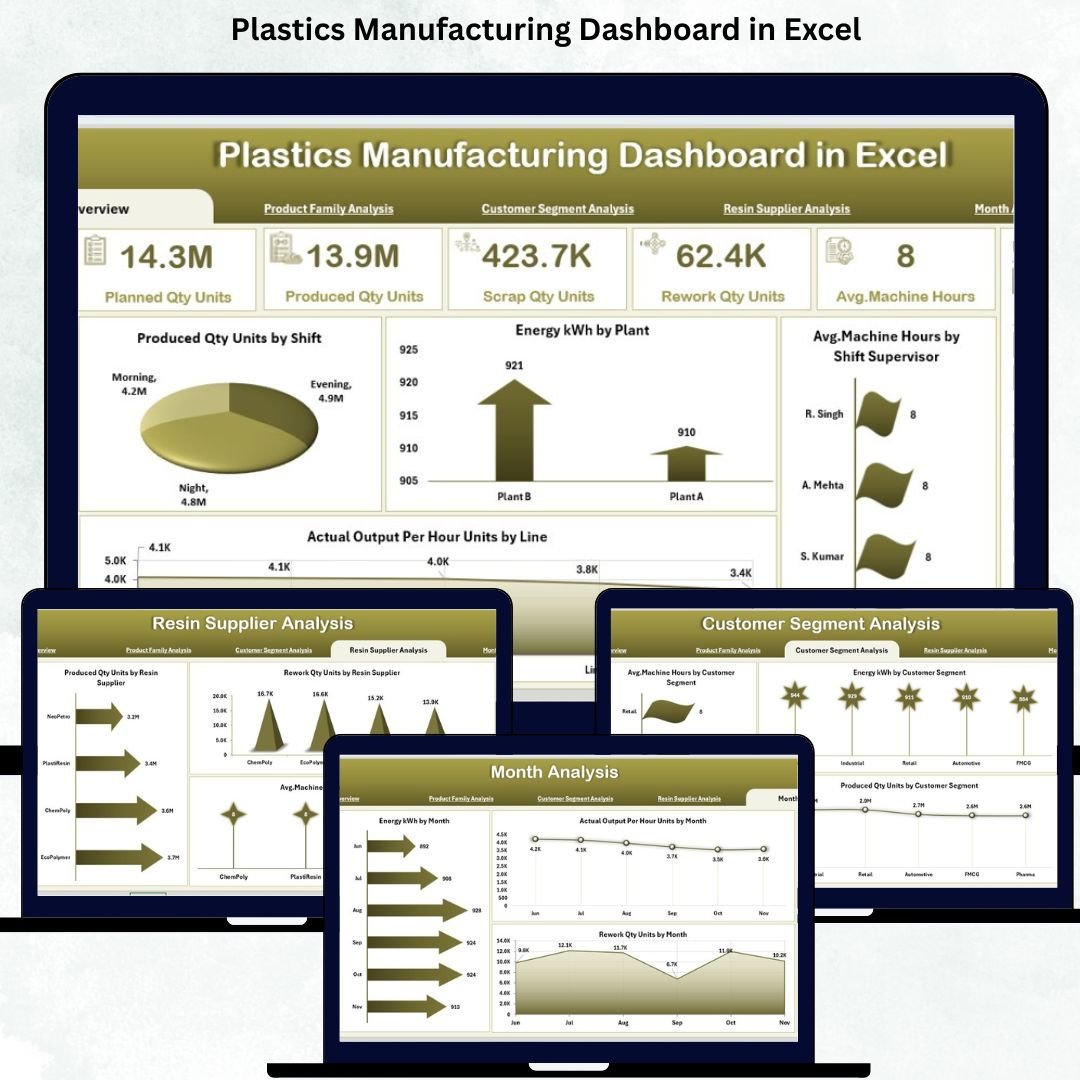
⭐ 1. Overview Page – Complete Plant Performance on One Screen
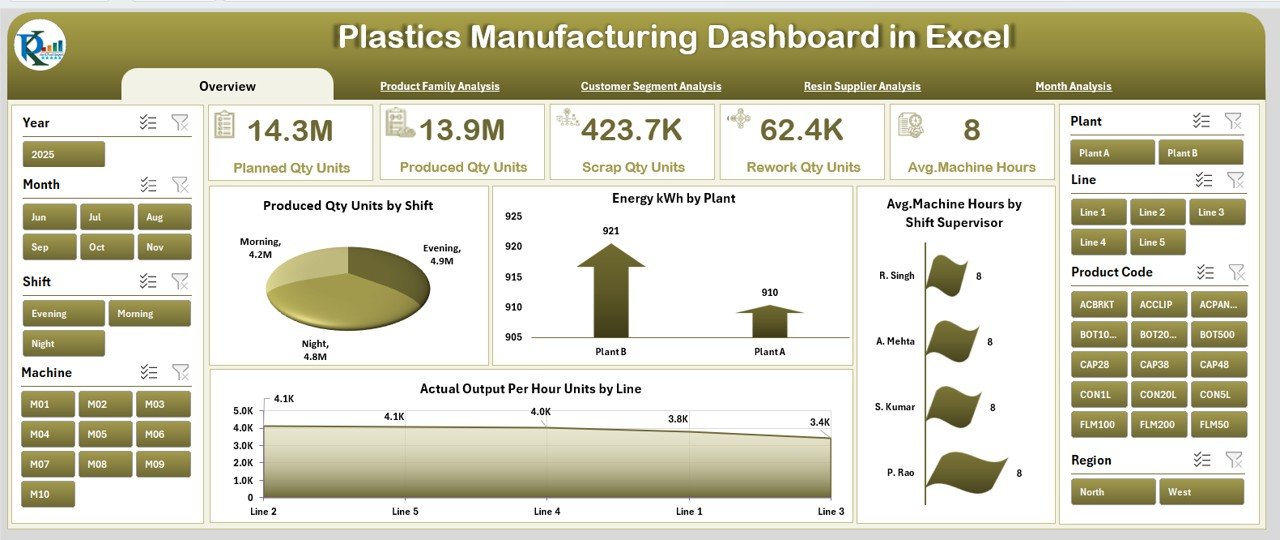
The Overview Page is your daily command center. It shows everything a plant manager needs in one glance.
🔹 KPI Cards Include:
-
Total Produced Quantity
-
Total Energy Consumption
-
Average Machine Hours
-
Actual Output Per Hour
-
Scrap / Rework Summary
These cards give you a direct comparison between daily and monthly targets.
🔹 Key Charts on the Overview Page:
-
Produced Quantity (Units) by Shift – Compare efficiency between shifts.
-
Energy Consumption (kWh) by Plant – Identify high-energy plants and optimize usage.
-
Average Machine Hours by Shift Supervisor – Monitor supervisor-wise utilization.
-
Actual Output Per Hour (Units) by Line – Detect bottlenecks in specific production lines.
This page provides instant clarity and highlights areas that require action.
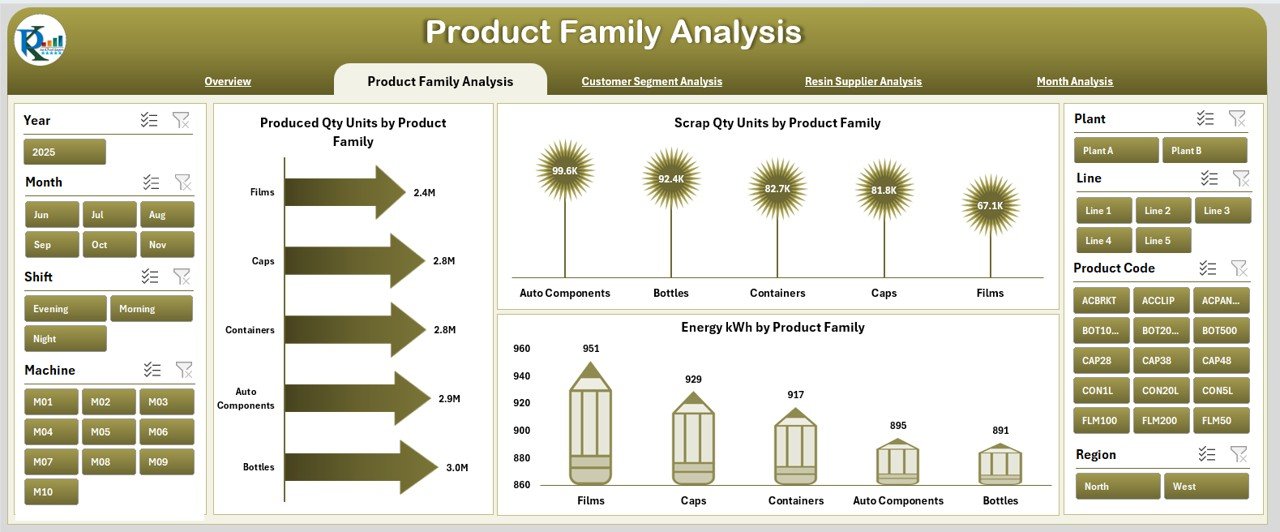
⭐ 2. Product Family Analysis – Know Your Top Performers
Plastics companies produce various product families such as bottles, sheets, caps, films, and containers. Each family behaves differently in terms of production volume, scrap level, and energy usage.
🔹 Charts on This Page:
-
Produced Quantity (Units) by Product Family
-
Energy Consumption (kWh) by Product Family
-
Scrap Quantity (Units) by Product Family
This page helps you understand which families drive output, which consume more power, and which generate more scrap.
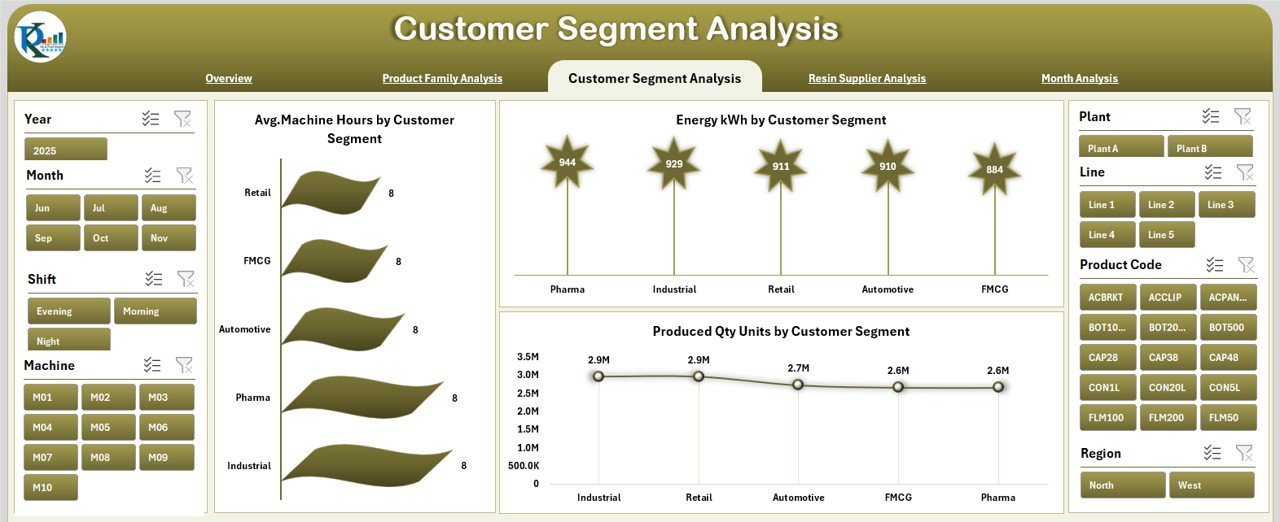
⭐ 3. Customer Segment Analysis – Demand-Based Production Insights
Different customer segments demand different product types and specifications. This page helps you track which segments drive major production activities.
🔹 Key Charts:
-
Produced Quantity (Units) by Customer Segment
-
Energy Consumption (kWh) by Customer Segment
-
Average Machine Hours by Customer Segment
These insights help both production and sales teams plan capacity and address customer-specific needs.
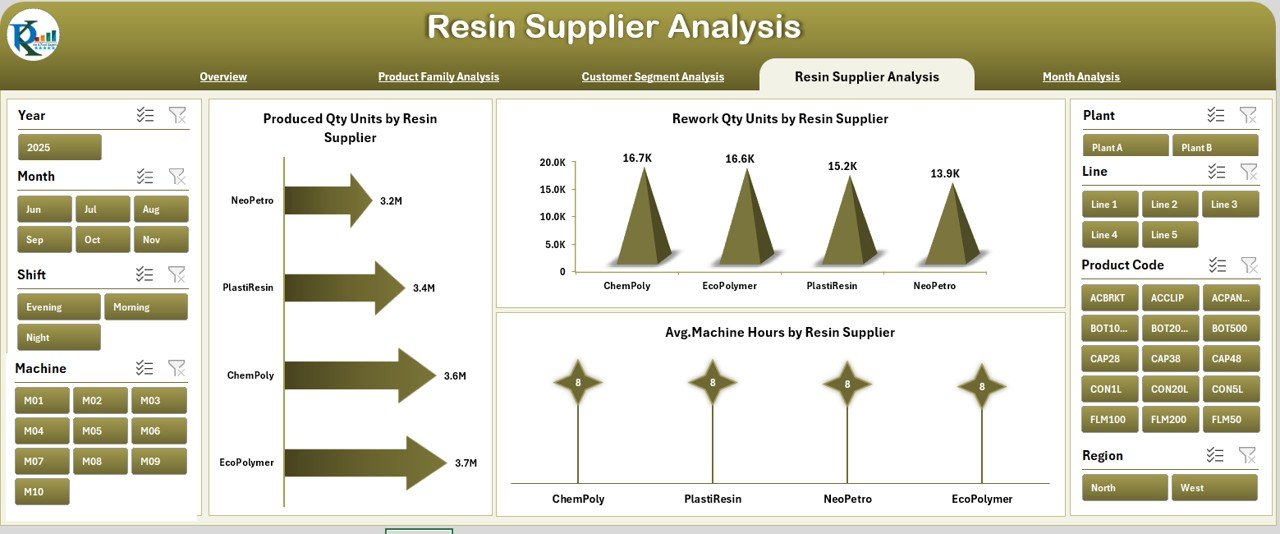
⭐ 4. Resin Supplier Analysis – Optimize Resin Quality & Cost
Resin quality directly affects production speed, machine hours, scrap, and product quality. This page compares resin suppliers based on actual performance.
🔹 Charts Included:
-
Produced Quantity (Units) by Resin Supplier
-
Rework Quantity (Units) by Resin Supplier
-
Average Machine Hours by Resin Supplier
This helps you select the best-performing suppliers, negotiate better contracts, and reduce quality issues.
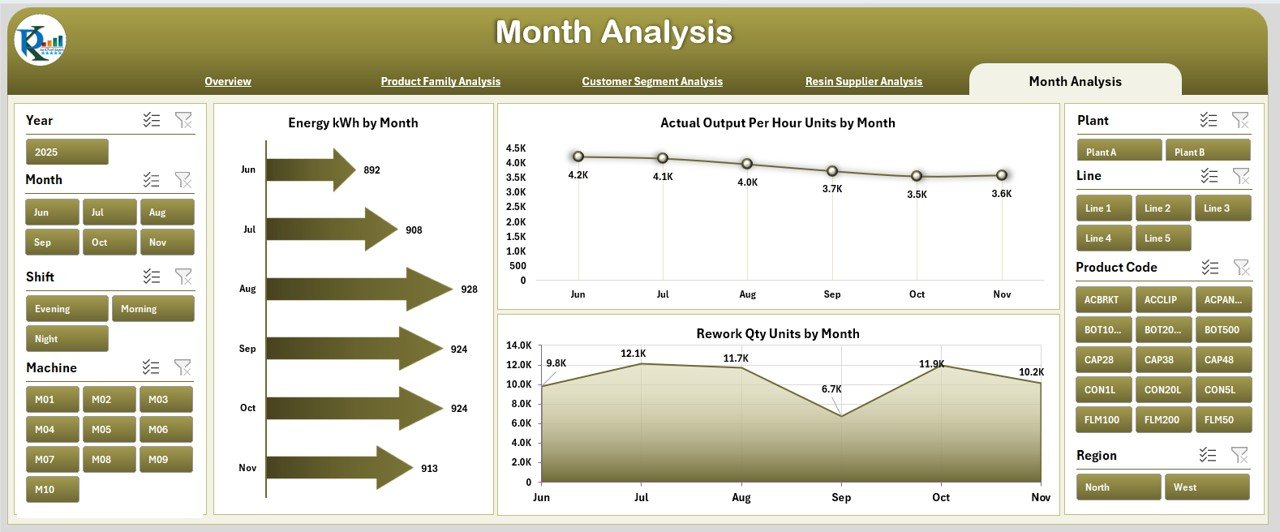
⭐ 5. Month Analysis – Identify Trends and Seasonal Variations
Monthly performance tracking is essential for understanding long-term patterns and planning production schedules.
🔹 Charts on This Page:
-
Energy Consumption (kWh) by Month
-
Actual Output Per Hour (Units) by Month
-
Rework Quantity (Units) by Month
These insights help you detect seasonal demand, monthly performance gaps, and areas needing continuous improvement.
🧩 What’s Inside the Dashboard?
Your download includes:
-
5 beautifully structured analysis pages
-
A dedicated Data Sheet for simple updates
-
Page Navigator for smooth movement
-
Support Sheet for lookup values
-
Dynamic slicers (Month, Shift, Plant, Product Family, Customer Segment, Resin Supplier)
-
Fully automated KPI updates
-
Clean and lightweight design
Everything is built to help teams make faster, smarter decisions.
📌 Why Your Plant Needs This Dashboard
-
Real-time production insights
-
Faster decision-making
-
Clear comparison between shifts, plants, and lines
-
Scrap and rework visibility
-
Resin supplier performance analysis
-
Better energy optimization
-
Improved customer segment planning
-
No expensive software required
This dashboard brings operational clarity to the entire plant.
📚 Best Practices
-
Update the Data Sheet daily or weekly
-
Maintain clean and accurate data
-
Review product family and monthly trends regularly
-
Compare supplier performance often
-
Use energy and scrap charts to reduce waste
-
Train supervisors to interpret insights
-
Build action plans based on dashboard findings
With consistent usage, the dashboard becomes your central system for monitoring plant efficiency.
🎯 Conclusion
The Plastics Manufacturing Dashboard in Excel provides a powerful, easy-to-use, and cost-effective way to monitor production, energy, quality, and efficiency. With its interactive pages, slicers, and visual KPIs, it transforms complex plant data into meaningful insights. Whether you’re managing a single plant or multiple locations, this dashboard helps improve productivity, reduce waste, optimize resources, and boost manufacturing performance.
Visit our YouTube channel for tutorials
👉 youtube.com/@PKAnExcelExpert


Reviews
There are no reviews yet.