Managing change inside an organization is never simple. New systems, updated processes, revised policies, technology upgrades, and team restructuring happen all year round. But when leaders track these changes through scattered spreadsheets, endless emails, or manual logs, visibility disappears. This leads to confusion, delays, risk issues, high cost variations, and low user satisfaction.
That’s exactly why the Change Management Dashboard in Excel is a must-have tool for every company. Designed with a clean layout and powerful analytics, this dashboard consolidates all change-related information in one place. It helps leaders monitor change requests, track progress, measure risk levels, verify cost accuracy, and understand user satisfaction with complete clarity. Whether your organization handles a few changes or hundreds every month, this dashboard brings structure, accuracy, and speed to the entire change management process.
This ready-to-use Excel dashboard transforms raw data into meaningful insights using KPIs, charts, slicers, interactive pages, and visual trend analysis. With its built-in logic and automated calculations, teams no longer need complex tools or technical skills. Everything loads instantly inside Excel, making it perfect for organizations of any size.
📊 Key Features of the Change Management Dashboard in Excel
Our dashboard comes with a powerful navigation system that includes five analytical pages, along with a Data Sheet and Support Sheet to power all visuals.
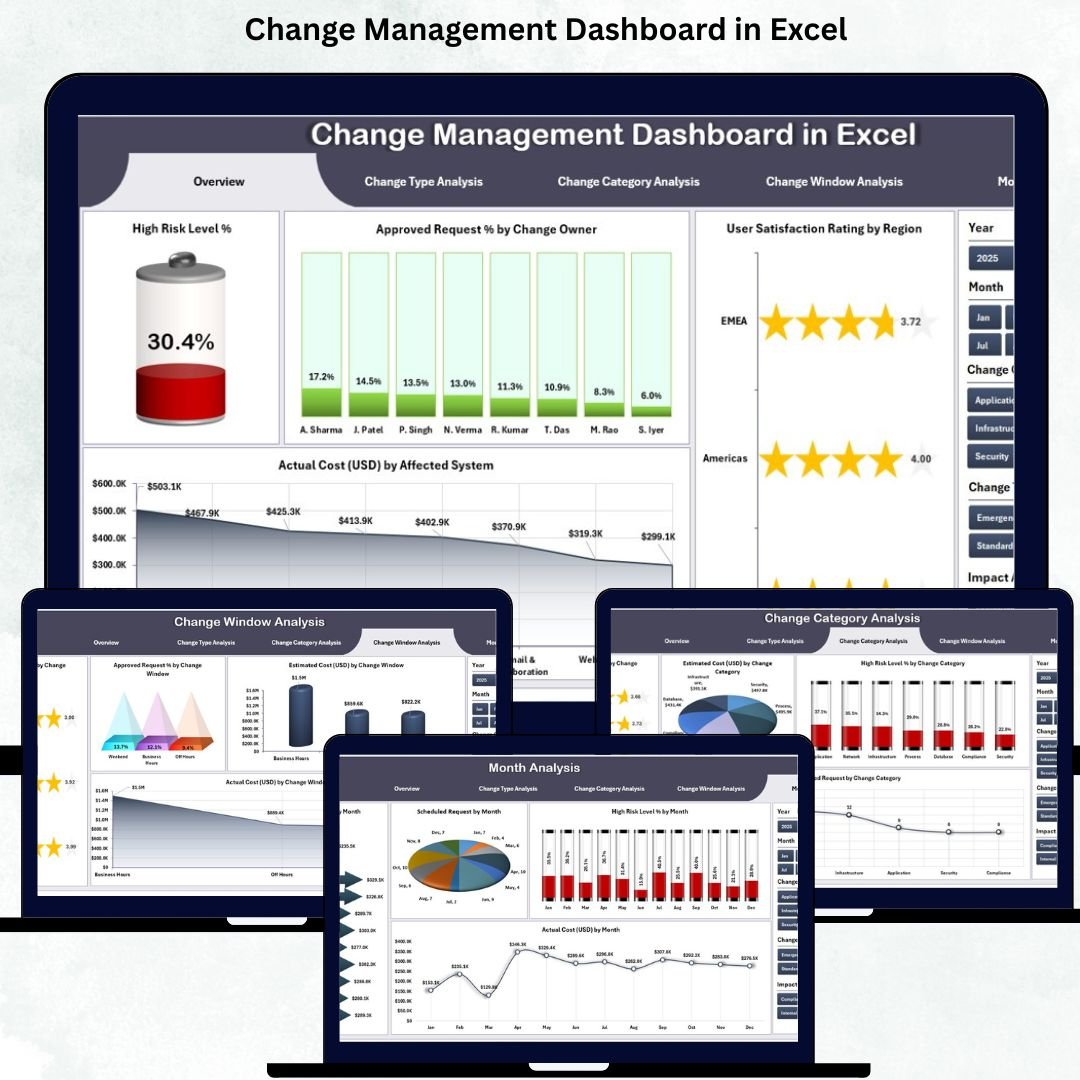
⭐ 1. Overview Page – Complete Snapshot of Change Health
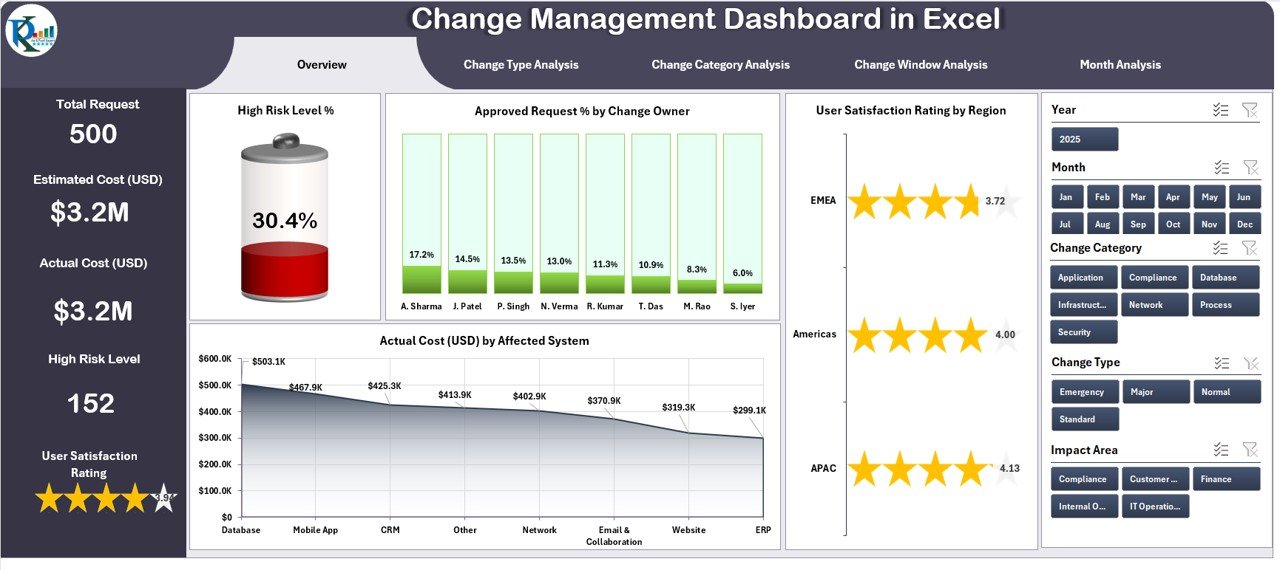
This page is the heart of the dashboard.
It includes:
-
✔ Right-side slicers to filter region, owner, month, system, and more
-
✔ Five KPI cards showing critical metrics
-
✔ Four insightful charts displaying:
-
High Risk Level %
-
Approved Request % by Change Owner
-
User Satisfaction Rating by Region
-
Actual Cost (USD) by Affected System
-
This page helps leaders understand performance, risk exposure, satisfaction levels, and cost impact instantly.
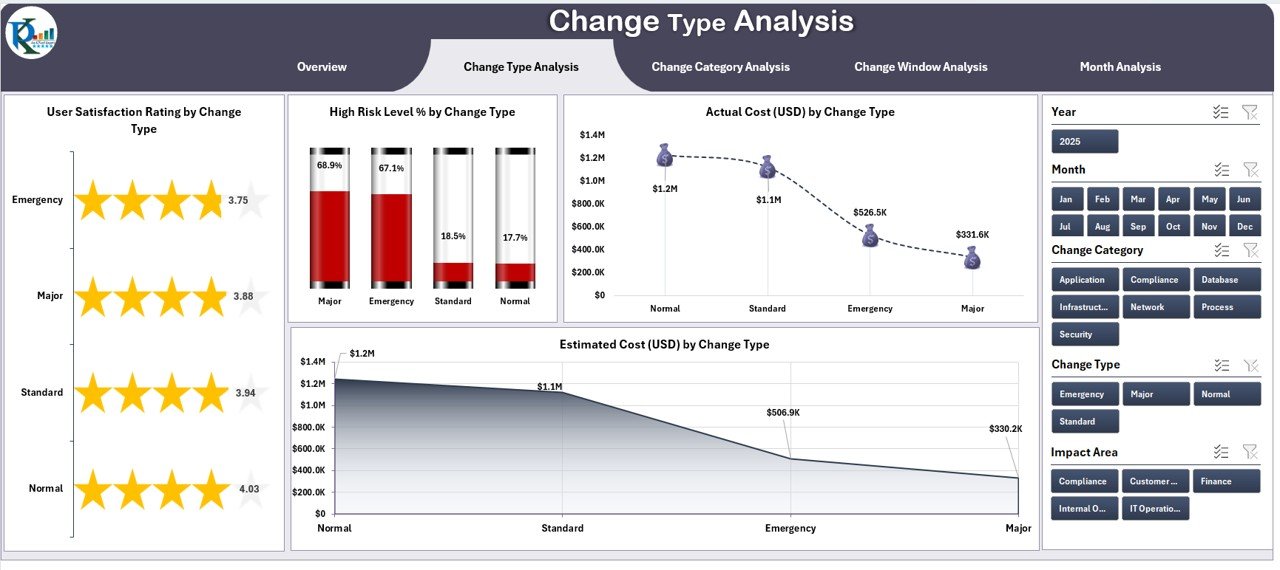
⭐ 2. Change Type Analysis Page – Deep Dive by Change Type
Different change types behave differently.
This page includes:
-
✔ Slicers for quick filtering
-
✔ Four clean charts showing:
-
User Satisfaction by Change Type
-
High Risk Level %
-
Estimated Cost
-
Actual Cost
-
This helps identify which change types are efficient and which ones create risk or cost challenges.
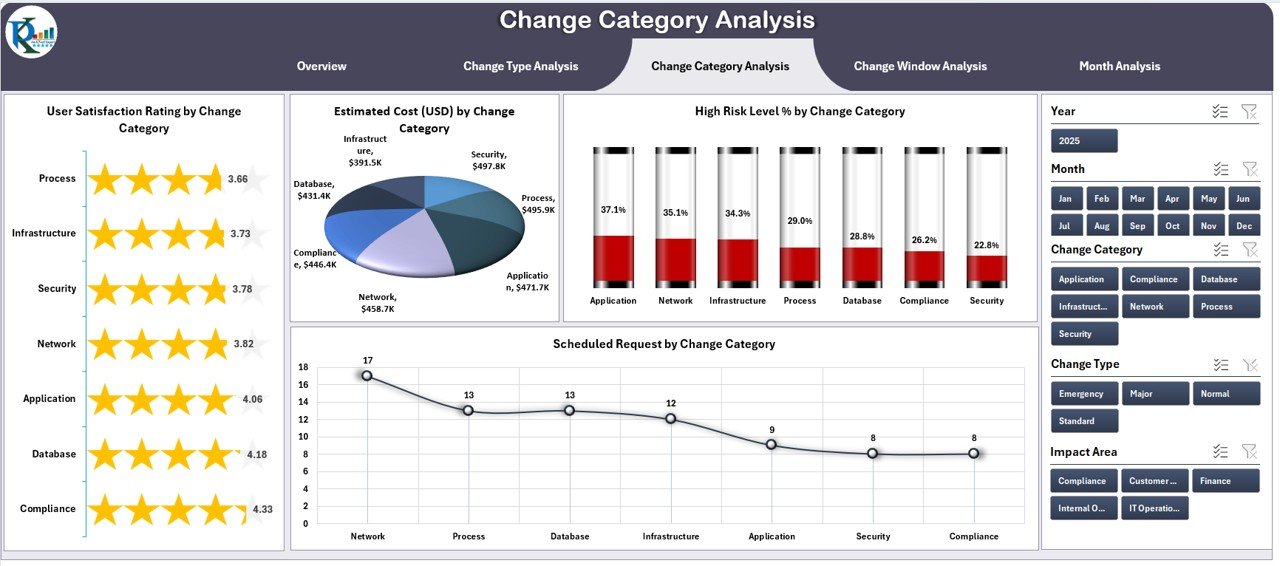
⭐ 3. Change Category Analysis Page – Track Categories Effectively
Changes can be technical, financial, operational, strategic, or compliance-based.
This page visualizes:
-
✔ Satisfaction Rating by Category
-
✔ Risk Levels
-
✔ Estimated vs Actual Cost
Teams can instantly see which categories need improvement and where cost variance is highest.
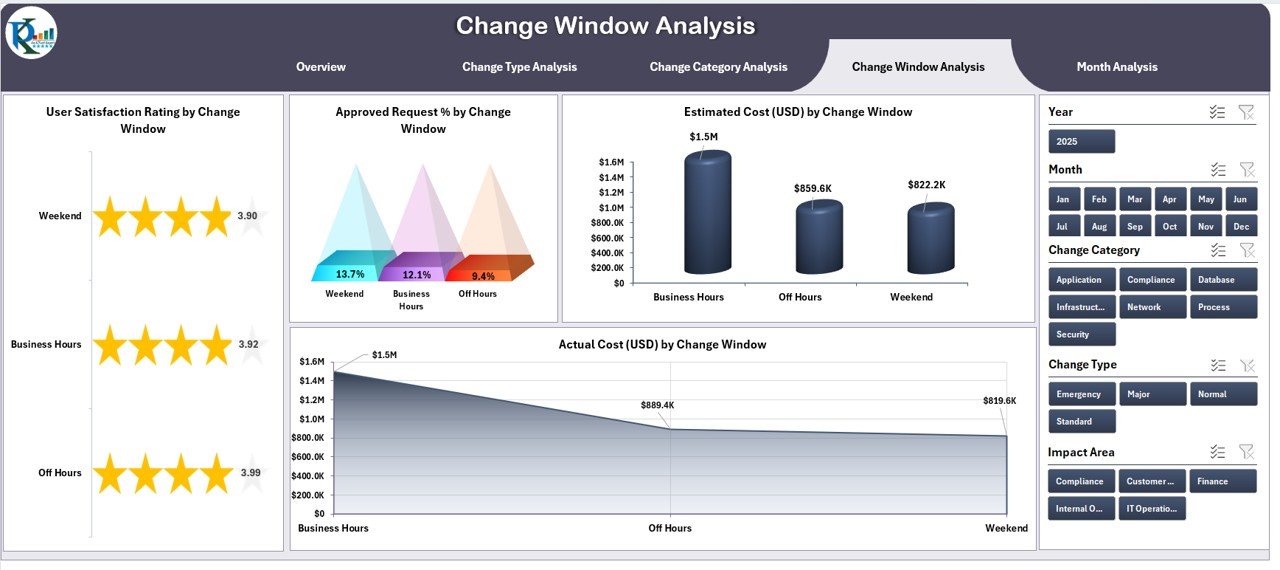
⭐ 4. Change Window Analysis Page – Analyze Timing Success
Organizations often schedule changes during specific windows such as night shifts, weekends, or maintenance periods.
This page tracks:
-
✔ Satisfaction by Window
-
✔ Approval %
-
✔ Estimated vs Actual Cost
With this, companies identify which time windows deliver the best outcomes.
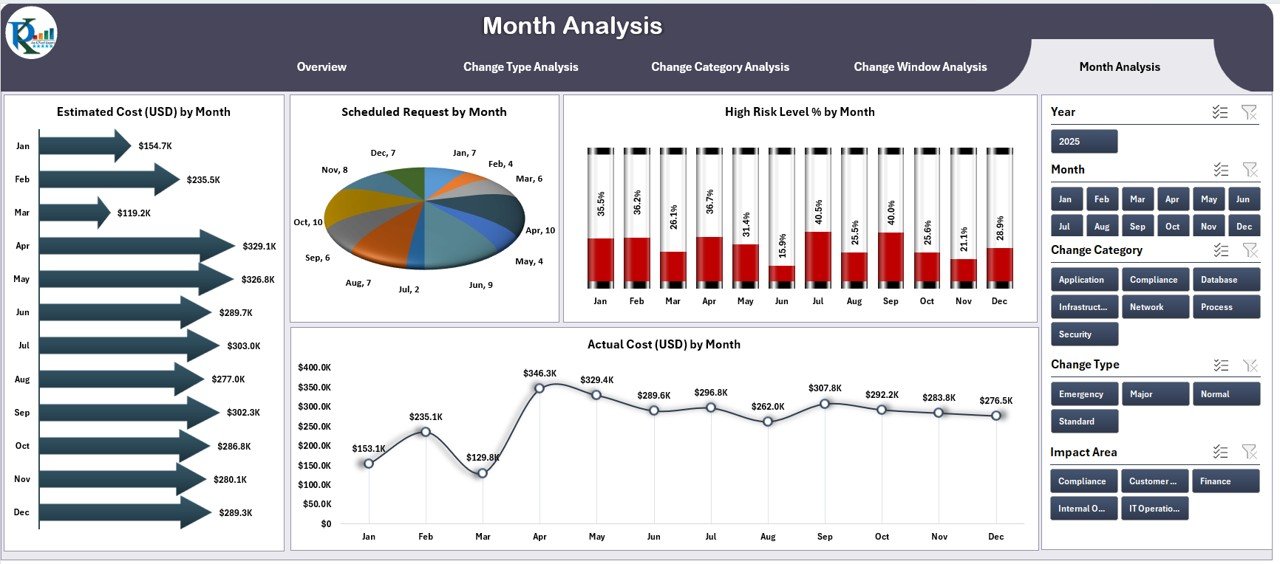
⭐ 5. Month Analysis Page – View Monthly Patterns & Trends
Monitor how changes move over time with:
-
✔ Estimated Cost by Month
-
✔ Scheduled Requests
-
✔ High Risk Level %
-
✔ Actual Cost
This helps organizations identify seasonal patterns, monthly improvements, and upcoming risks.
📦 What’s Inside the Change Management Dashboard
When you download this dashboard, you get:
-
A fully interactive Excel dashboard
-
Five analytical pages
-
KPI cards, slicers & charts
-
Color-coded visuals
-
Clean page navigation buttons
-
A Support Sheet containing lookup values
-
A Data Sheet to add raw data
-
Automated updates—just enter data and refresh
Everything is optimized for speed, clarity, and professional reporting.
🧩 How to Use the Change Management Dashboard in Excel
Using the dashboard is very easy:
-
🔽 Open the Excel file
-
📥 Add your data to the Data Sheet
-
🔄 Refresh calculations
-
🎚 Use slicers to filter by region, type, category, owner, or month
-
📊 Explore KPI cards and charts
-
🚨 Identify high-risk changes
-
💰 Compare estimated vs actual cost
-
📈 Review user satisfaction trends
No coding. No complex setup. Everything works with basic Excel.
👤 Who Can Benefit from This Change Management Dashboard
This dashboard is perfect for:
-
🧑💼 Change Managers
-
🧩 Project Managers
-
📊 PMO Teams
-
🛠 IT Teams
-
💼 Business Analysts
-
💡 Senior Leaders
-
🔍 Auditors & Compliance Teams
Any team handling changes, approvals, budgets, or risk will benefit from this tool.
### Click hare to read the Detailed blog post
Visit our YouTube channel to learn step-by-step video tutorials
👉 Youtube.com/@PKAnExcelExpert


Reviews
There are no reviews yet.