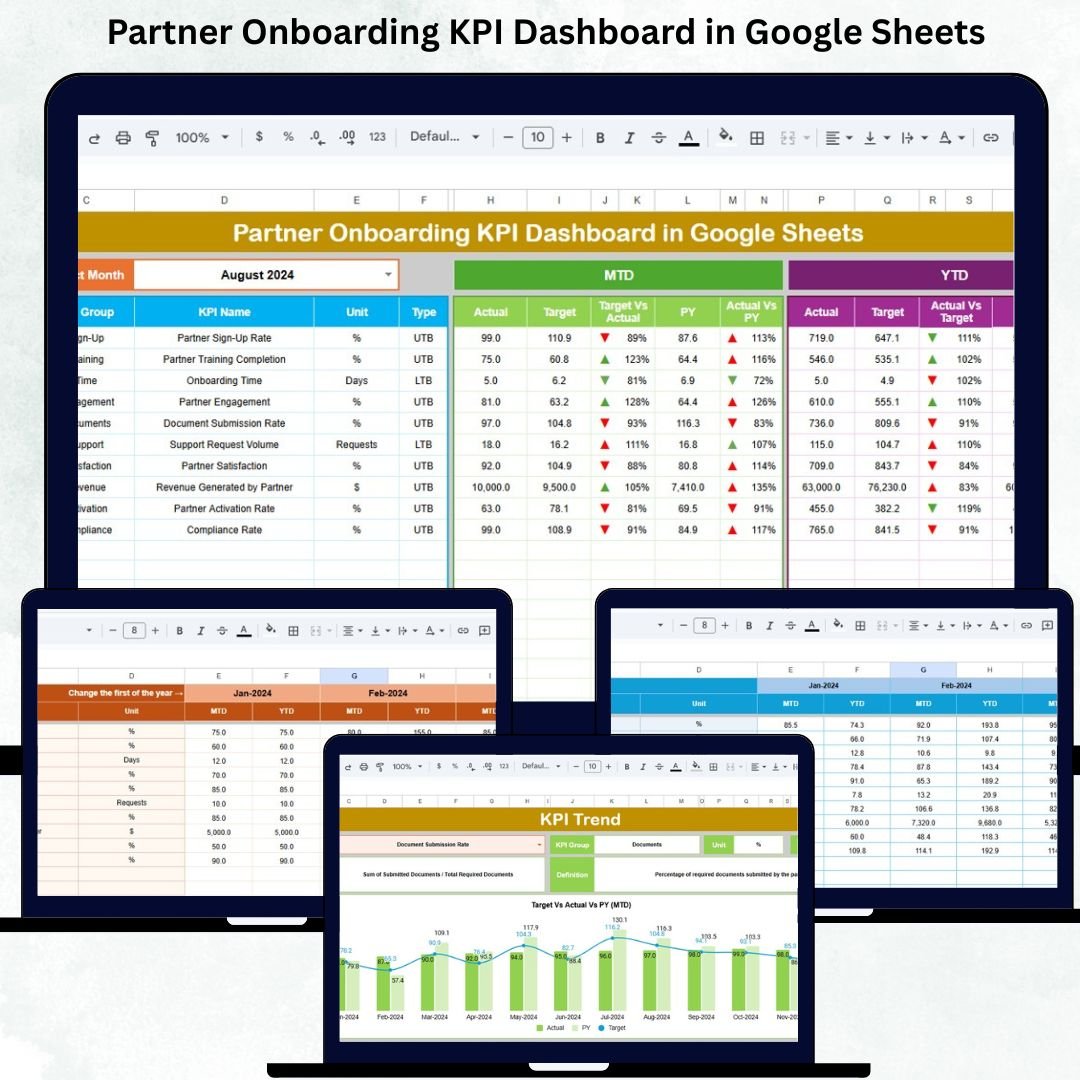
Partner Onboarding KPI Dashboard in Google Sheets is one of the most crucial phases in building long-term, high-value partner relationships. A smooth onboarding process helps partners understand your systems faster, complete training on time, configure tools properly, and begin generating revenue sooner. But without structured tracking, companies struggle to monitor onboarding speed, task completion, documentation readiness, and partner activation. That’s exactly why the Partner Onboarding KPI Dashboard in Google Sheets is the perfect solution.
This ready-to-use Google Sheets dashboard gives partner management teams a centralized view of onboarding performance across locations, programs, and partner tiers. With automated KPIs, visual charts, trend analysis, and MTD/YTD tracking, this dashboard eliminates guesswork and enables data-driven onboarding decisions. It helps you identify bottlenecks, measure partner readiness, and continuously improve onboarding efficiency.
✨ Key Features of the Partner Onboarding KPI Dashboard in Google Sheets
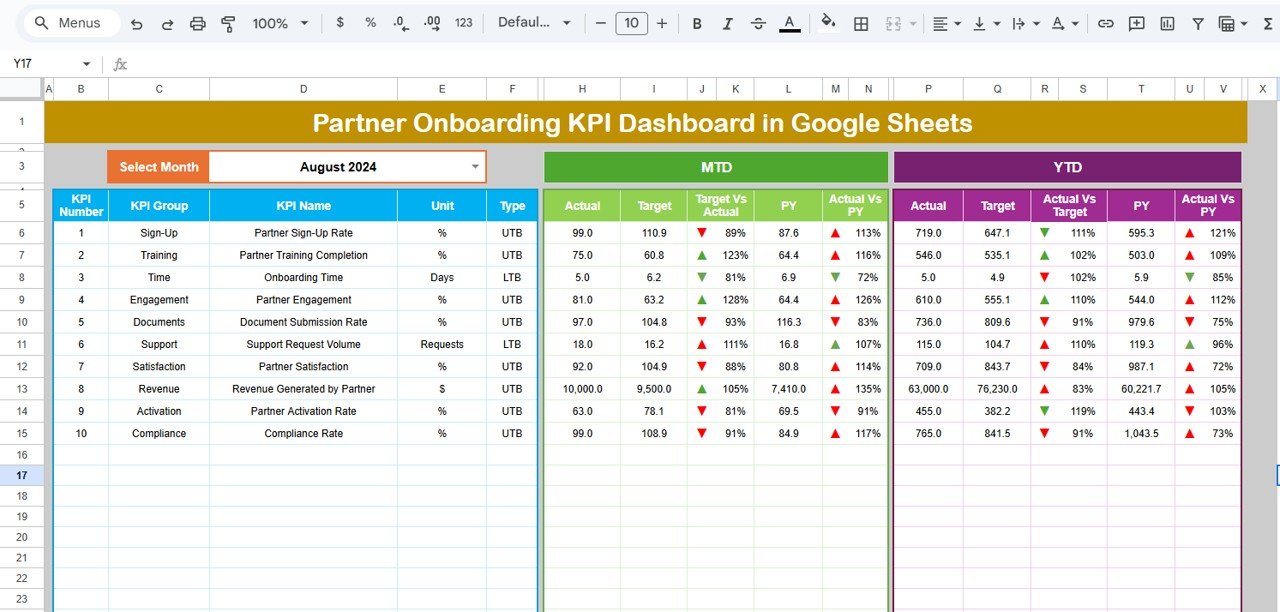
📊 1. Centralized Dashboard for Onboarding Performance
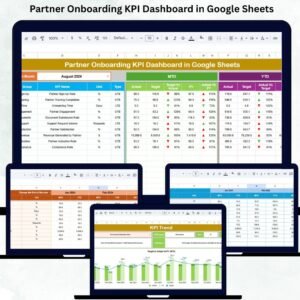
The Dashboard Sheet Tab is the main page where all onboarding KPIs come together visually.
It displays:
-
MTD Actual, Target, Previous Year
-
YTD Actual, Target, Previous Year
-
Target vs Actual (with green ↑ / red ↓ arrows)
-
Previous Year vs Actual (with comparison arrows)
With a simple month selection (Range D3), the entire dashboard refreshes automatically. This allows partner managers to quickly evaluate onboarding status for the selected period.
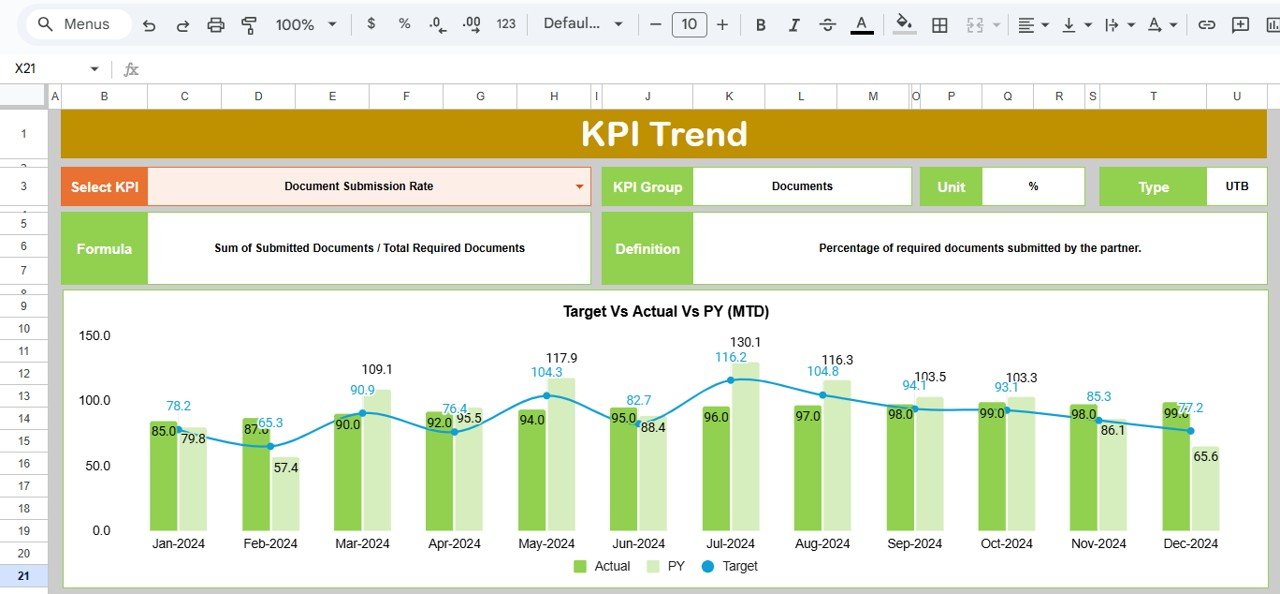
📈 2. KPI Trend Sheet for Deep Performance Analytics
Selecting a KPI from Range C3 reveals:
-
KPI Group
-
Unit
-
Performance Type (Upper/Lower Better)
-
KPI Formula
-
KPI Definition
-
KPI Trend Chart
This sheet helps partner teams understand month-wise movement in onboarding performance and identify recurring delays or improvements.
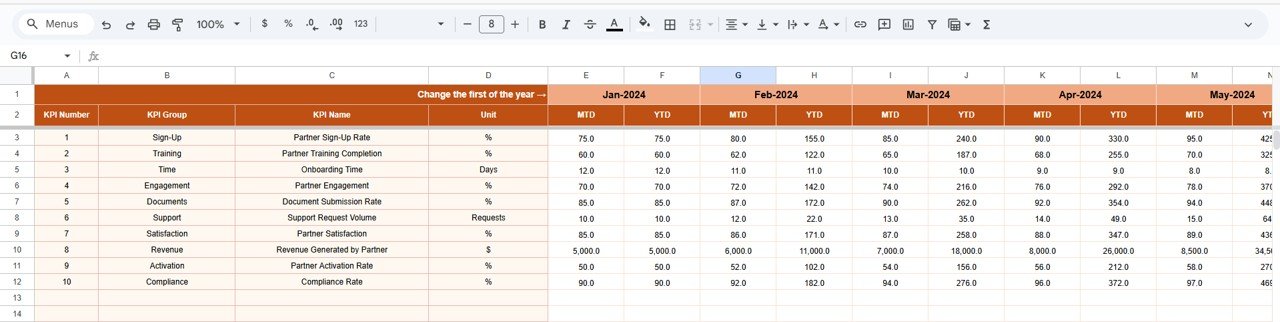
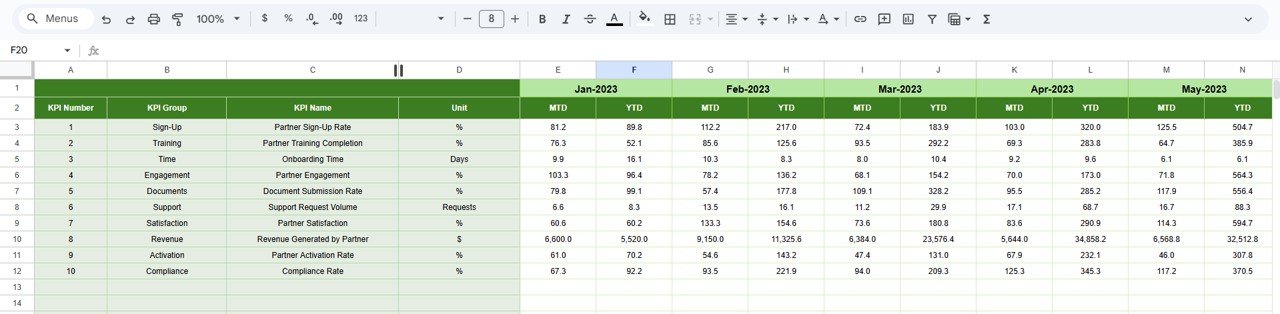
🧮 3. Actual Number Sheet – Real Data Input
Enter MTD and YTD actual values here. Changing the starting month (Range E1) aligns all calculations. This sheet acts as the operational core of your dashboard.
🎯 4. Target Sheet – Benchmarking Onboarding Success
Record monthly and yearly targets for each onboarding KPI. These targets are used to visually compare planned vs actual onboarding results.
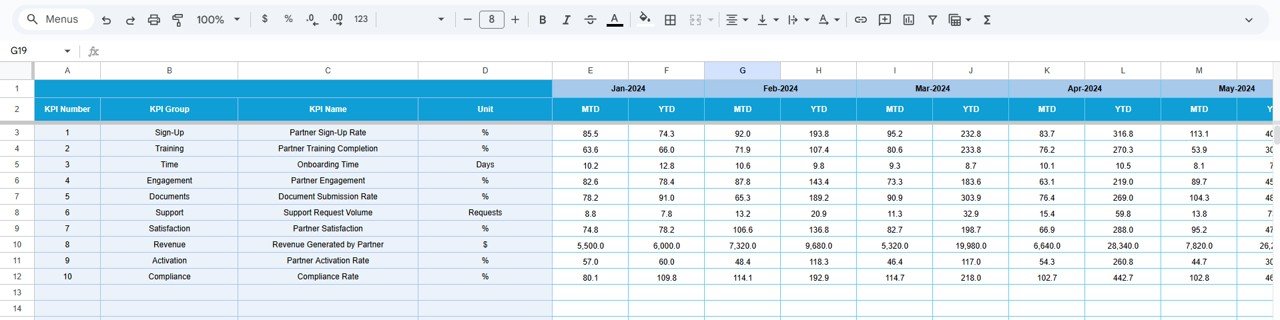
📅 5. Previous Year Sheet – Historical Benchmarking
Input previous year’s onboarding data to measure progress year-over-year. This allows teams to evaluate the long-term effectiveness of the onboarding strategy.
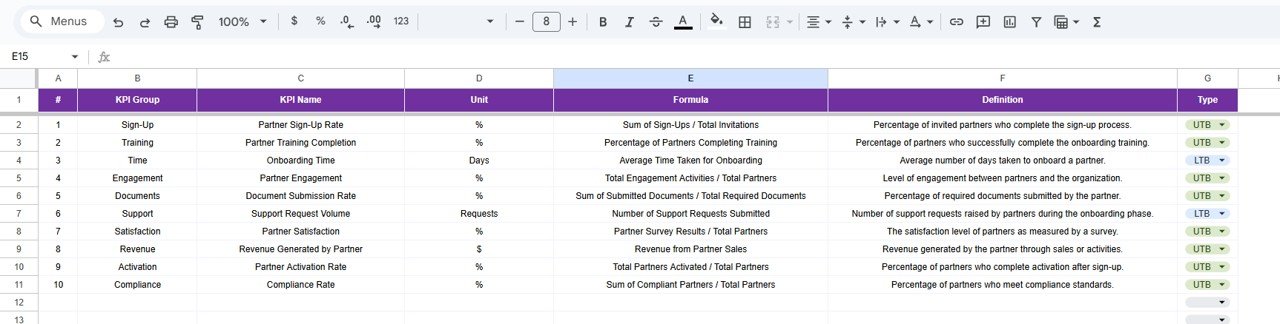
📘 6. KPI Definition Sheet – Complete KPI Reference
Every KPI includes:
-
Name
-
Unit
-
Definition
-
Formula
-
Group
-
Performance Direction
This ensures that everyone — onboarding managers, channel operations, partner teams — follow consistent definitions.
📦 What’s Inside the Partner Onboarding KPI Dashboard in Google Sheets
📊 Dashboard Sheet – Complete Onboarding Overview
Instant visibility into onboarding delays, training metrics, activation timelines, and compliance scores.
📈 KPI Trend Sheet – Historical Performance Review
Perfect for quarterly reviews and onboarding strategy meetings.
🧮 Actual Number Sheet – Live Onboarding Data
Update regularly for accurate KPI reporting.
🎯 Target Sheet – Goal Setting for Teams
Align onboarding performance with organizational objectives.
📅 Previous Year Sheet – Compare & Improve
See exactly how onboarding success has evolved.
📘 KPI Definition Sheet – Standardized KPI Logic
Ensures clarity for all teams involved.
🛠️ How to Use the Partner Onboarding KPI Dashboard in Google Sheets
1️⃣ Step 1 — Enter Current Data
Update MTD/YTD onboarding numbers in the Actual sheet.
2️⃣ Step 2 — Set Monthly Targets
Define expected onboarding performance using the Target sheet.
3️⃣ Step 3 — Select a Month
Choose the month in Range D3 to refresh the dashboard.
4️⃣ Step 4 — Review Trends
Use the KPI Trend sheet to analyze bottlenecks.
5️⃣ Step 5 — Compare with Previous Year
Understand how much faster or slower onboarding has become.
6️⃣ Step 6 — Optimize Strategy
Use insights to improve partner training, documentation, and activation processes.
🎯 Who Can Benefit from the Partner Onboarding KPI Dashboard?
🤝 Partner Managers & Channel Teams
Track onboarding completion and readiness.
📊 Channel Operations Teams
Measure onboarding efficiency across regions.
🏢 Business Owners & Leaders
Get visibility into partner activation timelines.
📈 Marketing & Enablement Teams
Optimize training modules and onboarding content.
📁 Implementation & Success Teams
Ensure partners are fully prepared for engagement.
Click here to read the Detailed blog post
Watch the step-by-step video Demo:


Reviews
There are no reviews yet.