Managing airport operations requires accurate data, real-time insights, and fast decision-making. With thousands of passengers, multiple departments, and nonstop activities happening every single day, airport managers need a simple yet powerful system to monitor performance. The Airports KPI Dashboard in Excel is a ready-to-use, fully automated, and visually rich performance dashboard that helps airport teams track KPIs effortlessly.
This dashboard transforms complicated datasets into clean visuals, intuitive charts, and easy-to-read analytics—making it the perfect all-in-one tool for airport operations, passenger services, safety, cargo, and management teams.
✈️ Key Features of the Airports KPI Dashboard in Excel
The Airports KPI Dashboard in Excel is packed with smart features that simplify tracking, monitoring, and reporting airport performance.
✨ User-Friendly Layout
✔ Navigate through the dashboard with clean buttons
✔ Instantly jump to Dashboard, Trend, Input sheets & more
✔ Zero technical skills required
📊 Powerful MTD & YTD Analytics
✔ Compare Actual vs Target values
✔ Automatic color-coded visuals for positive/negative performance
✔ Real-time KPI direction indicators (⬆️⬇️)
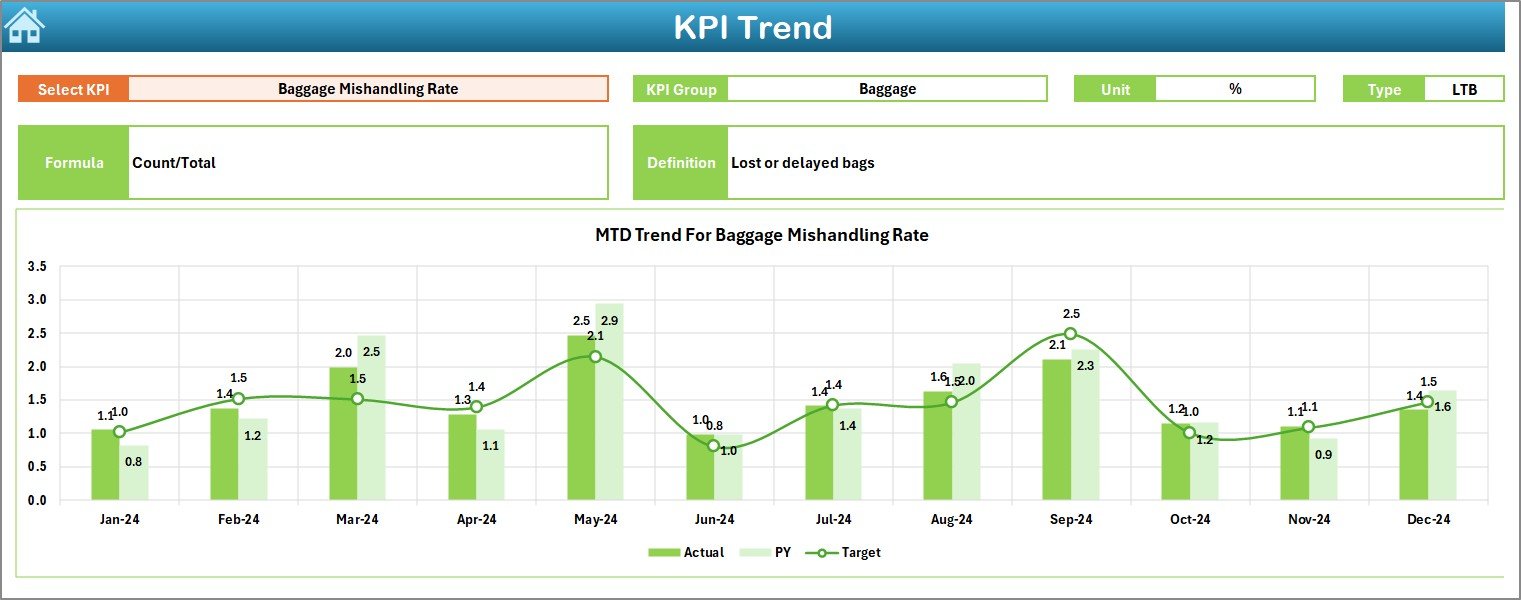
📈 Dynamic Trend Analysis
✔ Select any KPI and view yearly trends
✔ Analyze Actual, Target & Previous Year data
✔ Identify seasonal changes and performance gaps
⚙️ Fully Automated Data Flow
✔ Enter data once and all visuals update automatically
✔ No coding or advanced Excel knowledge needed
📑 Complete KPI Knowledge Base
✔ Understand KPI definitions, formulas, units & KPI types
✔ Ideal for training new employees

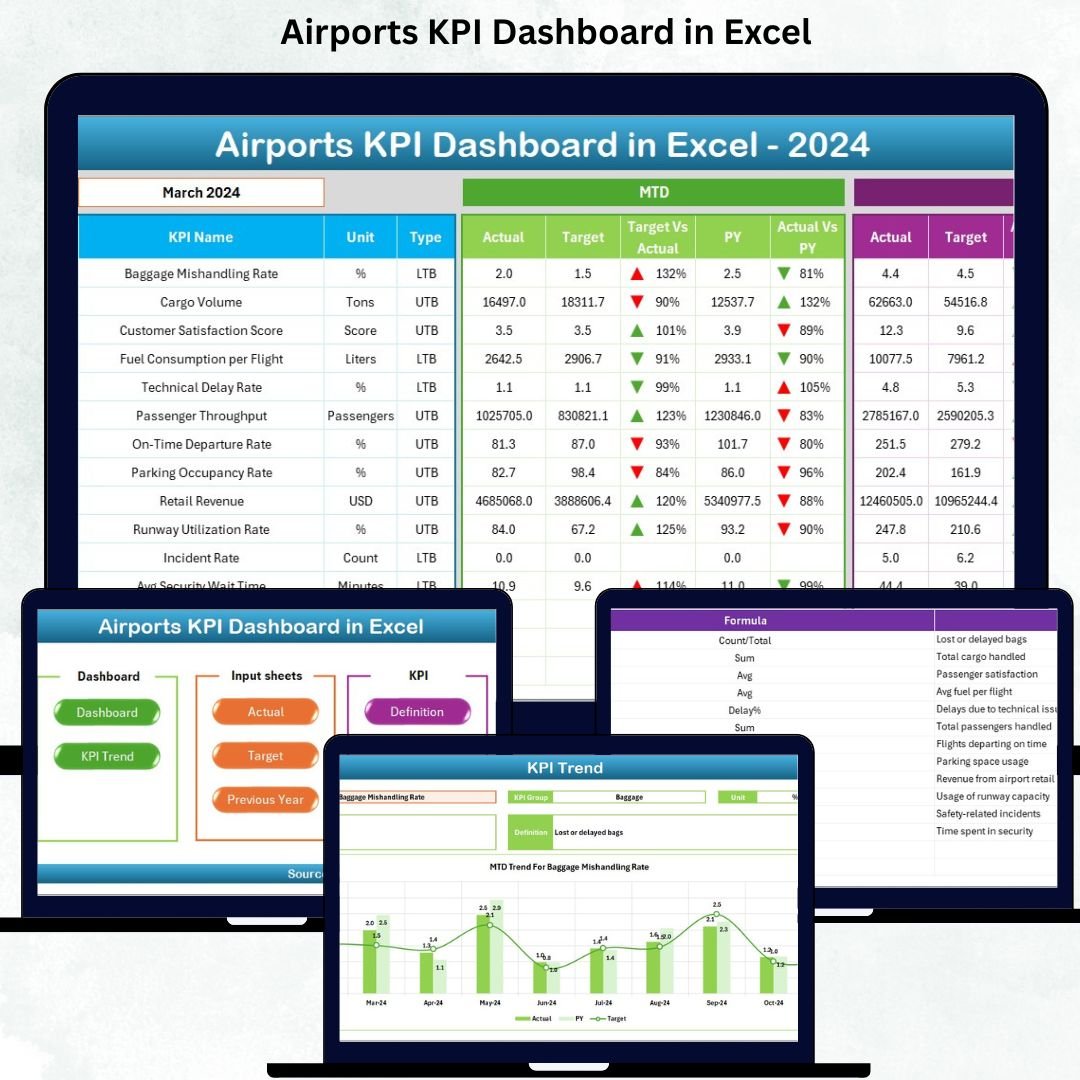
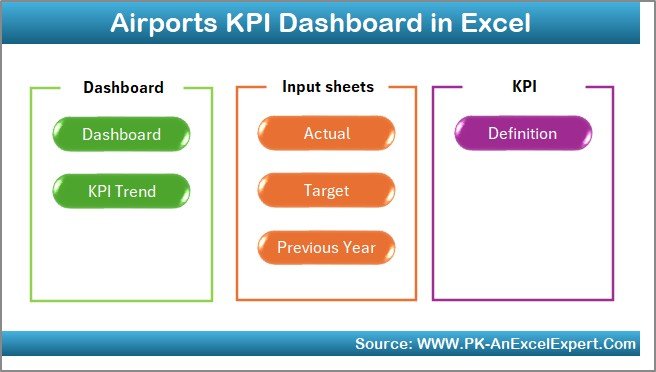
📂 What’s Inside the Airports KPI Dashboard
The dashboard contains 7 fully organized worksheets, each designed to give maximum clarity:
🔹 1. Summary Page
➡ Central navigation hub
➡ Six buttons to access every major sheet within seconds
🔹 2. Dashboard Sheet
➡ Visual control center for all KPIs
➡ MTD & YTD charts, performance arrows, comparisons, and KPI cards
➡ Month selector updates the entire dashboard instantly
🔹 3. Trend Sheet
➡ Deep KPI trend analysis
➡ MTD vs YTD charts for long-term insights
➡ Auto-filled KPI details for faster understanding
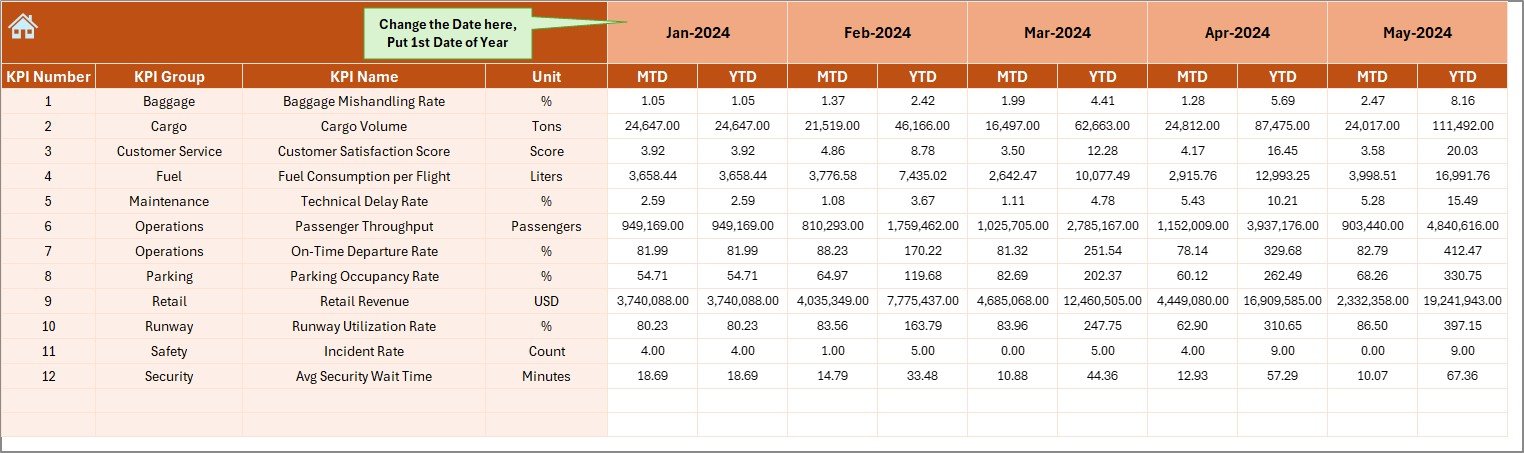
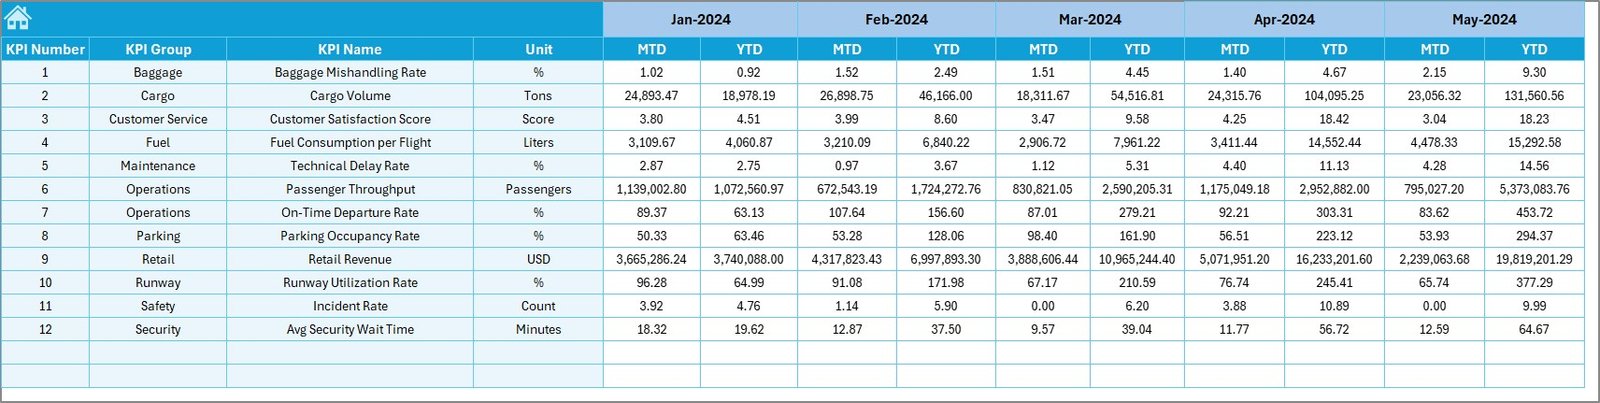
🔹 4. Actual Numbers Input Sheet
➡ Enter MTD & YTD actuals
➡ Choose starting month for flexible reporting
🔹 5. Target Sheet
➡ Enter monthly and yearly targets
➡ Helps plan staffing, resources, operations & efficiency
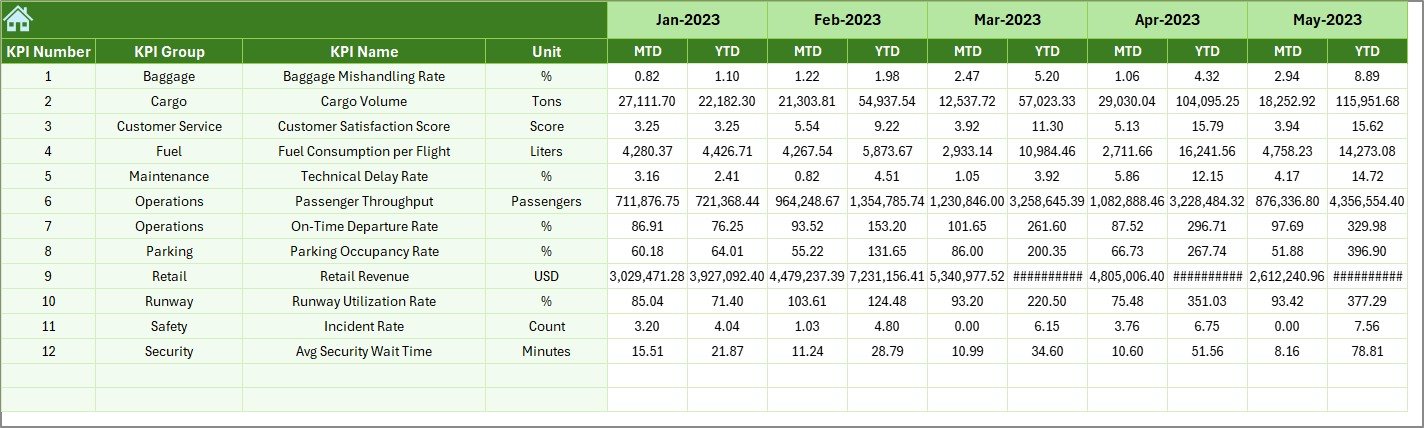
🔹 6. Previous Year Numbers
➡ Compare current performance vs past year
➡ Essential for forecasting and operational insights
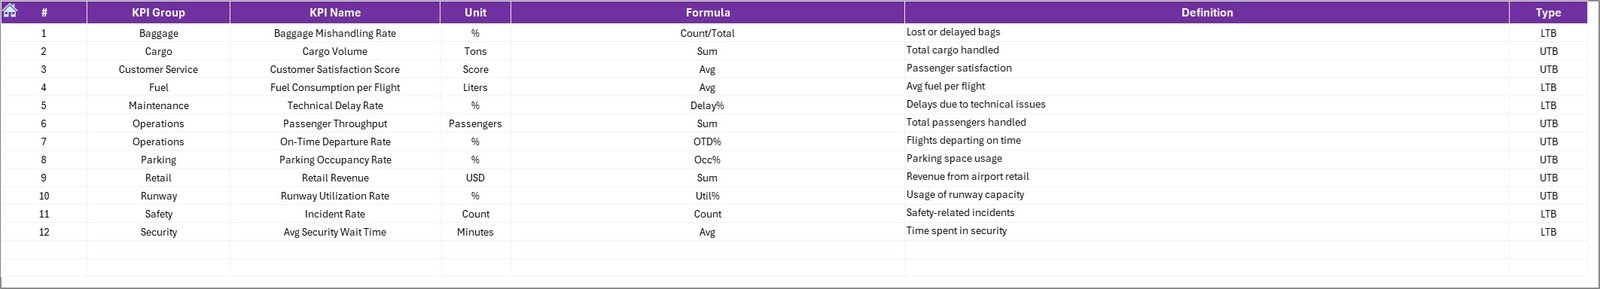
🔹 7. KPI Definition Sheet
➡ Clear reference sheet for formulas, definitions & KPI types
➡ Perfect for onboarding and process-training
🧭 How to Use the Airports KPI Dashboard
This dashboard is designed for simplicity—anyone can use it.
👣 Step 1: Enter Data
Add your monthly actuals, yearly totals, and previous year numbers.
👣 Step 2: Enter Targets
Fill target values for each KPI in the Target Sheet.
👣 Step 3: Select the Month
Choose your desired month from the drop-down to update visuals.
👣 Step 4: Analyze Trends
Use the Trend Sheet to study performance patterns and gaps.
👣 Step 5: Review KPIs
Check dashboard visuals, KPI comparisons, and directional arrows.
Within minutes, your full airport performance review is ready—automatically.
👥 Who Can Benefit from This Airports KPI Dashboard
This dashboard is ideal for:
🛫 Airport Managers
Track overall airport performance across key KPIs.
👨✈️ Operations & Flight Control Teams
Monitor on-time performance, delays, and flight activity.
🧳 Passenger Services
Improve passenger handling, wait times, and service quality.
🛅 Baggage & Ground Handling Departments
Monitor baggage delivery, cargo handling, and efficiency.
🛒 Retail & Revenue Teams
Track passenger flow and optimize commercial operations.
🛡 Safety & Security Teams
Monitor safety metrics, incident frequency, and compliance.
Whether it’s a small regional airport or a large international hub, this dashboard helps every team work smarter, faster, and more efficiently.
### Click here to read the Detailed blog post
Watch the step-by-step video tutorial:


Reviews
There are no reviews yet.