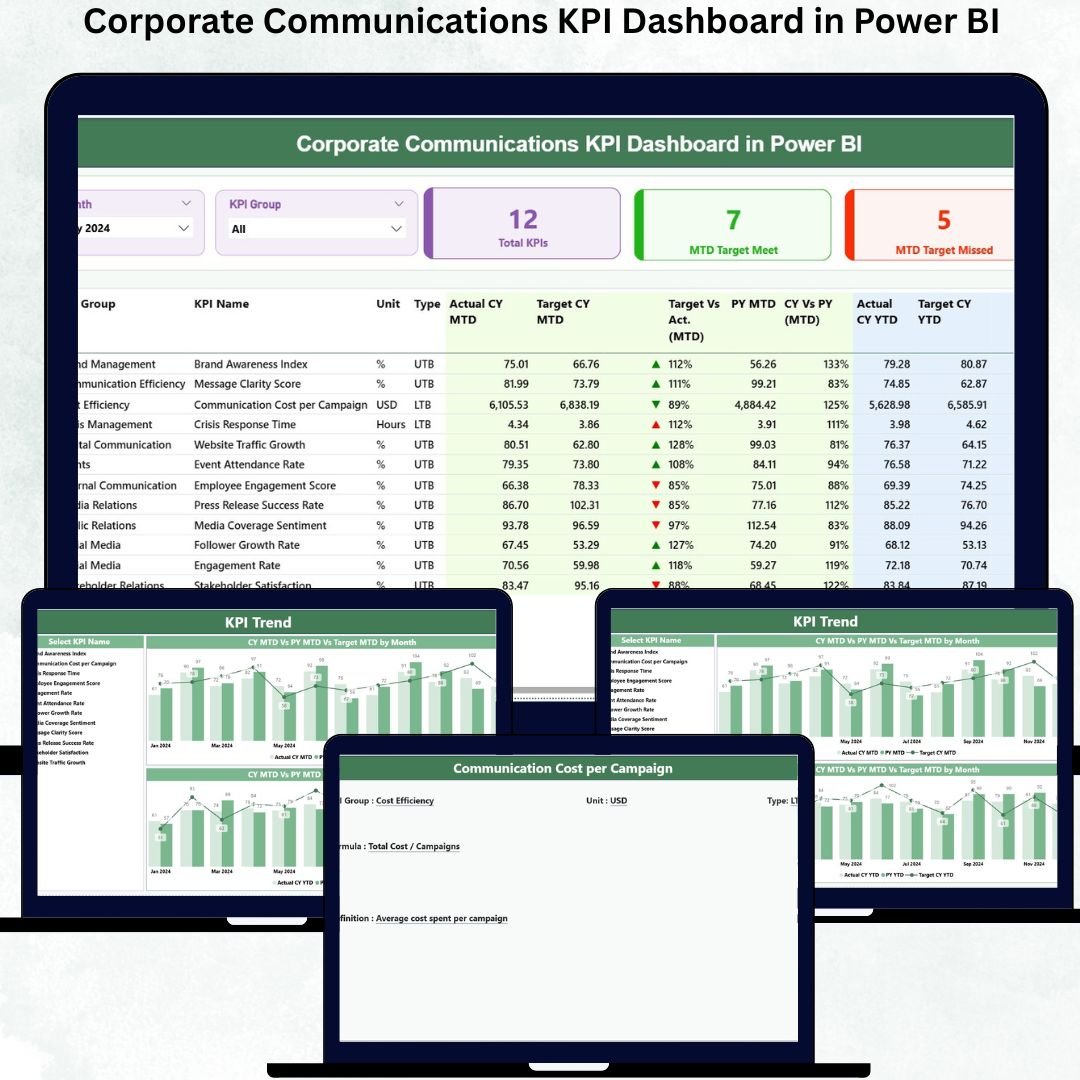

Corporate communication shapes how employees, customers, and stakeholders perceive an organization. It builds trust, strengthens alignment, and supports business strategy. But without data, communication teams often operate blindly. Corporate Communications KPI Dashboard in Power BI They send messages, run campaigns, and manage internal updates—yet cannot measure real impact. That’s where the Corporate Communications KPI Dashboard in Power BI becomes a game-changer.
This ready-to-use dashboard transforms raw communication data into clear visuals that show exactly what’s working and what needs improvement. Whether you are tracking engagement levels, campaign reach, internal announcements, employee awareness, or PR activity—this dashboard organizes everything in one clean, interactive interface. Corporate Communications KPI Dashboard in Power BI With smart slicers, trend charts, KPI tables, drill-through definitions, and real-time analytics, it helps communication leaders make confident, evidence-based decisions.
Built using Power BI and Excel, this dashboard is both powerful and easy to maintain. Simply update your Excel sheets with monthly Actual and Target values, refresh the report, and your entire dashboard updates automatically. No complex formulas. No manual reporting. No confusion.
✨ Key Features of the Corporate Communications KPI Dashboard in Power BI
The dashboard contains three fully functional pages designed to simplify internal and external communication performance tracking.
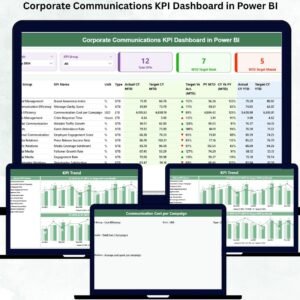
📌 Summary Page – Your Complete KPI Overview
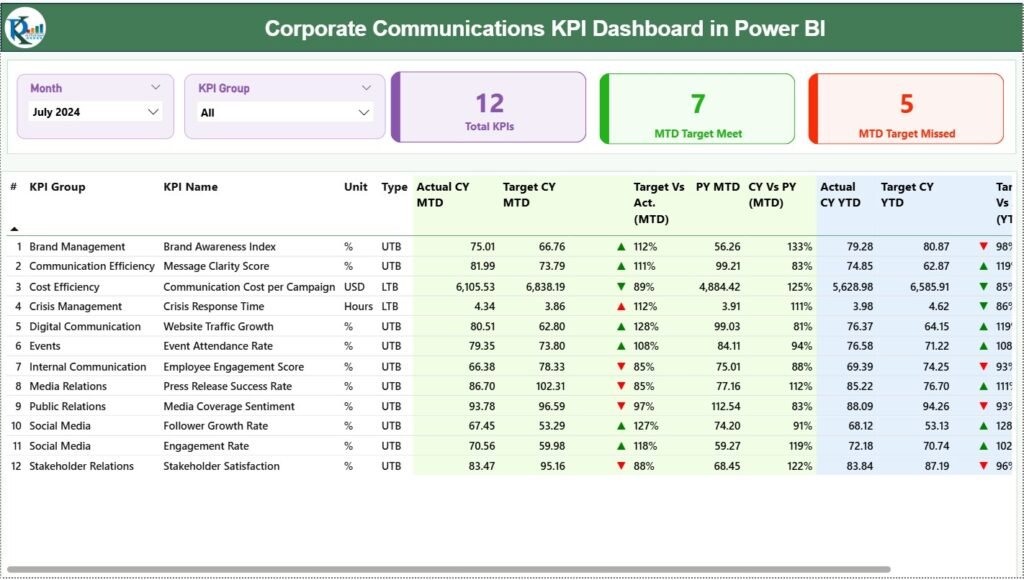
The Summary Page provides high-level communication insights at a glance. It includes:
✔ Month Slicer – instantly see monthly performance
✔ KPI Group Slicer – filter KPIs by category
Along with these slicers, the dashboard displays:
✔ Total KPIs Count
✔ MTD Target Met
✔ MTD Target Missed
A detailed KPI table provides deep clarity with metrics such as:
-
Actual vs Target (MTD & YTD)
-
Current Year vs Previous Year comparisons
-
KPI numbers, groups, names, units, and performance icons
This page becomes your communication command center, helping you identify areas that need attention.
📦 What’s Inside the Corporate Communications KPI Dashboard in Power BI
Your dashboard includes these three professionally designed pages:
1️⃣ Summary Page
A clear, structured page showing communication KPIs, performance symbols, monthly and yearly variances, and target achievement.
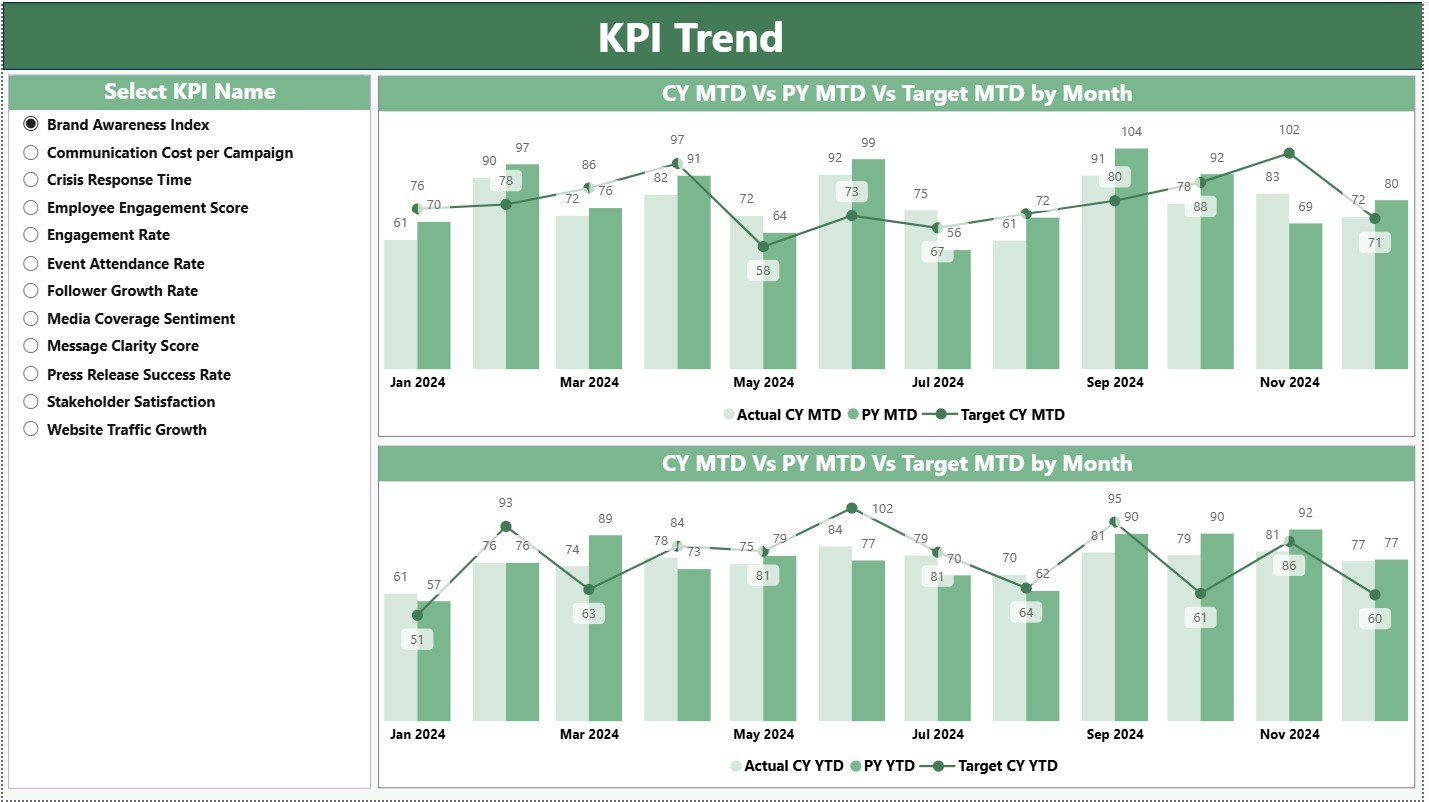
2️⃣ KPI Trend Page
This page visualizes communication trends over time. It includes:
✔ A KPI Name slicer
✔ Combo charts for MTD trends
✔ Combo charts for YTD trends
These visuals help you study seasonality, performance gaps, and yearly improvements.
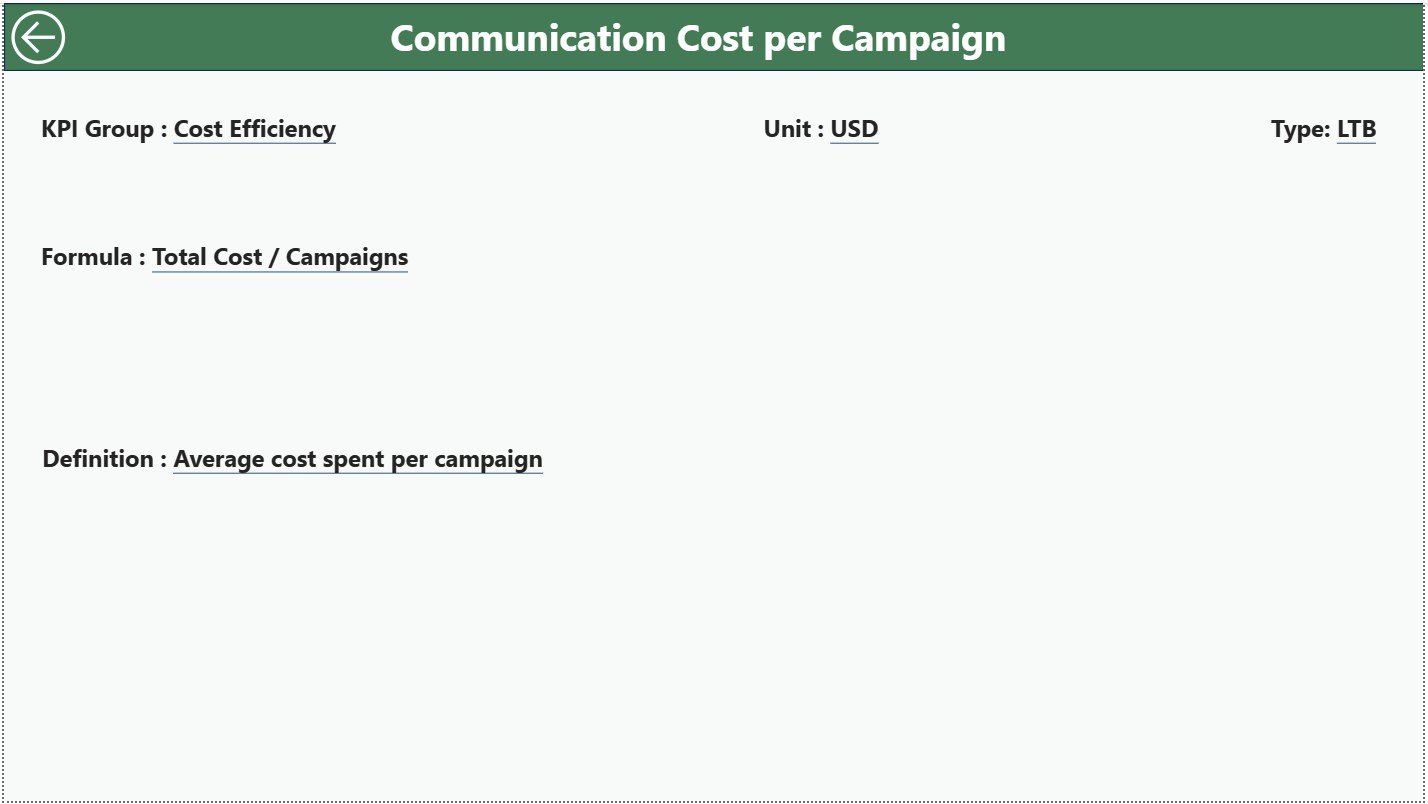
3️⃣ KPI Definition Page
A drill-through page where you will find:
✔ KPI Name
✔ KPI Group
✔ Formula
✔ Definition
✔ KPI Type (UTB/LTB)
This page ensures that everyone—HR, PR, leadership, or communication teams—understands how each KPI is calculated.
🛠️ How to Use the Corporate Communications KPI Dashboard in Power BI
Using this dashboard is extremely simple:
👉 Step 1: Update the Excel Source File
Enter the latest Actual and Target values for MTD and YTD.
👉 Step 2: Refresh Power BI
Your visuals update instantly.
👉 Step 3: Use Slicers to Filter Insights
Filter by month, KPI group, or specific KPI for deeper understanding.
👉 Step 4: Explore Trend Charts
Study multi-year behavior to forecast communication results.
👉 Step 5: Drill Through to View KPI Definitions
Understand formulas, units, and KPI meaning with one click.
👉 Step 6: Share Insights with Stakeholders
Perfect for management meetings, internal reporting, and strategic planning.
🎯 Who Can Benefit from This Corporate Communications KPI Dashboard?
This dashboard is designed for every team involved in communication:
👩💼 Internal Communication Teams
Measure employee engagement, awareness, and response time.
📰 PR & Media Teams
Track coverage, outreach, and message effectiveness.
🏢 HR Communication Units
Evaluate internal announcements and policy communication.
📈 Senior Leaders & Executives
Access real-time performance insights with zero manual effort.
📣 Corporate Marketing Teams
Monitor internal campaign reach and communication accuracy.
No matter the industry, any company that values communication can benefit from this dashboard.


Reviews
There are no reviews yet.