
Franchise businesses grow fast, operate across many locations, and serve different customer groups every day. Managing revenue, compliance, store quality, customer satisfaction, and operational efficiency becomes challenging without a centralized system. To run a successful franchise, leaders need clear visibility across all outlets — and that’s where the Franchise Management KPI Dashboard in Google Sheets becomes a complete game-changer.Franchise Management KPI Dashboard in Google Sheets
This ready-to-use, cloud-based dashboard allows franchisors and franchise partners to track MTD performance, YTD results, target achievement, and previous-year comparisons accurately. With automated charts, KPI trend analytics, conditional arrows, and visual indicators, the dashboard makes franchise monitoring simple, fast, and data-driven. It removes guesswork and replaces it with structured insights your entire team can use to improve profitability and operational excellence.Franchise Management KPI Dashboard in Google Sheets
Perfect for franchise owners, area managers, multi-location retail chains, F&B brands, service franchises, and corporate teams — this dashboard helps you make smarter decisions based on real-time data.Franchise Management KPI Dashboard in Google Sheets

✨ Key Features of the Franchise Management KPI Dashboard in Google Sheets
📊 1. All KPIs in One Central Dashboard
The main dashboard sheet instantly updates when you select a month (Range D3). It displays:
-
MTD Actual
-
MTD Target
-
MTD Previous Year
-
YTD Actual
-
YTD Target
-
YTD Previous Year
-
Target vs Actual
-
PY vs Actual comparisons
Conditional formatting with green ↑ for improvement and red ↓ for decline helps you quickly assess performance.
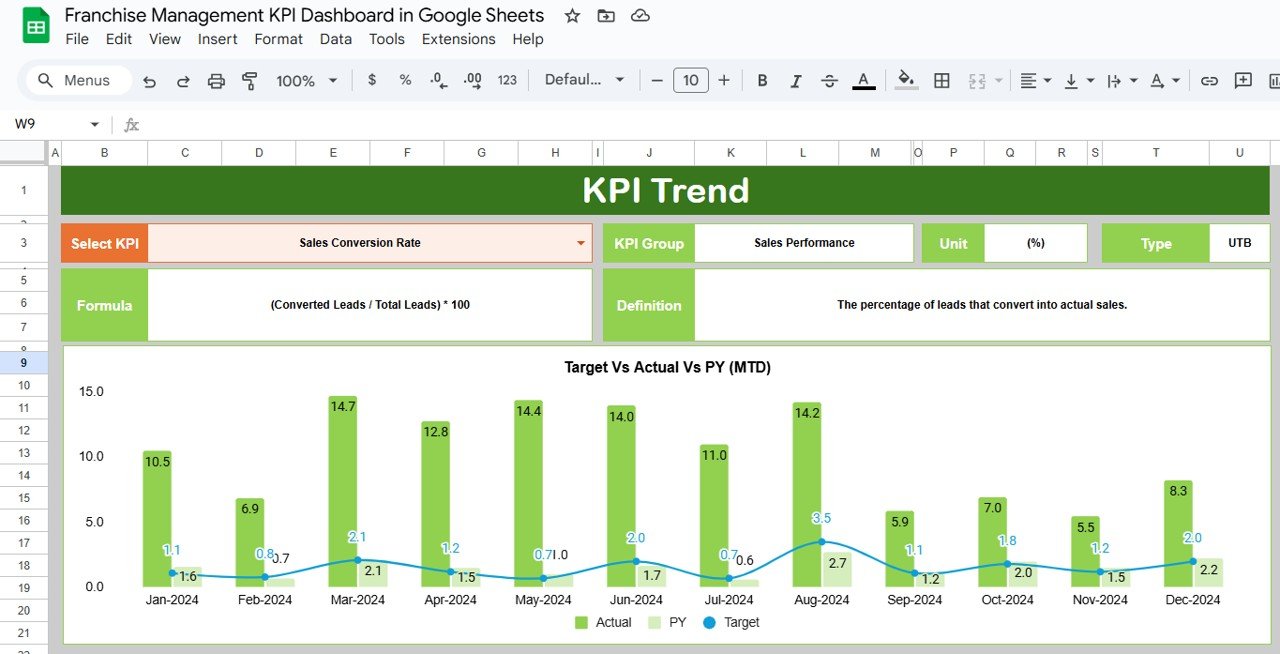
📈 2. KPI Trend Sheet for In-Depth Analysis
The KPI Trend Sheet allows you to select any KPI from Range C3 and view:
-
KPI Group
-
Unit of Measurement
-
Upper/Lower the Better
-
KPI Formula
-
KPI Definition
-
KPI Trend Chart
This sheet is essential for understanding performance patterns across months.
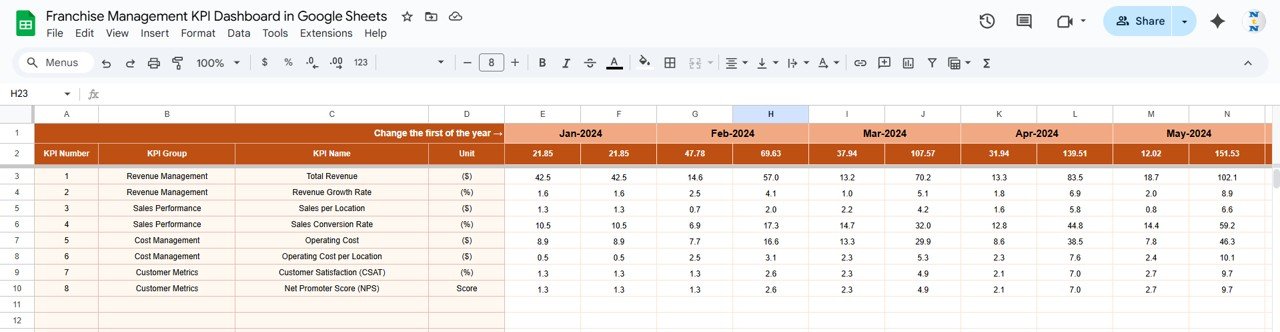
🧮 3. Actual Number Sheet – Accurate Performance Input
Enter MTD and YTD actual data here. Changing the starting month in Range E1 dynamically updates all layout calculations.
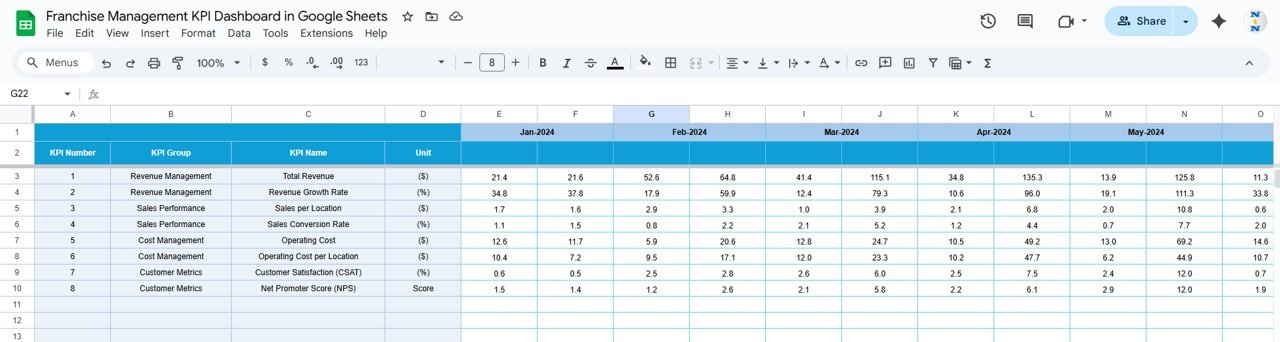
🎯 4. Target Sheet – Goal Alignment for Every KPI
Add MTD and YTD target values for each KPI. This sheet ensures that the dashboard provides accurate target-vs-actual insights.
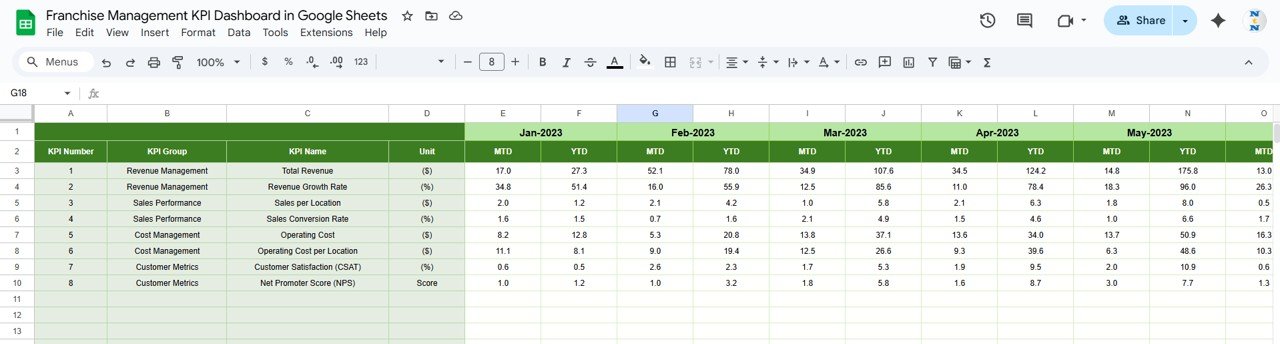
📅 5. Previous Year Sheet – Track YOY Growth
Enter previous year’s KPI data to compare long-term growth, performance, and consistency across franchise locations.
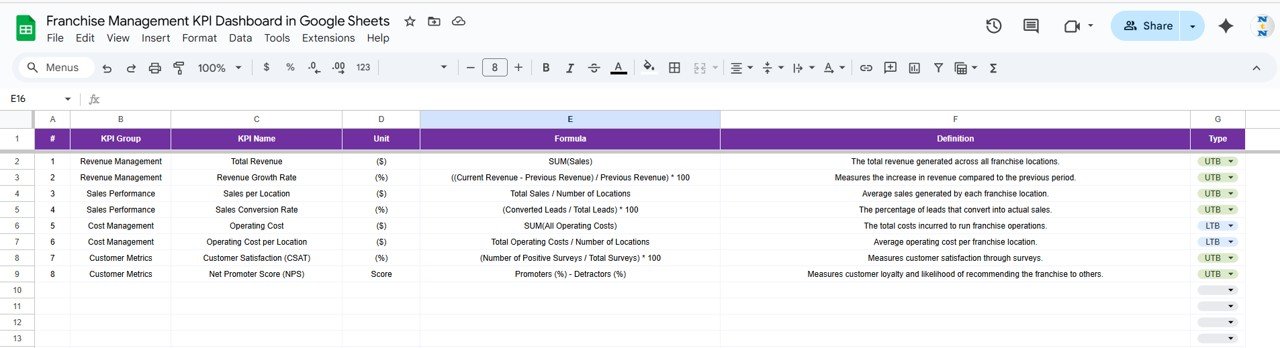
📘 6. KPI Definition Sheet – Complete KPI Dictionary
Includes KPI Name, Group, Unit, Formula, Definition, and Type (UTB/LTB). This ensures consistency across franchise partners and internal teams.
📦 What’s Inside the Franchise Management KPI Dashboard in Google Sheets
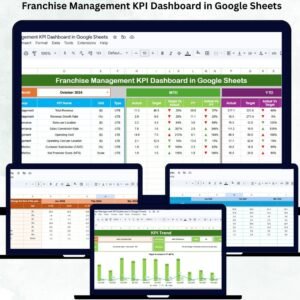
📊 Dashboard Sheet – Franchise Performance Overview
This sheet gives a quick, visual summary of sales, customer experience, compliance, operations, and efficiency. With auto-updating charts and indicators, leaders can instantly understand which stores perform well and which need support.
📈 KPI Trend Sheet – Visual Performance Patterns
This sheet is perfect for weekly reviews, strategy meetings, and franchise audits. Trend charts make it easy to catch improvements or dips early.
🧮 Actual Number Sheet – Monthly Data Records
All performance numbers originate here. Simply update the actual values each month.
🎯 Target Sheet – Franchise-Level Goal Setting
Define monthly and yearly goals for each franchise KPI to maintain alignment across all locations.
📅 Previous Year Sheet – Benchmarking
Essential for analyzing growth, performance consistency, and operational improvements.
📘 KPI Definition Sheet – Learning Guide
Great for onboarding new franchise partners or training store managers.
🛠️ How to Use the Franchise Management KPI Dashboard in Google Sheets
1️⃣ Step 1 — Enter Actual Data
Update MTD and YTD numbers in the Actual Number sheet.
2️⃣ Step 2 — Update Targets
Enter performance targets for each KPI.
3️⃣ Step 3 — Select Month
Choose the month in Range D3 to view updated results.
4️⃣ Step 4 — Track Trends
Use the KPI Trend sheet to understand performance changes over time.
5️⃣ Step 5 — Compare YoY Performance
Analyze previous-year comparisons to measure growth and consistency.
6️⃣ Step 6 — Take Action
Use insights to improve sales, operations, compliance, and customer satisfaction.
🎯 Who Can Benefit from the Franchise Management KPI Dashboard in Google Sheets
🏪 Franchise Owners & Corporate Teams
Monitor store performance and ensure operational excellence.
📊 Area & Regional Managers
Review store-level KPIs, identify weak areas, and plan store visits.
📈 Marketing & Sales Teams
Track customer satisfaction and sales growth across locations.
💼 Operations & Compliance Departments
Ensure SOP compliance, audit performance, and staff efficiency.
🤝 Franchise Partners
Understand performance expectations and manage stores effectively.
Click here to read the Detailed blog post
Watch the step-by-step video Demo:


Reviews
There are no reviews yet.