
Channel sales are one of the most powerful ways to expand market reach, boost revenue, and strengthen brand presence. But managing distributors, wholesalers, partners, and resellers becomes difficult without proper visibility into performance. Sales teams often juggle multiple spreadsheets, rely on guesswork, or face delays in reporting — leading to inefficiencies and missed targets. This is where the Channel Sales KPI Dashboard in Google Sheets becomes a game-changing tool.Channel Sales KPI Dashboard in Google Sheets
This ready-to-use dashboard gives sales leaders, managers, and channel partners instant clarity on performance. It tracks Month-To-Date (MTD), Year-To-Date (YTD), target achievement, and previous-year results through automated charts, KPIs, and conditional indicators. Whether you manage small reseller networks or global distribution channels, this dashboard ensures accurate, fast, and data-driven decision-making.Channel Sales KPI Dashboard in Google Sheets
✨ Key Features of the Channel Sales KPI Dashboard in Google Sheets
📊 1. Centralized Sales Performance Tracking
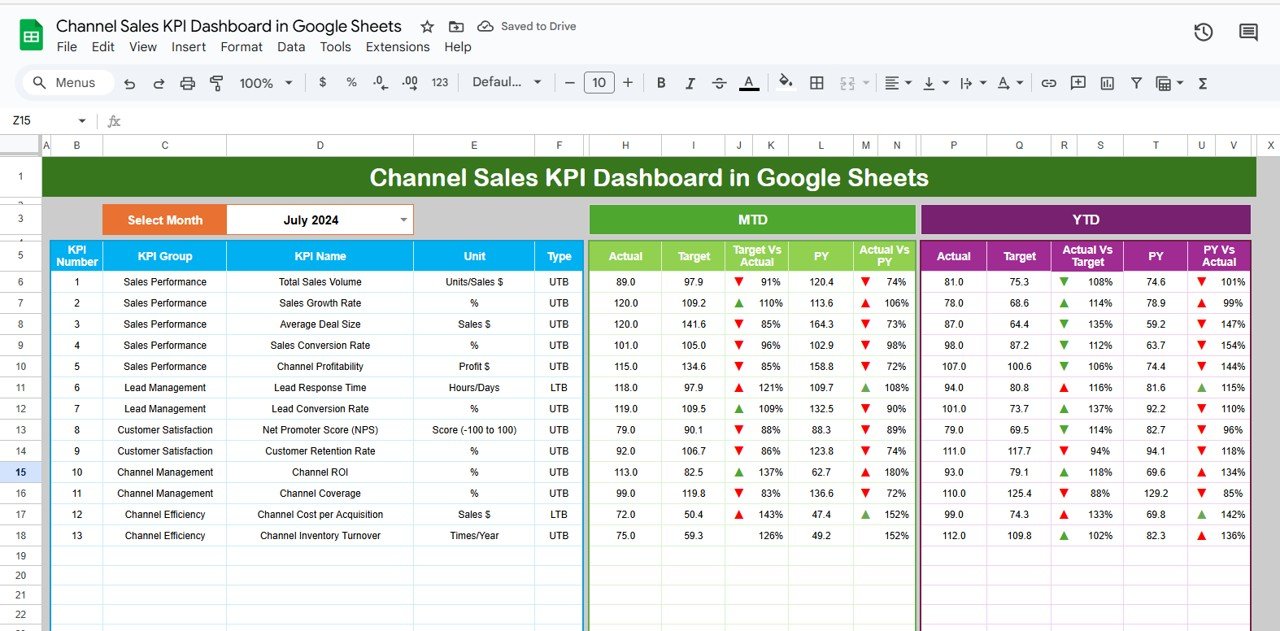
The main dashboard sheet shows your complete channel sales picture. With a simple dropdown (Range D3), you can switch months and instantly see updated values for:Channel Sales KPI Dashboard in Google Sheets
-
MTD Actual
-
MTD Target
-
MTD Previous Year
-
YTD Actual
-
YTD Target
-
YTD Previous Year
-
Target vs Actual comparison
-
PY vs Actual comparison
Conditional formatting arrows help highlight improvement or decline at a glance.
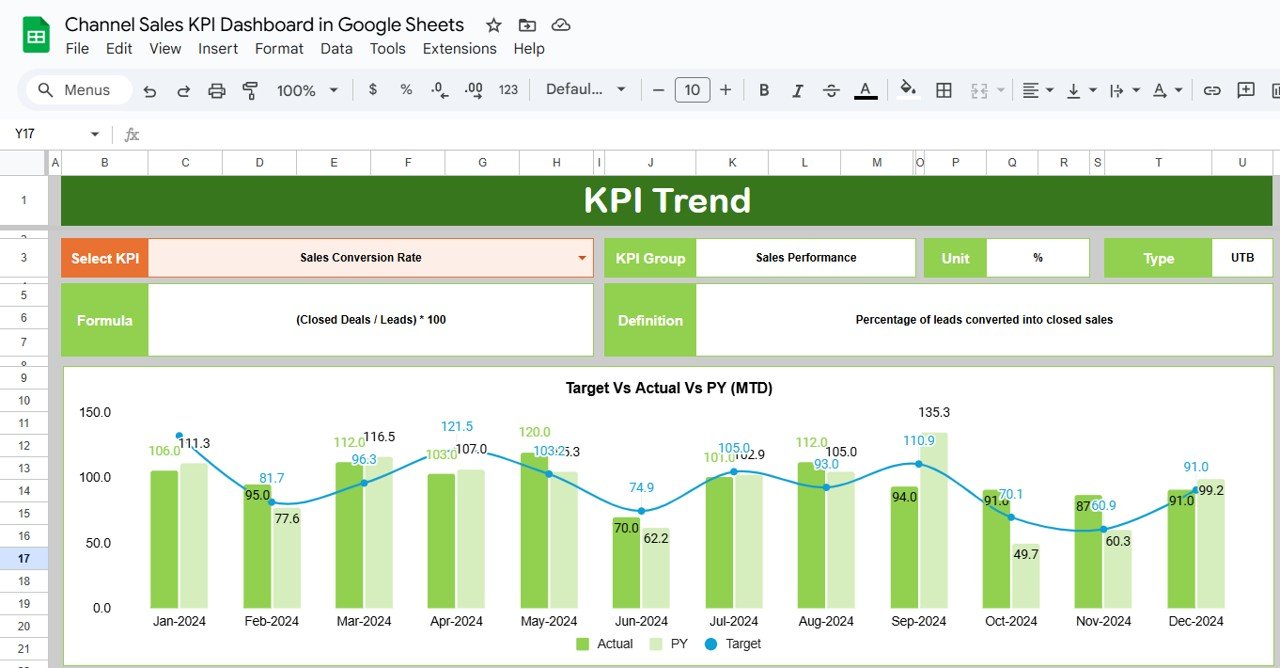
📈 2. KPI Trend Analysis for Deep Insights
The KPI Trend Sheet allows you to select any KPI and view:
-
KPI Group
-
Unit
-
Type (UTB/LTB)
-
Formula
-
Definition
-
Trend chart showing month-wise changes
This helps you understand behavior patterns, identify seasonal dips, and plan corrective actions.
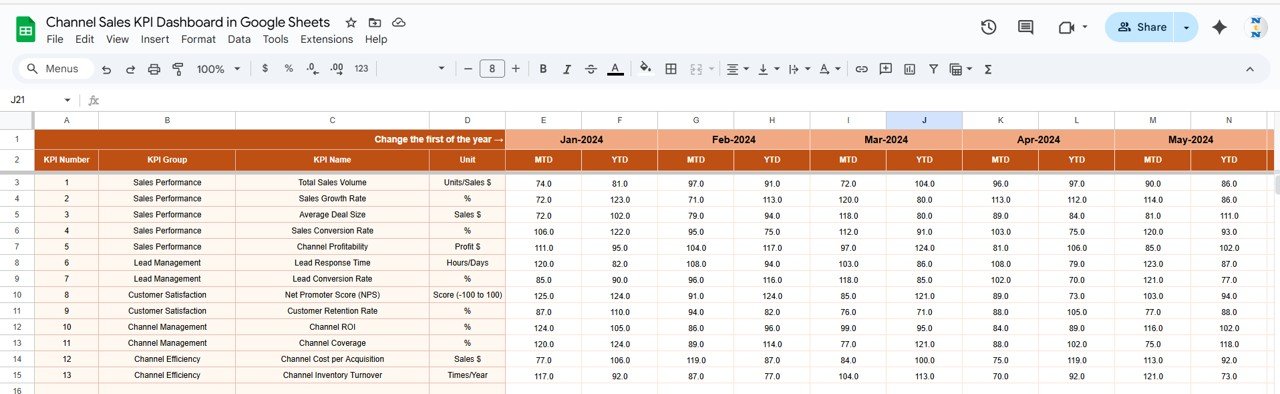
🧮 3. Actual Number Sheet for Real Performance
Enter MTD and YTD actual values here. When you update the starting month (Cell E1), all related columns refresh automatically.
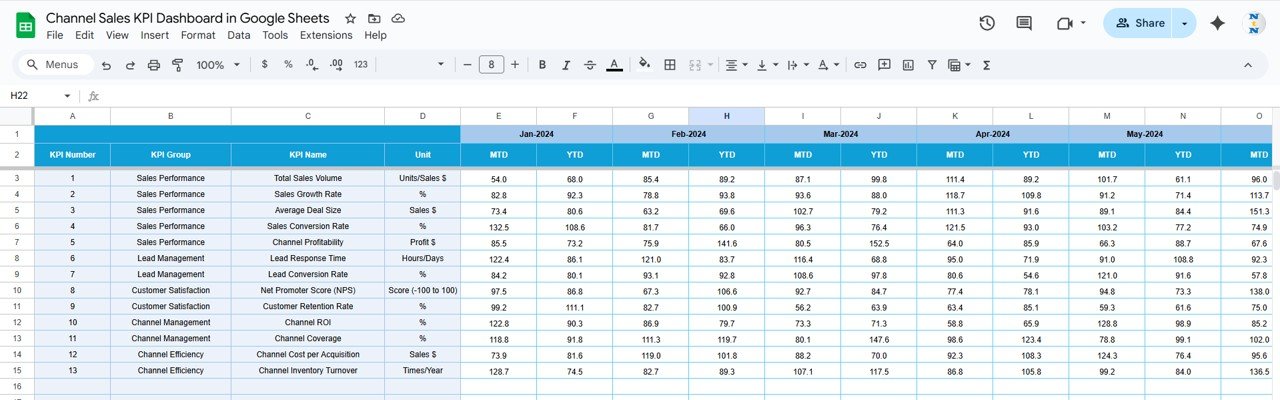
🎯 4. Target Sheet to Set Goals
Enter monthly and yearly targets for each KPI. These values help assess performance gaps and forecast future results.
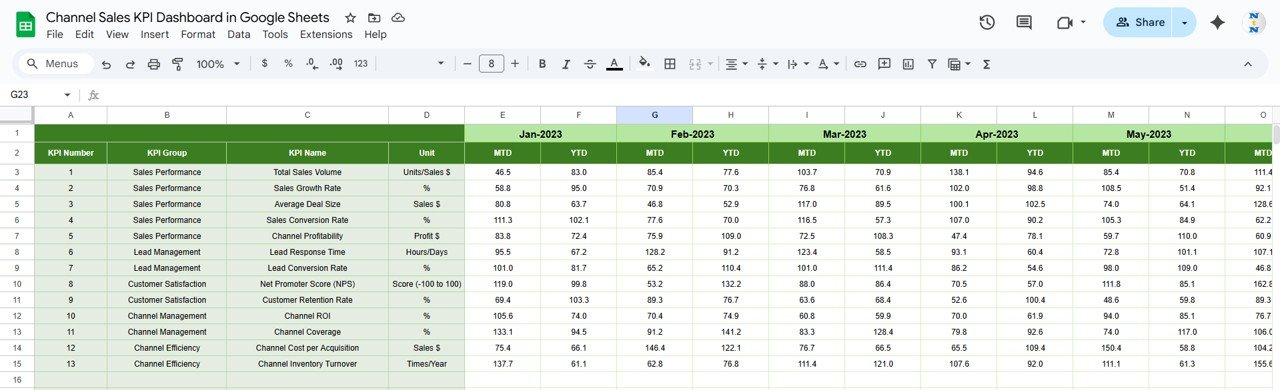
📅 5. Previous Year Sheet for YoY Analysis
Store last year’s numbers to compare YoY improvement. This helps measure long-term channel growth and identify consistent performers.
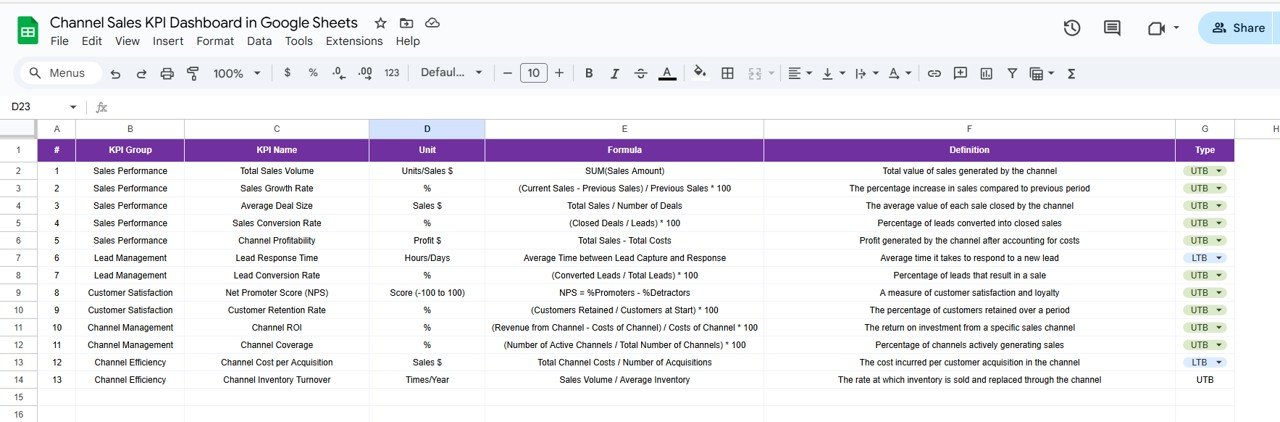
📘 6. KPI Definition Sheet for Clarity
Includes all KPI definitions, formulas, groups, units, and types. This ensures consistent understanding across sales teams.
📦 What’s Inside the Channel Sales KPI Dashboard in Google Sheets
📊 Dashboard Sheet – Main Sales Performance View
This sheet visually summarizes channel performance through automated indicators and comparisons. Users can instantly see:
-
Revenue growth
-
Target achievement
-
Partner contribution
-
Conversion success
-
Inventory movement
Everything updates instantly with month selection.
📈 KPI Trend Sheet – KPI-Level Analytics
Analyze individual KPI trends, understand formula logic, and evaluate performance month-by-month.
🧮 Actual Number Sheet – Performance Data Entry
Enter current KPI values here to keep the dashboard accurate and up to date.
🎯 Target Sheet – Goal Management
Stores target values for goal setting, forecasting, and performance comparison.
📅 Previous Year Sheet – Historical Benchmarking
Helps analyze year-over-year changes and set realistic expectations.
📘 KPI Definition Sheet – Complete KPI Dictionary
Provides clarity for all team members and ensures consistent reporting.
🛠️ How to Use the Channel Sales KPI Dashboard in Google Sheets
1️⃣ Update Actual Values Monthly
Add real KPI numbers to the Actual sheet for accurate automated reporting.
2️⃣ Review Dashboard Insights
Use the dashboard sheet to evaluate performance and identify improvement areas.
3️⃣ Track KPI Trends
Use the Trend Sheet to understand how KPIs behave throughout the year.
4️⃣ Compare Against Targets and PY Data
Analyze Target vs Actual and PY vs Actual to evaluate efficiency.
5️⃣ Adjust Sales Strategy
Optimize partner contribution, promotions, inventory, and conversion funnels based on insights.
🎯 Who Can Benefit from This Dashboard?
🏢 Sales Managers & Channel Leaders
Track revenue, partner activity, and growth trends.
📊 Distributors & Resellers
Monitor performance and identify improvement opportunities.
📈 Marketing & Strategy Teams
Understand contribution levels and regional performance.
💼 Business Owners & Directors
Get a clear picture of channel profitability and efficiency.
👥 Cross-Functional Teams
Finance, operations, and supply chain teams benefit from organized sales reporting.


Reviews
There are no reviews yet.