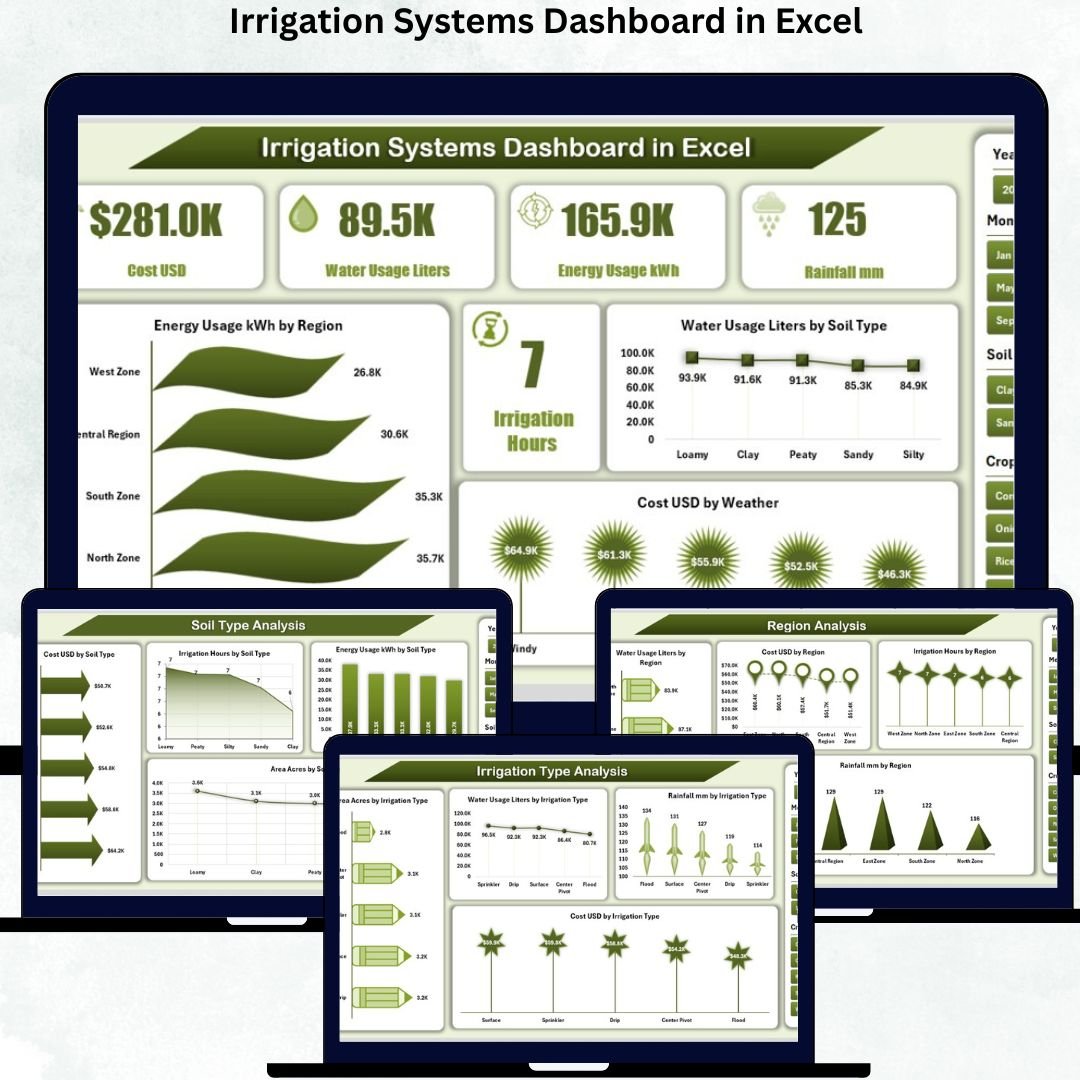
Managing irrigation efficiently is essential for improving crop performance, reducing water waste, and controlling operational costs 🌱💧. But when data is scattered across worksheets, field logs, soil tests, rainfall reports, and equipment records, it becomes nearly impossible to analyze performance accurately. That’s where the Irrigation Systems Dashboard in Excel becomes a game-changer.
This dashboard brings all your irrigation insights into one clean, interactive, and easy-to-use Excel file. With automated visuals, slicers, charts, and smart calculations, it helps farmers, irrigation managers, agricultural officers, and sustainability teams make confident decisions. Whether you’re tracking water usage, energy consumption, cost behavior, or soil and region performance, this dashboard gives you complete clarity—without any complicated software.
🔥 Key Features of the Irrigation Systems Dashboard in Excel
-
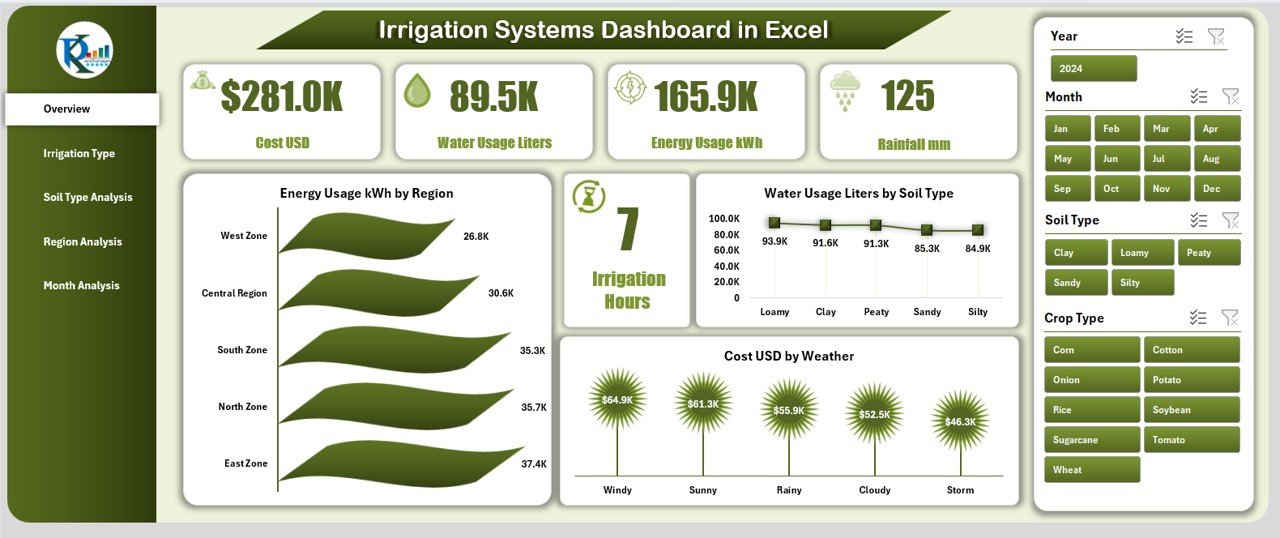
📊 Overview Page – View total water usage, energy consumption, irrigation hours, rainfall, and total cost through cards and clear charts.
-
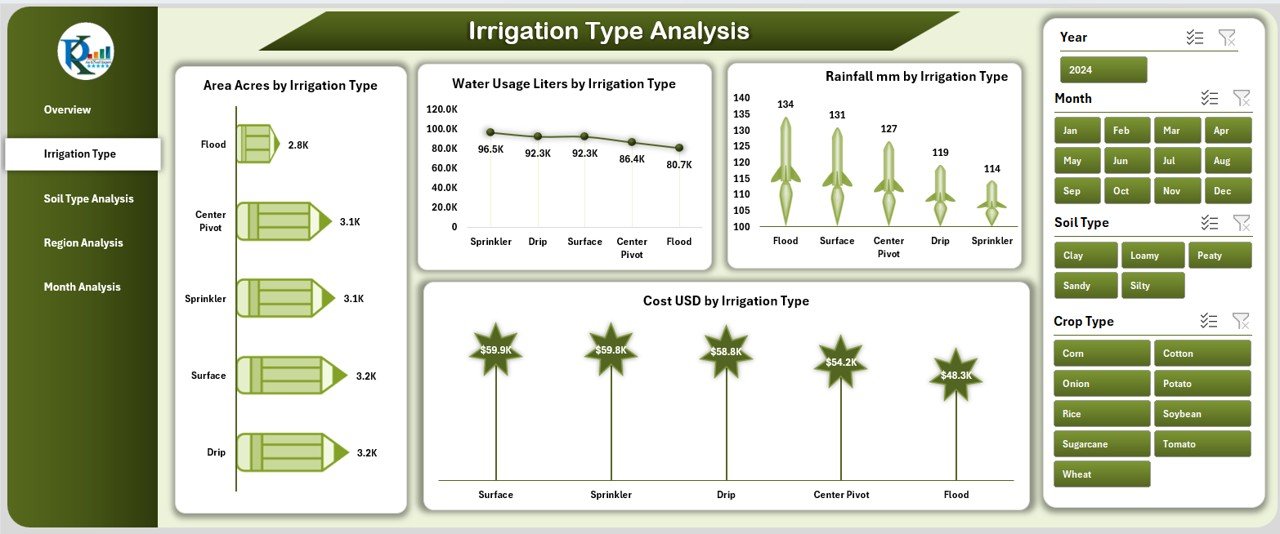
🚰 Irrigation Type Analysis – Compare drip, sprinkler, flood, and other irrigation systems to determine the most efficient method.
-
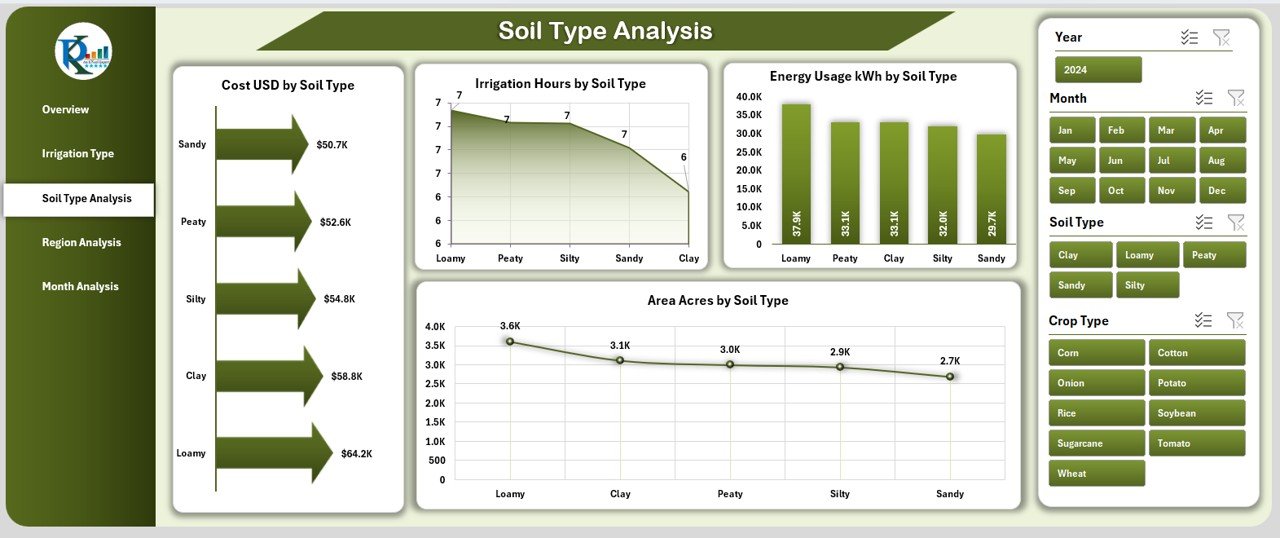
🌱 Soil Type Analysis – Understand how sandy, loamy, clay, and silt soils behave based on water usage, irrigation hours, and energy consumption.
-
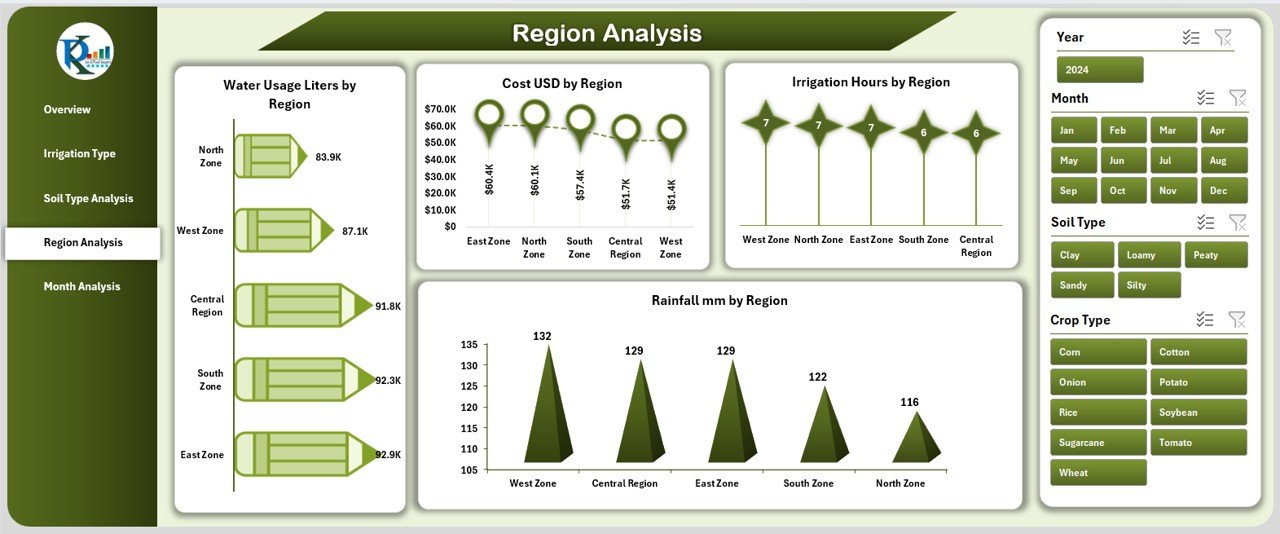
🌍 Region Analysis – Track regional irrigation patterns, cost differences, rainfall behavior, and performance variations.
-
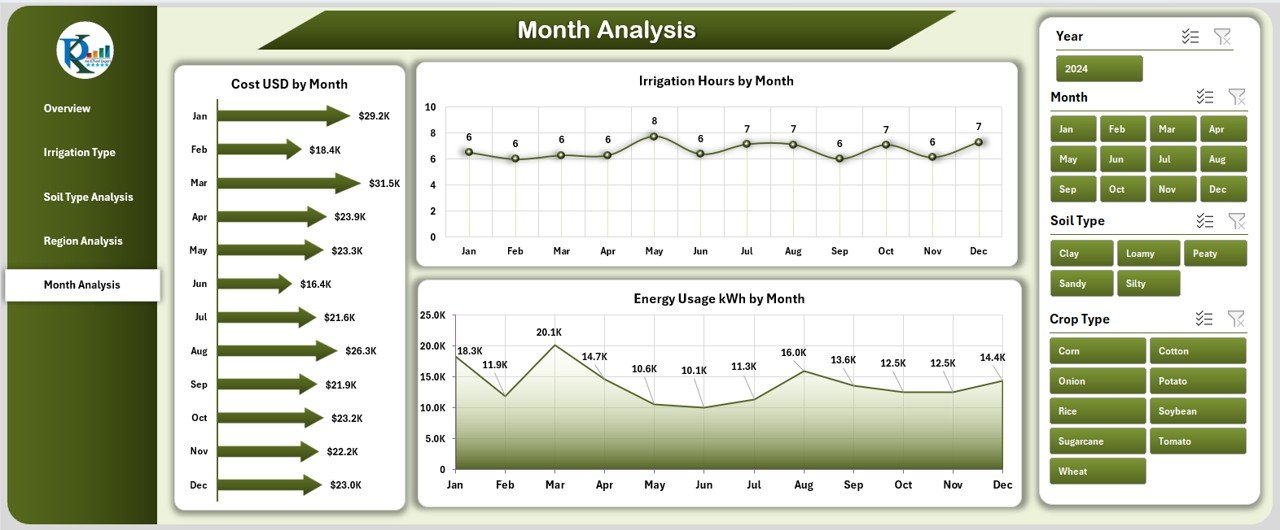
📅 Month Analysis – Identify seasonal patterns in cost, energy usage, months of high water demand, and irrigation schedules.
-
⚡ Real-Time Interactive Visuals – Modify the data sheet, refresh the file, and all visuals update automatically.
-
💼 User-Friendly and Ready to Use – Ideal for farmers, landscape teams, consultants, researchers, and sustainability departments.
📂 What’s Inside the Irrigation Systems Dashboard
-
Overview Page – 5 KPI cards & 4 major charts covering water usage, rainfall, cost, and energy performance.
-
Irrigation Type Analysis Page – Compare area coverage, rainfall impact, cost, and water usage by irrigation method.
-
Soil Type Analysis Page – Understand how soil structure affects irrigation hours, energy consumption, and water demand.
-
Region Analysis Page – Analyze cost, rainfall, irrigation hours, and water usage across regions.
-
Month Analysis Page – Track monthly patterns, plan irrigation schedules, and forecast future demand.
-
Support Sheet – Clean, structured data for accurate reporting and automatic chart updates.
🛠️ How to Use the Irrigation Systems Dashboard
-
Update your data sheet 💧 – Add water, cost, rainfall, soil, and region data.
-
Refresh the dashboard 🔄 – Charts and slicers update automatically.
-
Use slicers & filters 🎯 – Compare irrigation types, soil categories, months, and regions instantly.
-
Study patterns 🔍 – Identify high-cost zones, heavy water-using areas, and soil behaviors.
-
Make smarter decisions ⚡ – Reduce waste, control cost, improve efficiency, and plan irrigation schedules confidently.
🌟 Who Can Benefit from This Dashboard
-
Farmers & Field Supervisors
-
Irrigation Managers & Property Maintenance Teams
-
Agricultural Officers & Government Departments
-
Research Institutes & University Students
-
Landscape Maintenance Teams
-
Sustainability Analysts and Water Conservation Experts
This dashboard provides valuable insights to anyone managing irrigation systems across fields, landscapes, or large agricultural operations.


Reviews
There are no reviews yet.