
In the world of taxation, every deadline matters. Whether you are handling tax filings, audits, notices, assessments, or reconciliation work, accuracy and speed are crucial. But with increasing workload, strict regulations, and complex compliance duties, tax teams often find themselves buried under dozens of spreadsheets. That’s exactly where the Tax Advisory KPI Dashboard in Excel becomes a game-changer.Tax Advisory KPI Dashboard in Excel.
This powerful, ready-to-use dashboard transforms complicated tax data into clean, visual insights. It tracks MTD, YTD, Actuals, Targets, Previous Year data, performance comparisons, and trend movements—all in one automated Excel file. Designed for accountants, tax consultants, auditors, finance professionals, and advisory teams, this dashboard helps you manage reporting with confidence and zero stress.
If your tax department struggles with manual reporting, inconsistent data, missed deadlines, or unclear performance visibility—this dashboard solves all of it instantly. With structured worksheets, dynamic selections, and smart formulas, it gives complete clarity on your tax operations at a glance.

Key Features of the Tax Advisory KPI Dashboard in Excel ✨
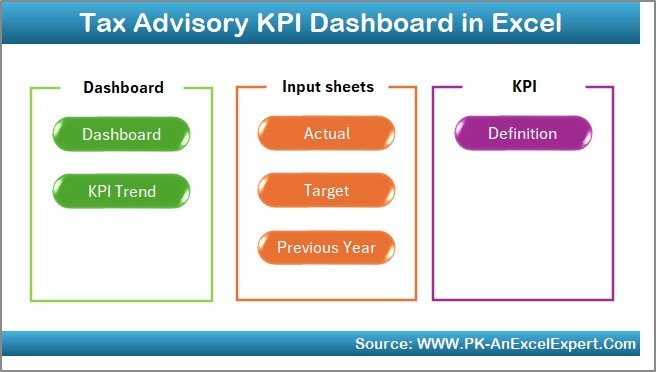
This dashboard includes 7 structured worksheets, each designed to simplify reporting and improve decision-making.
🔹 Summary Page – Easy Navigation
A clean index page containing six clickable buttons that instantly take you to any sheet. No scrolling. No confusion. Just one-click navigation for a smooth user experience.
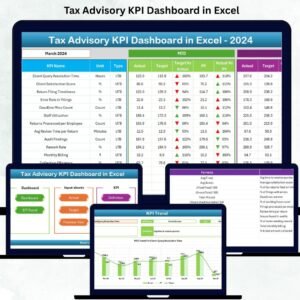
🔹 Dashboard Page – Full KPI Visibility
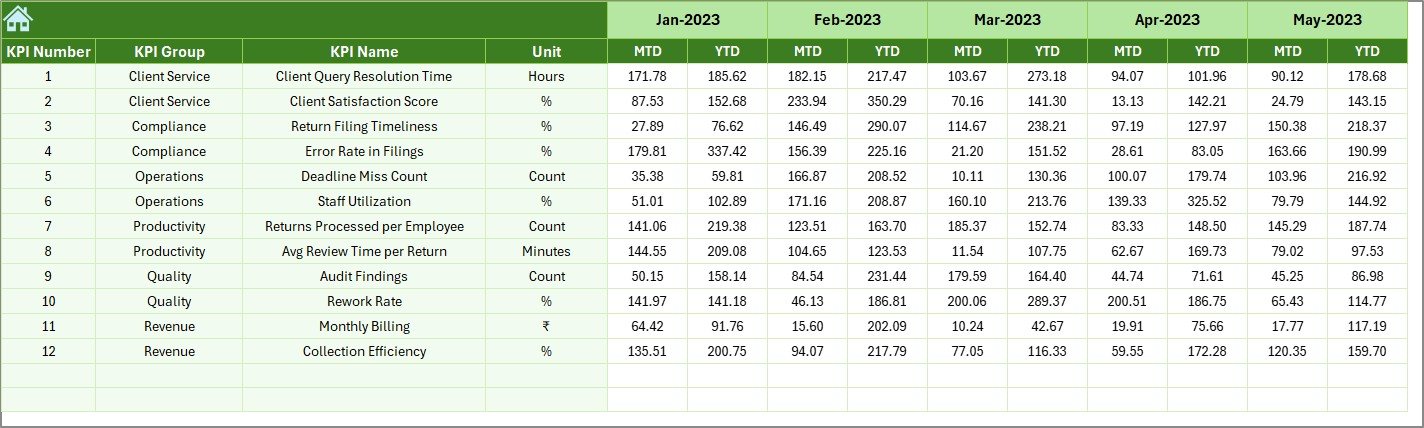
This is the main hub of performance insights. With a month selector in cell D3, you can instantly view:
-
MTD Actual vs Target
-
MTD Actual vs Previous Year
-
YTD Actual vs Target
-
YTD Actual vs Previous Year
-
Conditional arrows showing upward/downward performance trends
Everything updates automatically.
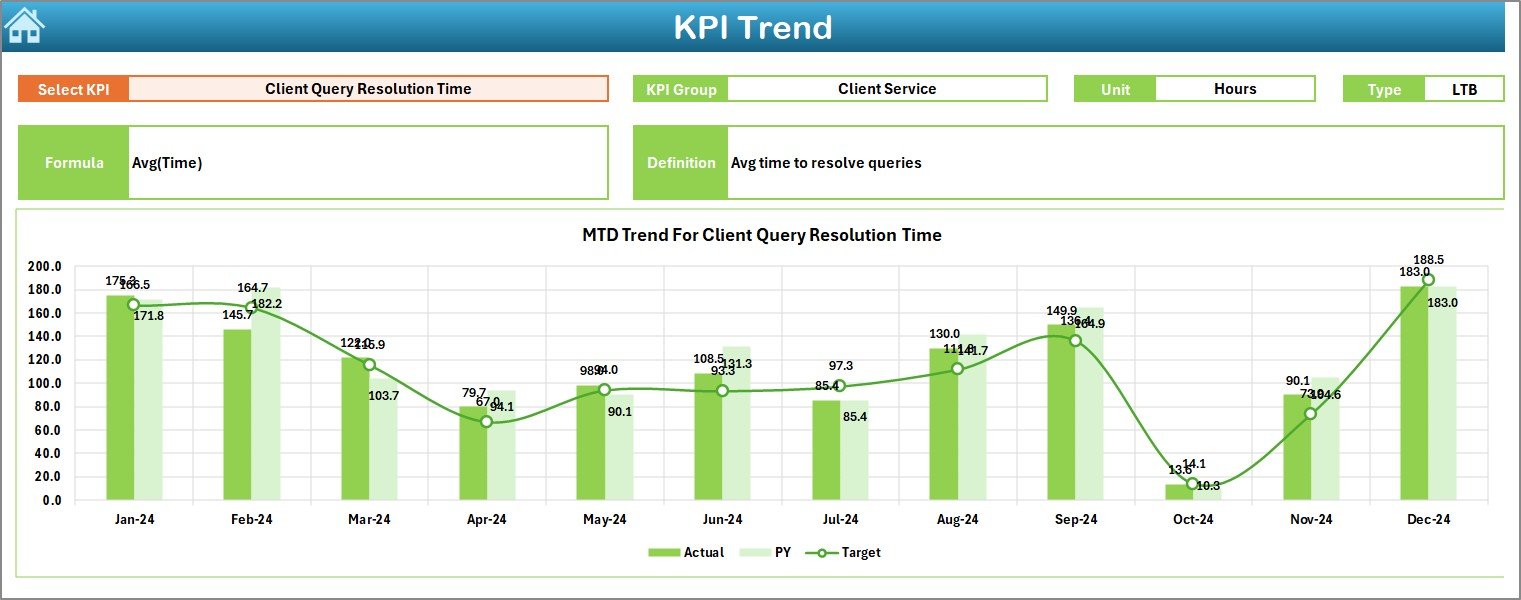
🔹 Trend Sheet – Monthly Performance Movement
A dedicated page to analyze how KPIs behave across months. Choose any KPI and instantly see:
-
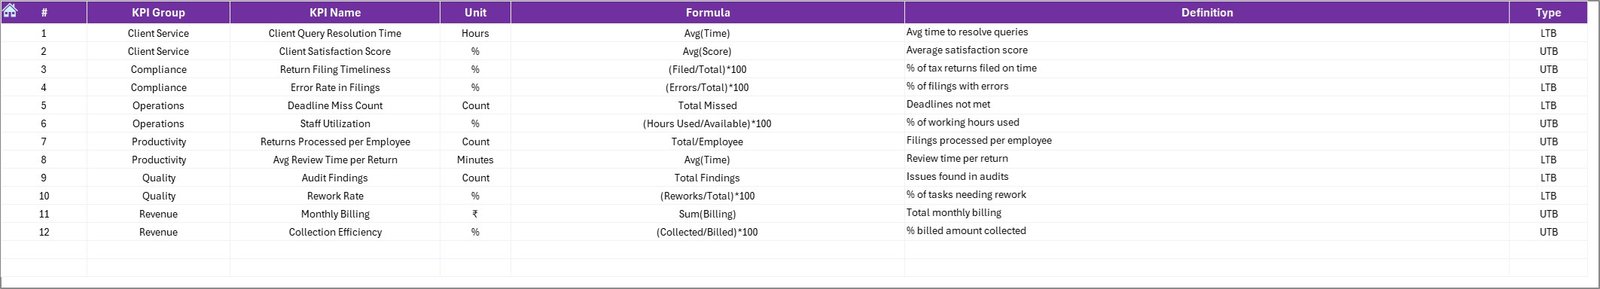
KPI Group
-
Unit
-
KPI Type (UTB / LTB)
-
Formula
-
Definition
-
MTD & YTD Trend Line Charts
It’s your go-to page for understanding patterns and forecasting.
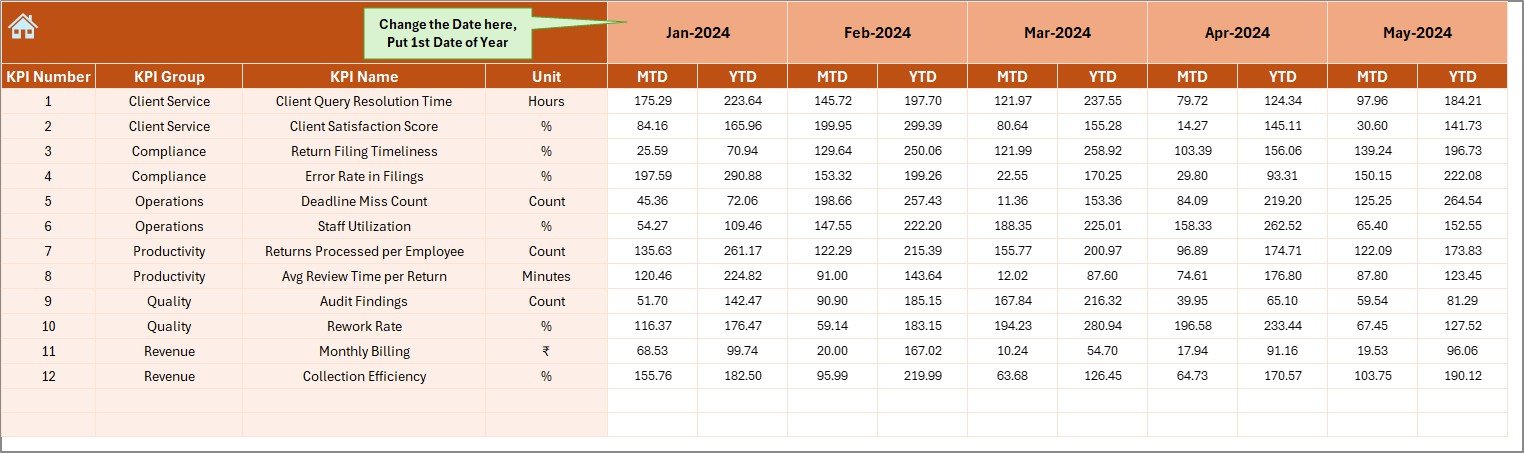
🔹 Actual Input Sheet – Enter Monthly Data Easily
Simply input your monthly MTD and YTD numbers. The entire dashboard refreshes instantly. You can even set the starting month of your financial year (Jan–Dec, Apr–Mar, or custom).
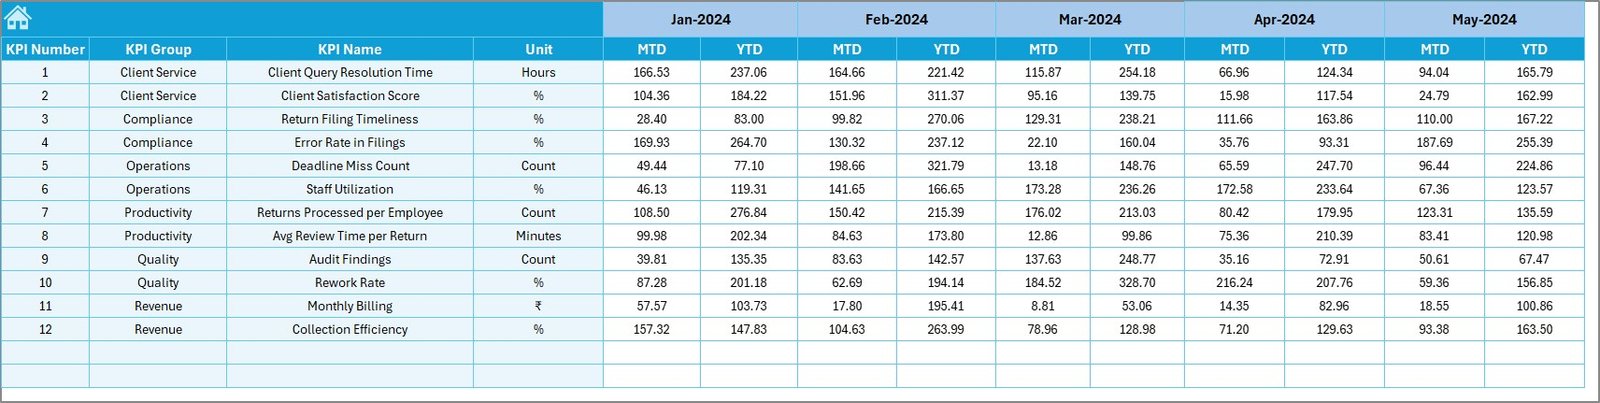
🔹 Target Sheet – Define Monthly Goals
Set monthly performance targets for each KPI. Perfect for planning, forecasting, and improving accountability across the tax team.
🔹 Previous Year Sheet – Compare Performance at a Glance
Enter last year’s numbers to instantly see growth or decline. Great for year-on-year tracking.
🔹 KPI Definition Sheet – Your KPI Master File
Stores KPI name, group, unit, formula, and definition. Selected KPI details automatically appear on the Trend Sheet.
What’s Inside the Tax Advisory KPI Dashboard in Excel 📂
This dashboard includes everything you need for professional-level reporting:
-
7 fully automated worksheets
-
MTD & YTD comparisons
-
Monthly trend analysis
-
Pre-loaded KPI structure
-
Drop-down enabled visual dashboard
-
Conditional formatting with arrows
-
Easy-to-edit formulas
-
Fully customizable layout
-
KPI definitions database
-
One-click navigation panel
Whether you have 10 KPIs or 100, this file can scale easily for your team.
How to Use the Tax Advisory KPI Dashboard in Excel 🧾
Using this dashboard is extremely simple—even for beginners.
-
Enter MTD & YTD actuals in the Actual Input Sheet
-
Add monthly targets in the Target Sheet
-
Update previous year data
-
Go to the Dashboard Page to view performance
-
Use the Trend Sheet to analyze monthly movement
-
Refer to KPI Definitions whenever needed
-
Repeat monthly—or weekly—for real-time insights
That’s it! Your dashboard is up and running.
Who Can Benefit from This Tax Advisory KPI Dashboard? 👥
This template is perfect for:
-
Tax consultants
-
Tax managers
-
Chartered accountants
-
Audit teams
-
Corporate finance teams
-
Compliance officers
-
Advisory firms
-
Freelance tax professionals,Tax Advisory KPI Dashboard in Excel
Whether you manage clients, teams, filings, or reporting—this dashboard helps you make smarter, faster decisions.
### Click here to read the Detailed blog post
Watch the step-by-step video tutorial:


Reviews
There are no reviews yet.