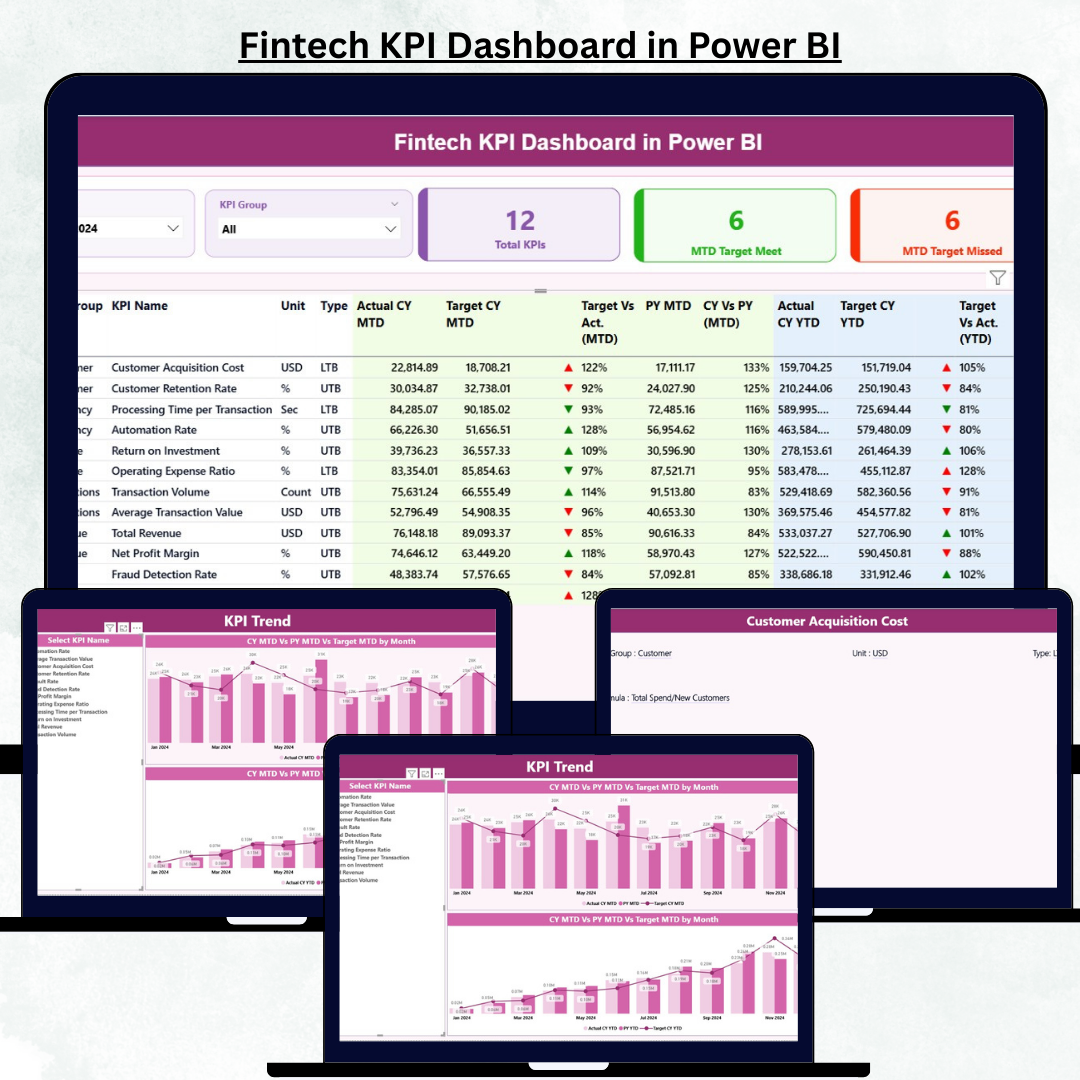
The fintech industry moves at lightning speed, and every decision counts. Whether you are managing revenue, customer growth, compliance, lending, or transactions, you need real-time insights to make fast and accurate decisions. But in most fintech organizations, data is scattered across multiple tools and spreadsheets—making reporting slow, confusing, and time-consuming.Fintech KPI Dashboard in Power BI.
This Fintech KPI Dashboard in Power BI is designed to solve that exact problem. It brings all your financial, operational, customer, and compliance KPIs into a single, interactive, and ready-to-use reporting system. With this dashboard, teams can track monthly and yearly performance, compare targets, monitor trends, and uncover risks within seconds.
Built with clean visuals, slicers, and drill-through functionality, this dashboard helps fintech teams work smarter, faster, and with complete confidence.
✨ Key Features of the Fintech KPI Dashboard in Power BI
1. Complete KPI Coverage for Fintech 📊
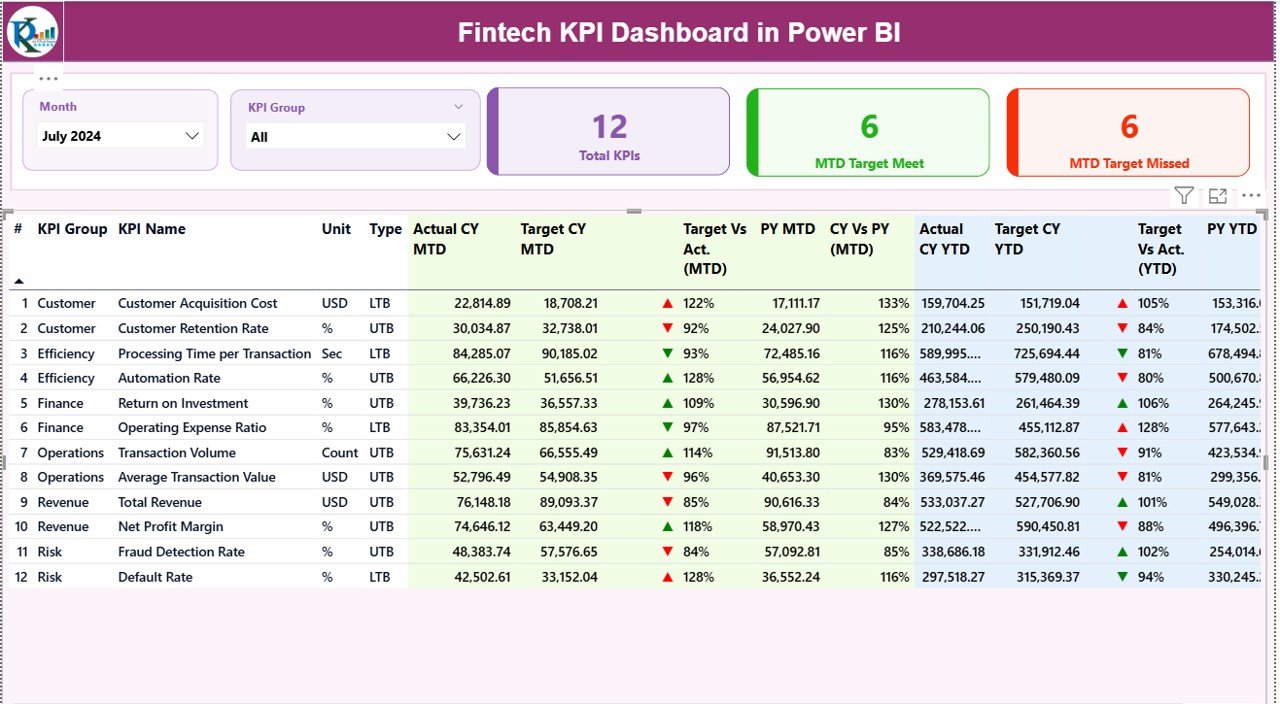
This dashboard tracks all essential fintech metrics, including revenue, lending, customer activity, fraud score, compliance, transaction success rate, wallet loads, NPA percentage, uptime, API failures, and more. Every KPI displays both MTD (Month-to-Date) and YTD (Year-to-Date) insights for clear comparisons.
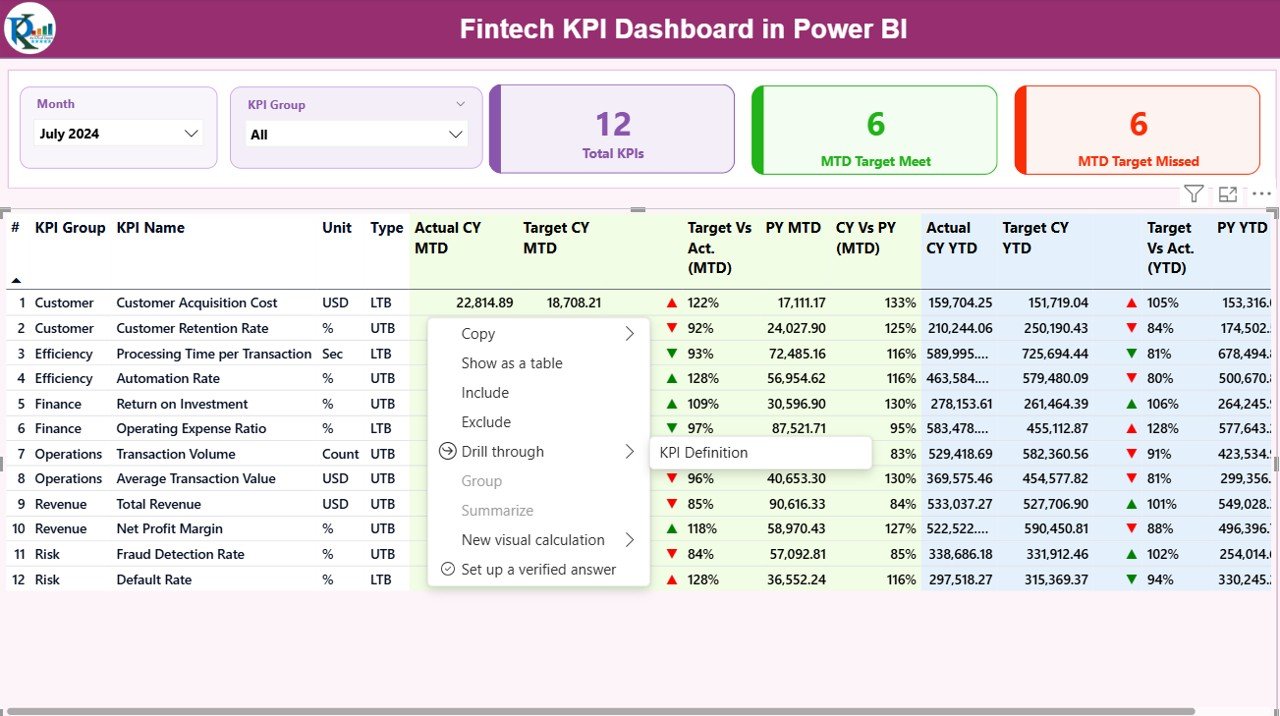
2. Ready-to-Use Summary Page 🏁
The Summary Page is your main control center. It contains intuitive slicers like Month and KPI Group, empowering users to instantly filter and analyze performance. High-level KPI cards show the Total KPI Count, MTD Target Met, and MTD Target Missed—giving you an immediate snapshot of business health.
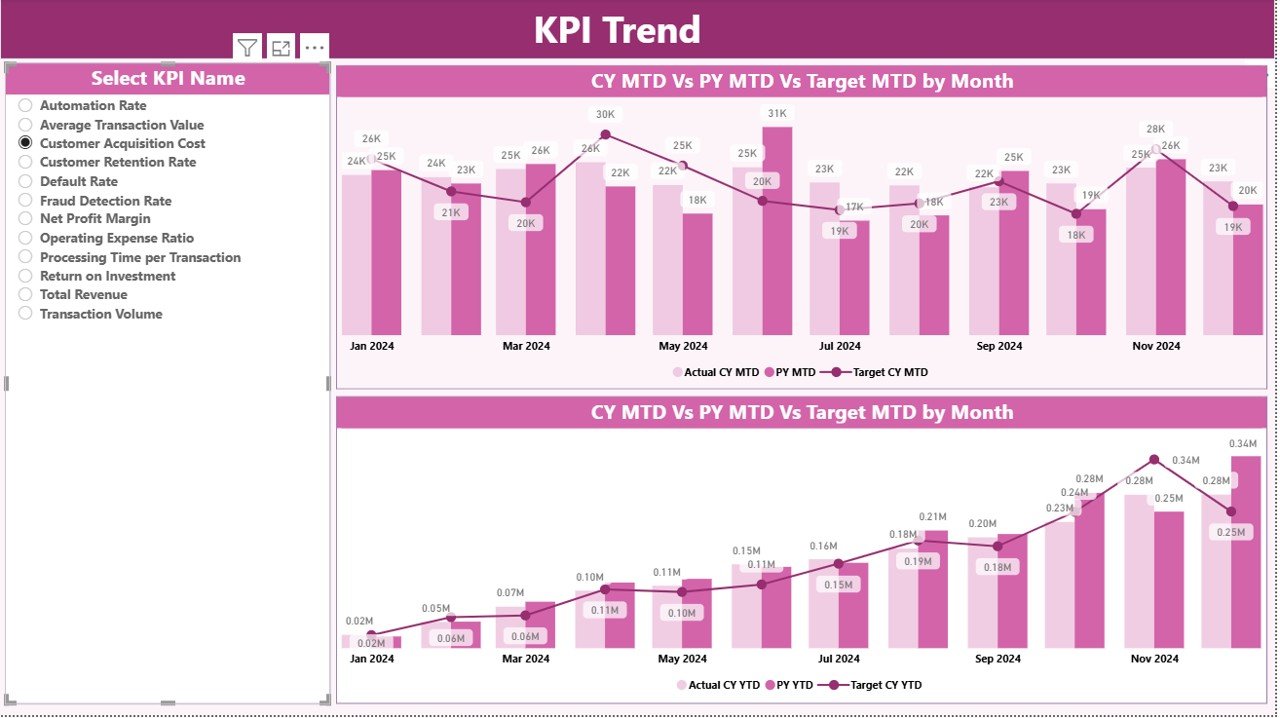
3. Trend Analysis with Combo Charts 📈
The Trend Page provides powerful visual trend analysis. With combo charts showing Actual vs Target for both MTD and YTD, teams can easily identify seasonality, performance gaps, and long-term growth movements.
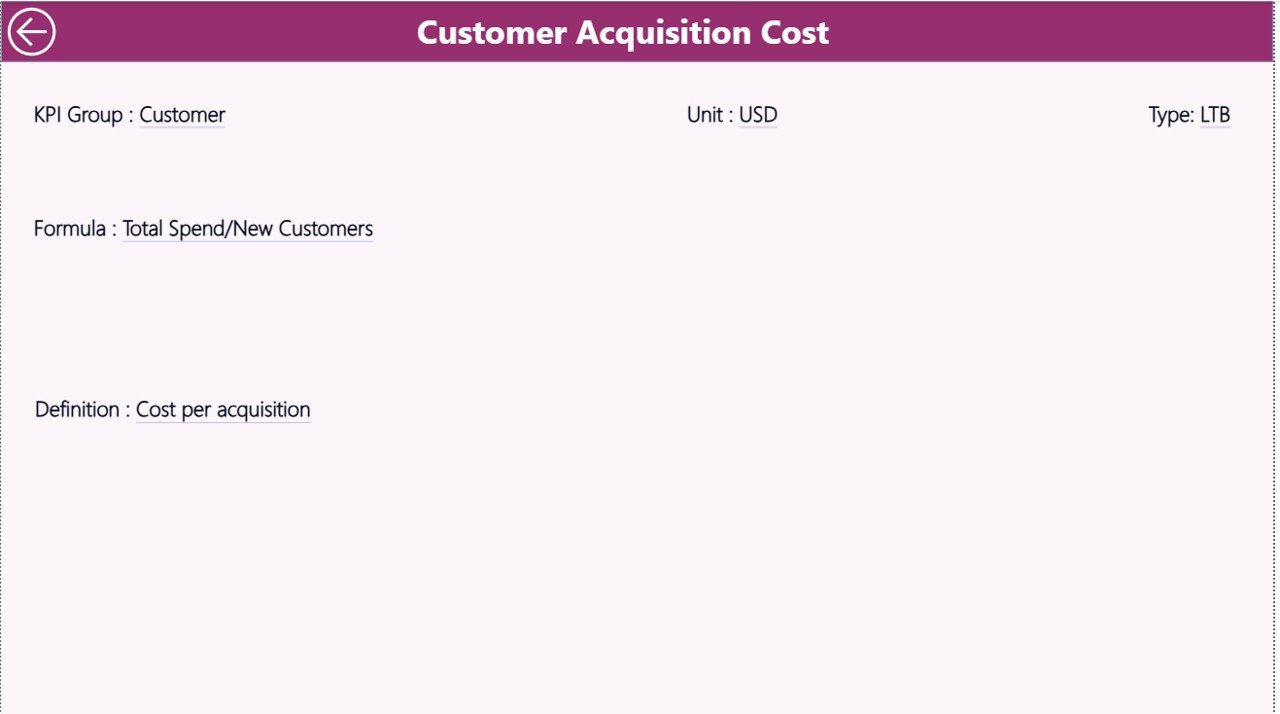
4. Drill-Through KPI Definition Page 🔍
A hidden but powerful feature! Users can right-click any KPI and view its complete definition—KPI Name, Formula, Unit, Type (LTB/UTB), and more. This ensures clarity, transparency, and strong documentation practices.
5. Excel Input Sheets for Easy Updates 📥
All data comes from a structured Excel file, making updates simple even for non-technical users. You can easily fill Actual, Target, and KPI Definition sheets and refresh the dashboard in one click.
📦 What’s Inside the Fintech KPI Dashboard in Power BI
Here’s everything included in the product:
-
Power BI Dashboard (.PBIX file)
-
Summary Page with slicers, KPI cards & visual tables
-
Trend Analysis Page with combo line charts
-
KPI Definition drill-through page
-
Excel data source with 3 structured sheets:
-
Input_Actual
-
Input_Target
-
KPI Definition
-
-
Pre-built KPI groups for Revenue, Lending, Compliance, Operations, Risk & Customer
-
Fully editable visuals, DAX formulas & formatting
-
Clean UI with icons, colors & tooltips
You get a complete, plug-and-play performance monitoring system for your fintech business.
🛠️ How to Use the Fintech KPI Dashboard in Power BI
Using this dashboard is extremely simple:
1. Update the Excel Input Sheets
Fill in Actual and Target values for each KPI on a monthly basis.
2. Refresh Power BI
Open the PBIX file → click Refresh → all numbers update instantly.
3. Use Slicers for Deep Analysis
Filter by Month or KPI Group to explore focused insights.
4. Check Monthly & Yearly Trends
Use the Trend Page to analyze performance patterns and identify growth areas.
5. Drill-Through for Definitions
Right-click a KPI → View detailed KPI information.
6. Use the Dashboard Daily
Perfect for daily standups, weekly reviews, or monthly performance meetings.
🎯 Who Can Benefit from This Fintech KPI Dashboard?
This dashboard is designed for anyone in fintech who needs clarity, speed, and accuracy in reporting:
-
Fintech Startups
-
Digital Lending Companies
-
Neo Banks & Mobile Wallet Providers
-
Payment Gateways & PSPs
-
Risk & Compliance Teams
-
Operations & Transaction Monitoring Teams
-
Finance & Revenue Teams
-
Product Managers
-
Data Analysts & BI Teams
If your team manages transactions, customers, revenue, compliance, or risk, this dashboard is a game-changer.
### Click here to read the Detailed blog post
Watch the step-by-step video tutorial:


Reviews
There are no reviews yet.