Accurate time tracking is essential for every organization—whether you want to improve productivity, manage projects efficiently, reduce overtime costs, or strengthen performance monitoring. But many businesses still depend on scattered spreadsheets, manual time reports, and outdated tools that fail to show real-time insights. This results in delays, errors, inefficiencies, and poor decision-making. That’s where the Time Tracking Dashboard in Power BI becomes a complete game-changer.
This ready-to-use dashboard brings all time-related information—project hours, billable vs non-billable work, overtime, revenue, task rejection analysis, and department-level performance—into one dynamic and interactive reporting system. Designed for project-based companies, consulting firms, IT services, HR teams, and business leaders, the dashboard helps you understand resource utilization instantly and take smarter decisions.
Built using modern Power BI visuals, slicers, trend lines, and dynamic insights, this dashboard refreshes instantly when new data is loaded. The result? Managers no longer struggle to compile reports manually. Instead, they can analyze trends, identify inefficiencies, monitor performance, and improve revenue outcomes within minutes.
🚀 Key Features of the Time Tracking Dashboard in Power BI
📊 ✔ Real-Time Time Utilization Insights
Track billable hours, non-billable hours, rejected tasks, overtime, and revenue with up-to-date visuals.
🎯 ✔ Smart KPI Cards
Instantly view total revenue, profit margin, pending tasks, rejected tasks, and top revenue-generating clients.
📈 ✔ Dynamic Trend Charts
Analyze monthly patterns with revenue trends, rejection percentage charts, and bill rate (USD/hr) trends.
🧭 ✔ Multi-Level Analysis Pages
Explore insights across departments, managers, roles, projects, clients, and time periods.
⚡ ✔ Interactive Slicers
Filter data by project, client, department, manager, role, task category, or time range for deeper insights.
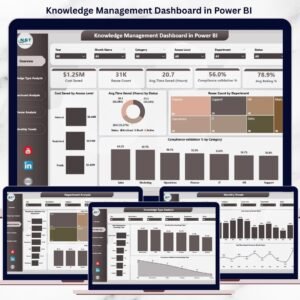
📁 ✔ Five Comprehensive Dashboard Pages
Includes Overview, Department Analysis, Manager Analysis, Role Analysis, and Monthly Trends.
📦 What’s Inside the Time Tracking Dashboard in Power BI
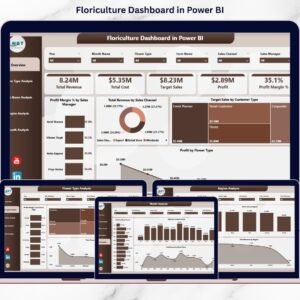
⭐ 1. Overview Page
Your complete business summary at a glance—updated instantly through slicers.
Includes:
✔ KPI cards
✔ Revenue charts
✔ Profit margin analytics
✔ Pending tasks
✔ Rejected tasks by category
✔ Revenue by client
This page gives leaders a complete snapshot of productivity, efficiency, and business performance.
⭐ 2. Department Analysis Page
Understand time performance and revenue across departments.
Includes:
✔ Margin by department
✔ Pending tasks
✔ Revenue comparisons
Perfect for identifying underperforming departments, workload distribution issues, and cost inefficiencies.
⭐ 3. Manager Analysis Page
Evaluate manager-wise performance with clarity.
Includes:
✔ Rejected tasks
✔ Billable hours
✔ Profit margin by manager
This page helps identify which managers deliver the most revenue, where performance gaps exist, and how workloads can be balanced.
⭐ 4. Role Analysis Page
Compare performance across job roles and skill categories.
Includes:
✔ Pending %
✔ Overtime hours
✔ Revenue generated by role
This helps HR, operations, and leadership improve staffing, training, and hiring strategies.
⭐ 5. Monthly Trends Page
Track performance patterns month-by-month.
Includes:
✔ Revenue trends
✔ Rejection % trends
✔ Bill rate trends
This page helps identify seasonal fluctuations, workload spikes, performance cycles, and quality concerns.
🧭 How to Use the Time Tracking Dashboard
🔹 Step 1: Load Your Data
Update your Excel/Power BI dataset with hours, revenue, roles, departments, rejections, and tasks.
🔹 Step 2: Use Slicers to Filter Insights
Choose any project, client, role, or department to see instant updates.
🔹 Step 3: Analyze KPI Cards
Review revenue, profit margin, pending tasks, and rejected tasks at a glance.
🔹 Step 4: Study Department & Manager Performance
Identify where your team excels and where support is required.
🔹 Step 5: Review Monthly Trends
Use trend visuals to predict performance, plan hiring, and optimize billing cycles.
This dashboard makes decision-making simple, fast, and data driven.
👥 Who Can Benefit from This Dashboard
💼 Project Managers & Team Leaders
Track performance, workload, and productivity.
🧮 Finance & Billing Teams
Analyze revenue, billable hours, and profitability.
🧑💻 IT & Consulting Companies
Monitor project hours, resource allocation, and monthly bill rates.
🏢 HR & Operations Teams
Evaluate overtime, role performance, and workforce trends.
📊 Business Leaders & CEOs
Gain a complete overview of organizational productivity and revenue growth.
This dashboard is built for performance-driven companies that want real-time clarity and better control over workload, cost, and productivity.


Reviews
There are no reviews yet.