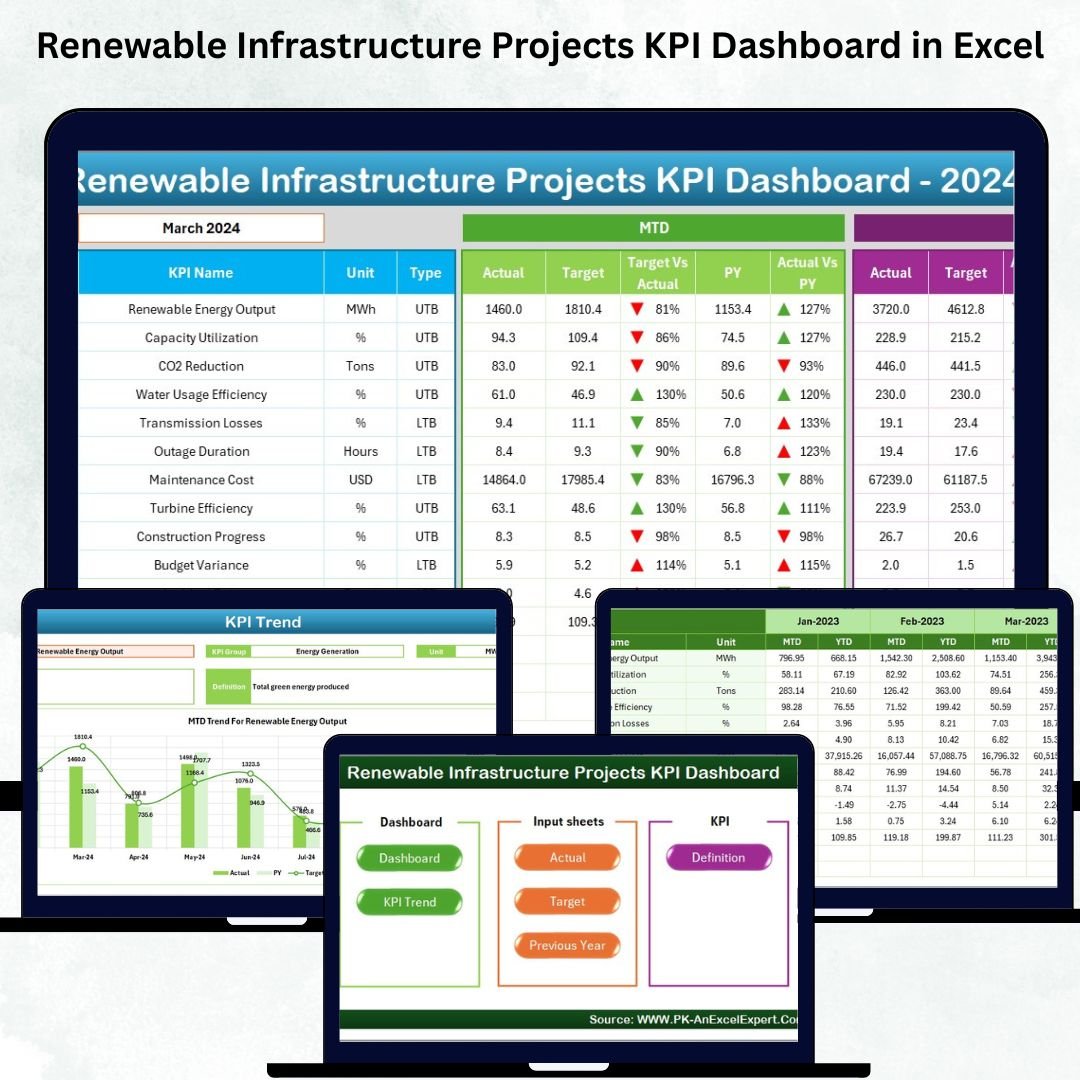
Renewable infrastructure projects grow rapidly as the world shifts toward clean energy, sustainability, and climate-focused development. But with large investments, strict deadlines, environmental standards, and multi-phase execution, these projects demand clear visibility and accurate performance monitoring. The Renewable Infrastructure Projects KPI Dashboard in Excel is designed exactly for that purpose — a smart, powerful, and ready-to-use performance management tool that gives complete control over your project KPIs.
This dashboard converts raw Excel data into meaningful insights. Whether you are tracking solar energy output, wind turbine efficiency, hydropower timelines, EV charging expansion, or green-building milestones, this dashboard helps you monitor monthly progress, evaluate year-to-date results, compare with targets, and analyze trends efficiently. Because it runs fully in Excel, no complex software or advanced BI skills are required.
⭐ Key Features of the Renewable Infrastructure KPI Dashboard in Excel
✨ 7 Organized Worksheets – Clear navigation for Dashboard, Trends, Actuals, Targets & Definitions
📊 MTD & YTD Performance Tracking – See monthly and yearly results instantly
📈 Trend Charts – Study Actual vs Target vs Previous Year trends
🎯 Target vs Actual KPIs – Identify performance gaps with arrow icons
📘 KPI Definition Page – Understand formulas, KPI types & descriptions
⚡ One-Click Month Selection – Change the month and the entire dashboard updates
🌱 Works for All Renewable Project Types – Solar, wind, hydro, geothermal & more
💼 Beginner-Friendly Excel Setup – No coding or complex tools required
This dashboard is the perfect solution for any renewable project team that needs clarity, accountability, and fast decision-making.
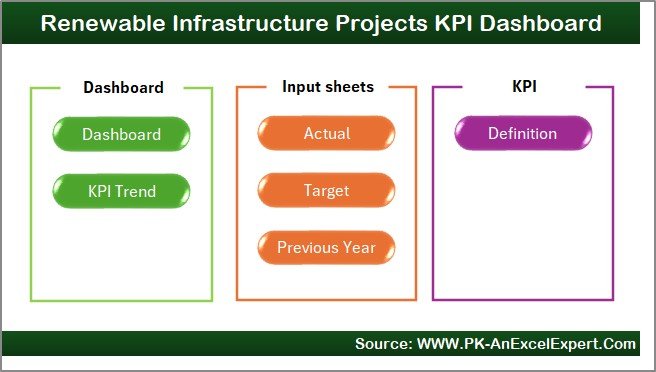
📦 What’s Inside the Renewable Infrastructure Projects KPI Dashboard
This dashboard includes seven powerful worksheets; each designed for smooth project monitoring.
🔹 1. Home Sheet – Navigation Made Simple
The Home Sheet includes six clickable buttons:
-
Dashboard
-
KPI Trend
-
Actual Numbers
-
Target Numbers
-
Previous Year Numbers
-
KPI Definitions
This menu-style layout makes the file extremely easy to use for beginners and experts alike.
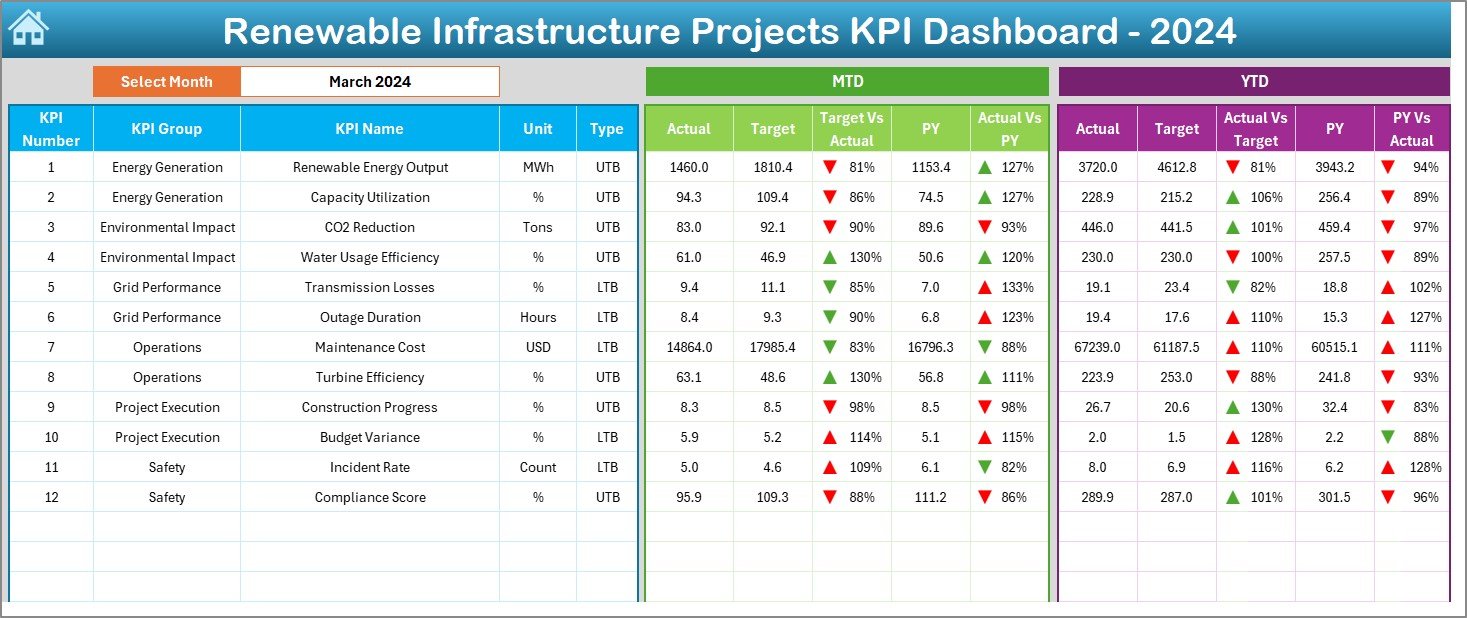
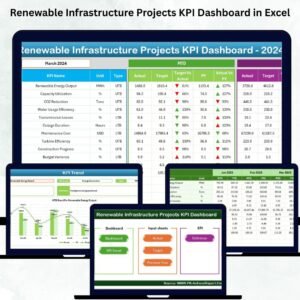
🔹 2. Dashboard Sheet – Your Main KPI Control Center
The Dashboard Sheet is the heart of the workbook. At cell D3, simply pick the month from the dropdown — the entire dashboard updates instantly.
The dashboard displays:
📅 MTD Analysis
-
MTD Actual
-
MTD Target
-
MTD Previous Year
-
Target vs Actual %
-
CY vs PY %
-
Arrow Icons (▲/▼) for quick status
📆 YTD Analysis
-
YTD Actual
-
YTD Target
-
YTD Previous Year
-
Target vs Actual %
-
CY vs PY %
This page gives a complete snapshot of renewable project performance — helping decision-makers track delays, evaluate progress, and stay aligned with project milestones.
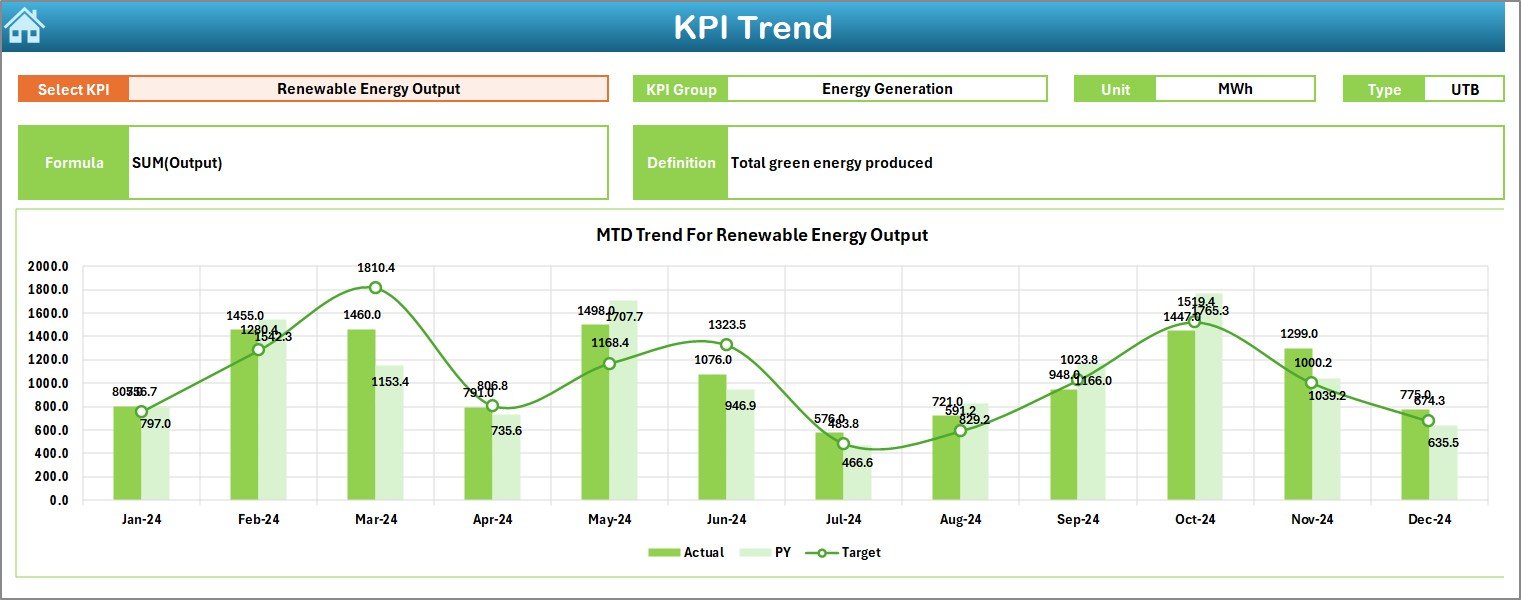
🔹 3. KPI Trend Sheet – Understand Performance Behavior
The KPI Trend sheet allows deep analysis of KPI movement.
At cell C3, select any KPI. The sheet displays:
-
KPI Group
-
KPI Unit
-
KPI Type (LTB / UTB)
-
KPI Formula
-
KPI Definition
Below that, two trend charts show:
📈 MTD Trend Chart – Actual vs Target vs PY
📉 YTD Trend Chart – Actual vs Target vs PY
These charts help you track:
-
Seasonal variations
-
Monthly fluctuations
-
Long-term improvements
-
Performance bottlenecks
Trend analysis is extremely important for renewable projects where weather, output, and progress often vary month to month.
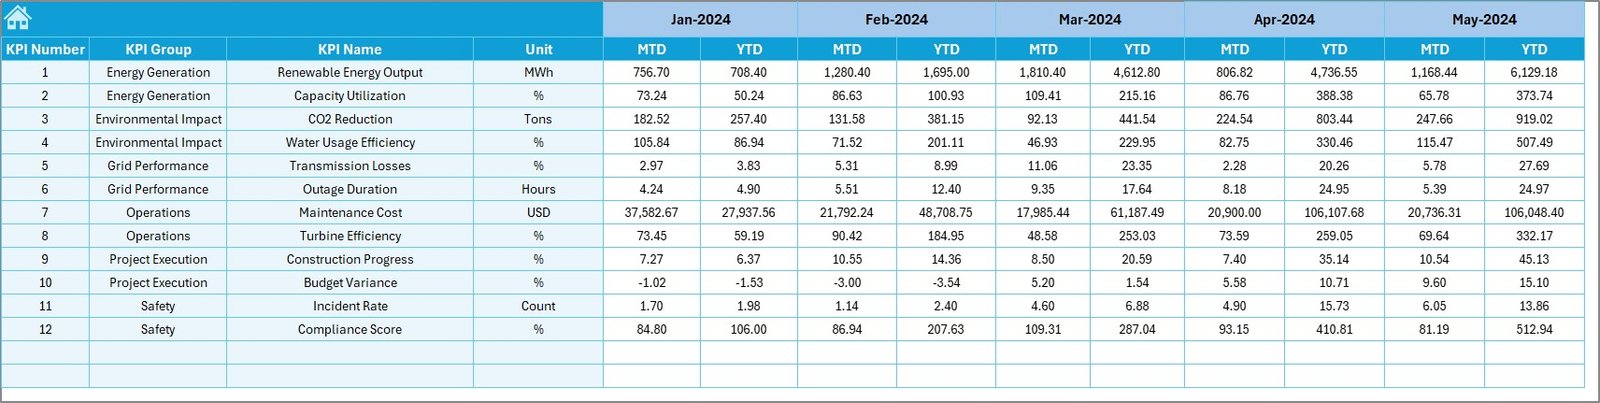
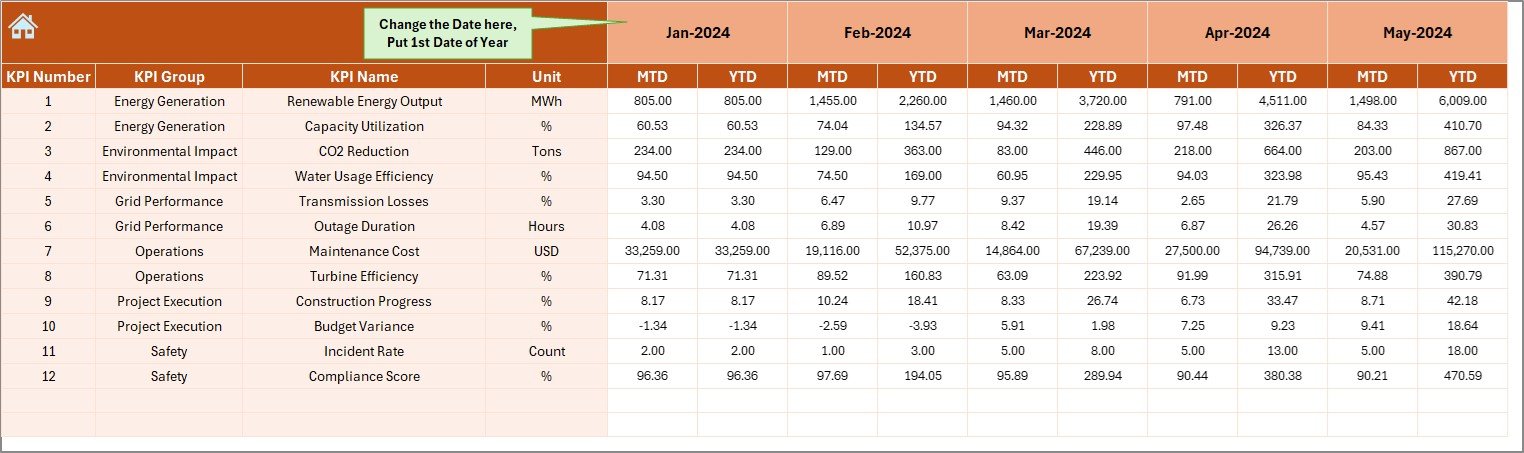
🔹 4. Actual Numbers Input Sheet
Enter your current-year performance data here:
-
Actual MTD
-
Actual YTD
-
KPI Name
-
Month
Enter the first month in cell E1, and the sheet adjusts automatically. This ensures accurate and consistent calculations.
🔹 5. Target Sheet
Enter planned values such as:
-
Monthly targets
-
Yearly targets
-
KPI names
-
Relevant months
Targets are essential for renewable project compliance, budgets, and stakeholder reporting.
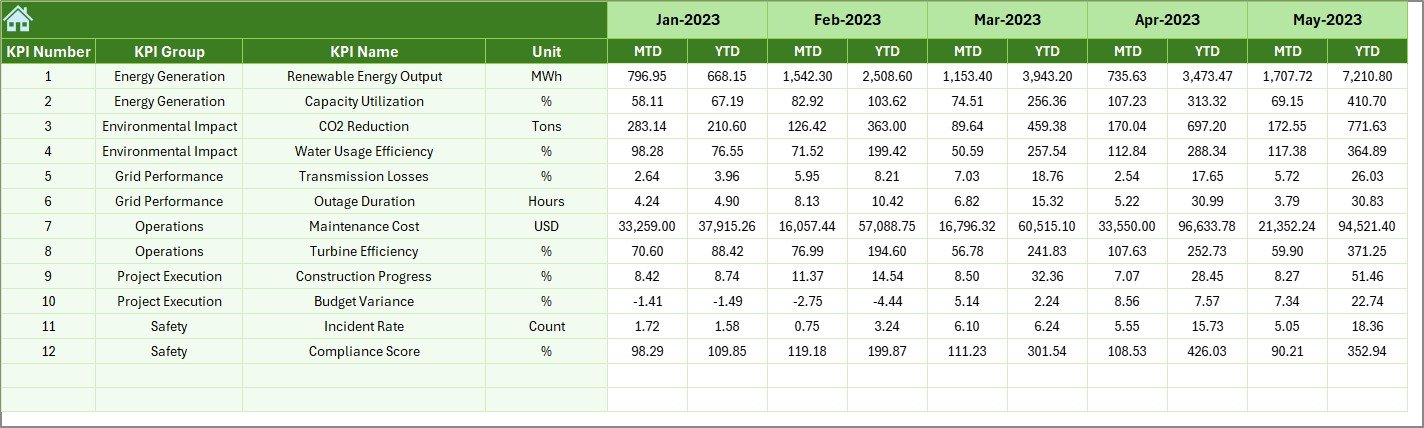
🔹 6. Previous Year Numbers Sheet
This sheet stores:
-
Previous Year MTD
-
Previous Year YTD
-
KPI Name
-
Month
It supports accurate CY vs PY comparisons — crucial for understanding growth patterns and operational improvements.
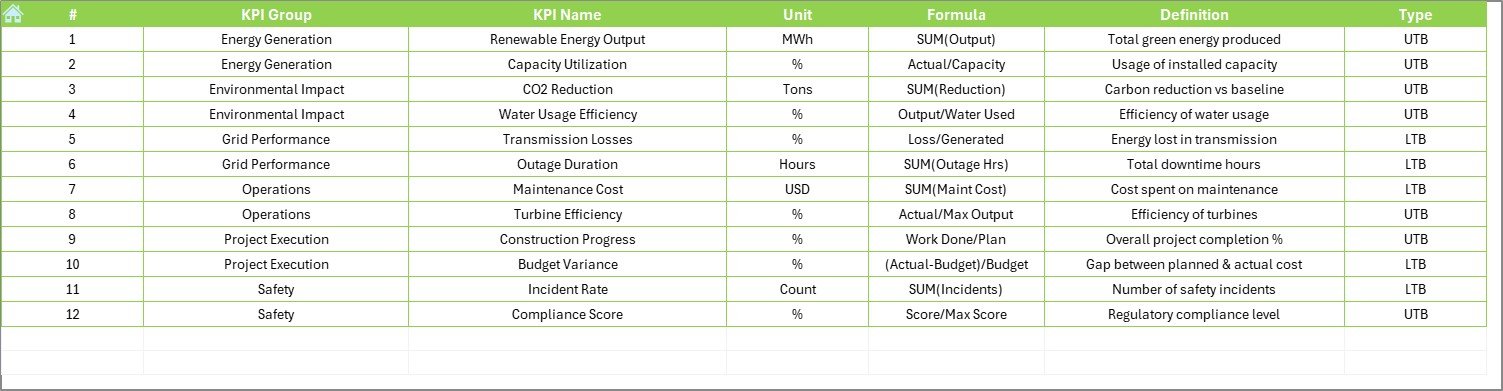
🔹 7. KPI Definition Sheet
This sheet documents:
-
KPI Name
-
Unit
-
Formula
-
Group
-
KPI Type
-
Detailed Definition
It ensures complete clarity and standardization across all project teams.
⭐ Who Can Benefit from This Dashboard?
This dashboard is ideal for:
🌞 Renewable Energy Teams
🏗 Infrastructure Project Managers
♻️ Sustainability & ESG Departments
📊 Data Analysts
⚡ Power & Utility Companies
🌍 Government Agencies & Consultants
Any organization managing renewable infrastructure can use this dashboard to improve accuracy and speed.
⭐ How to Use the Dashboard Easily
-
Enter KPI definitions.
-
Fill monthly actual numbers.
-
Enter target values.
-
Add previous year data.
-
Go to the Dashboard & choose a month.
-
Review charts, KPIs, and trends.
-
Use it for reporting, presentations, and planning.
Everything updates automatically — no formulas to fix or visuals to redesign.
⭐ Who Can Benefit from This Dashboard?
This Excel solution helps teams:
-
Detect delays early
-
Track KPI gaps
-
Improve project transparency
-
Strengthen reporting accuracy
-
Monitor energy generation
-
Manage budgets and milestones
-
Analyze trend patterns
The result is better planning, better forecasting, and better long-term performance.


Reviews
There are no reviews yet.