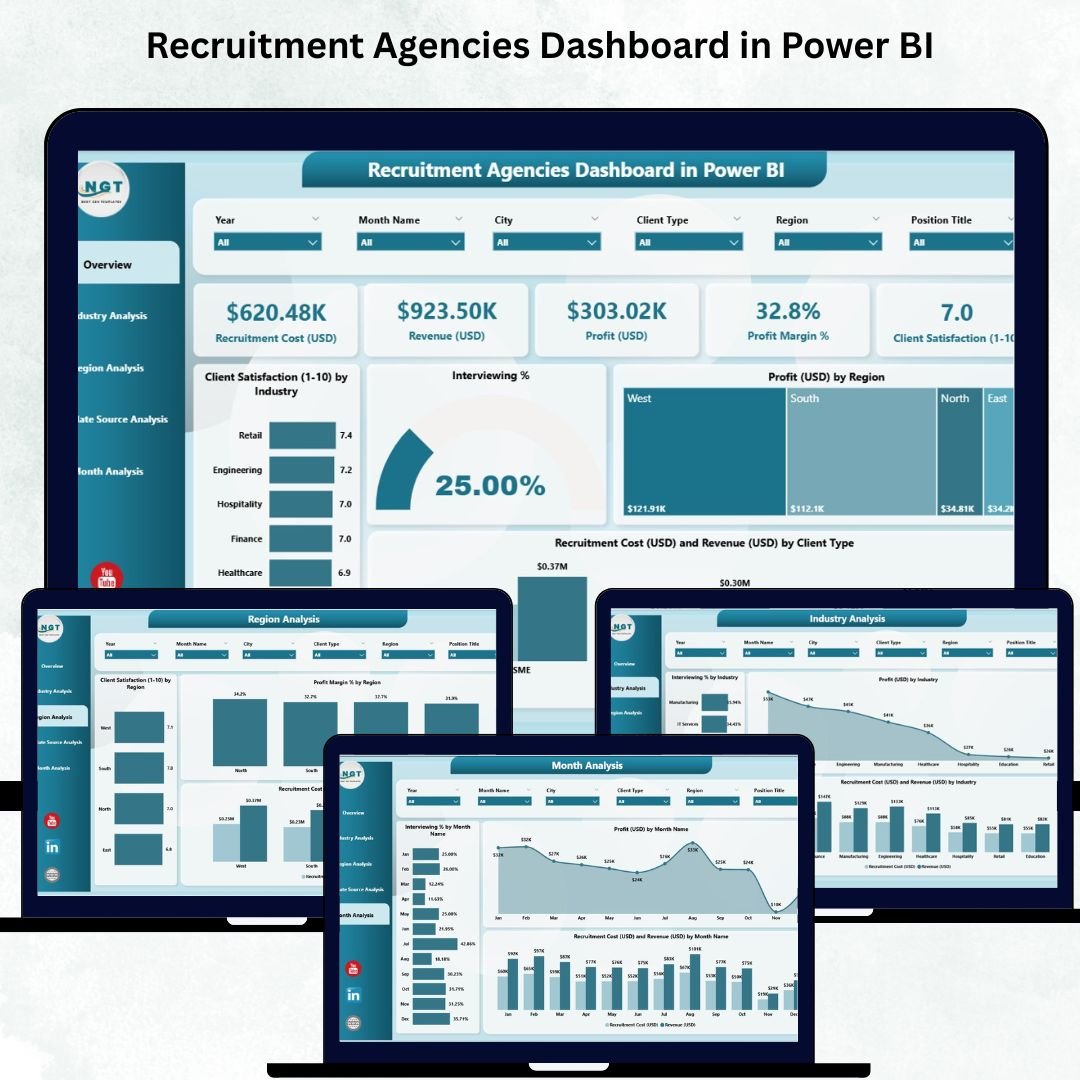
Recruitment agencies operate in a fast-paced environment where client expectations, candidate pipelines, interview performance, and hiring timelines change every single day. Because of this dynamic nature, recruitment teams need a clear, visual, and real-time reporting system that helps them track performance and make smart decisions instantly. The Recruitment Agencies Dashboard in Power BI delivers exactly that. It transforms raw recruitment data into clean, interactive visuals so agencies can monitor interviewing %, profit, cost, client satisfaction, candidate source performance, and monthly trends—all in one place. 🚀
With automated Power BI visuals, slicers, drill-through features, and dynamic charts, this dashboard becomes the ultimate tool for recruitment agencies that want accuracy, clarity, and speed. Whether you serve multiple industries, hire across regions, or manage several candidate pipelines, this dashboard gives you a complete 360° view of your performance and helps you drive better hiring outcomes.
✨ Key Features of the Recruitment Agencies Dashboard in Power BI
This dashboard includes five powerful analysis pages, each designed to give deeper insights into your recruitment operations.
1️⃣ Overview Page – Complete Recruitment Summary
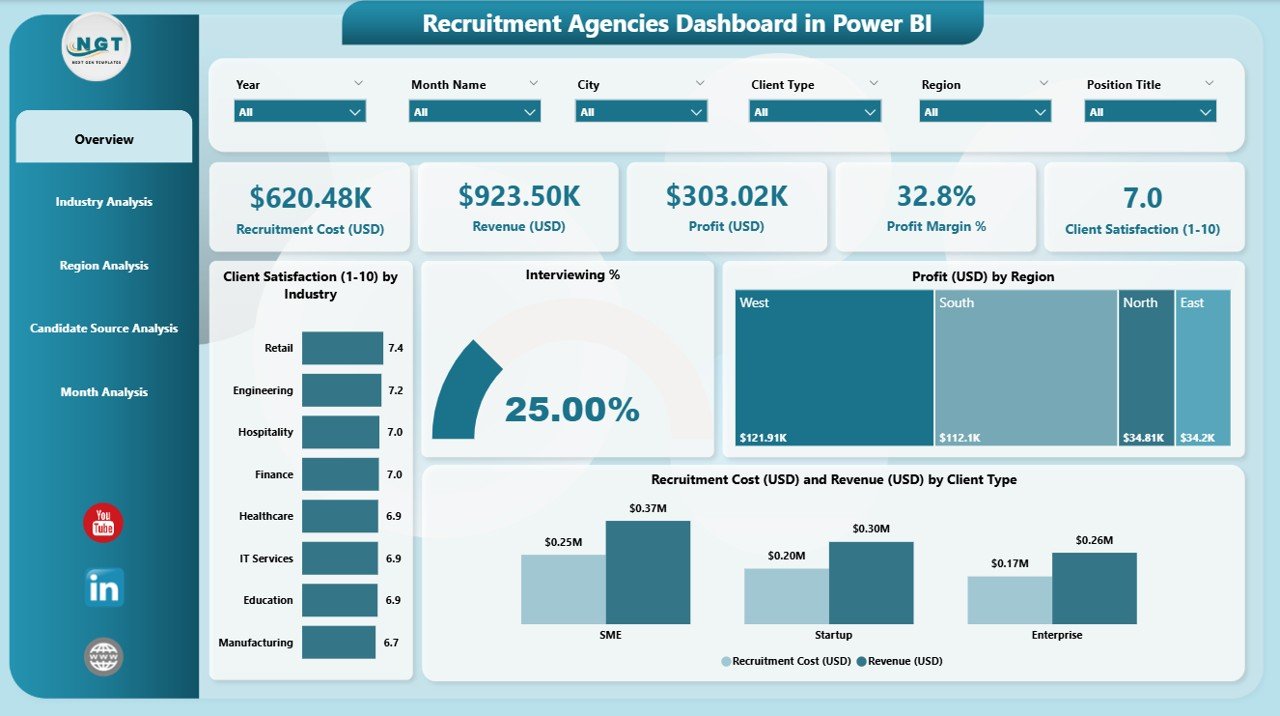
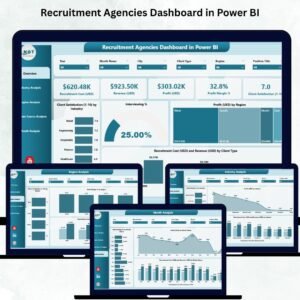
The Overview Page works as your central performance center.
Here, you get:
-
⭐ Four KPI Cards: Total Clients Covered, Interviewing %, Total Profit (USD), Total Recruitment Cost (USD)
-
⭐ Four Key Charts: Client Satisfaction by Industry, Interviewing %, Profit by Region, Recruitment Cost & Revenue by Client Type
-
⭐ Interactive Slicers: Filter by Month, Industry, Region, or Client Type
This page helps you instantly understand how your agency is performing at a high level—financially, operationally, and client-wise.
📦 What’s Inside the Recruitment Agencies Dashboard in Power BI
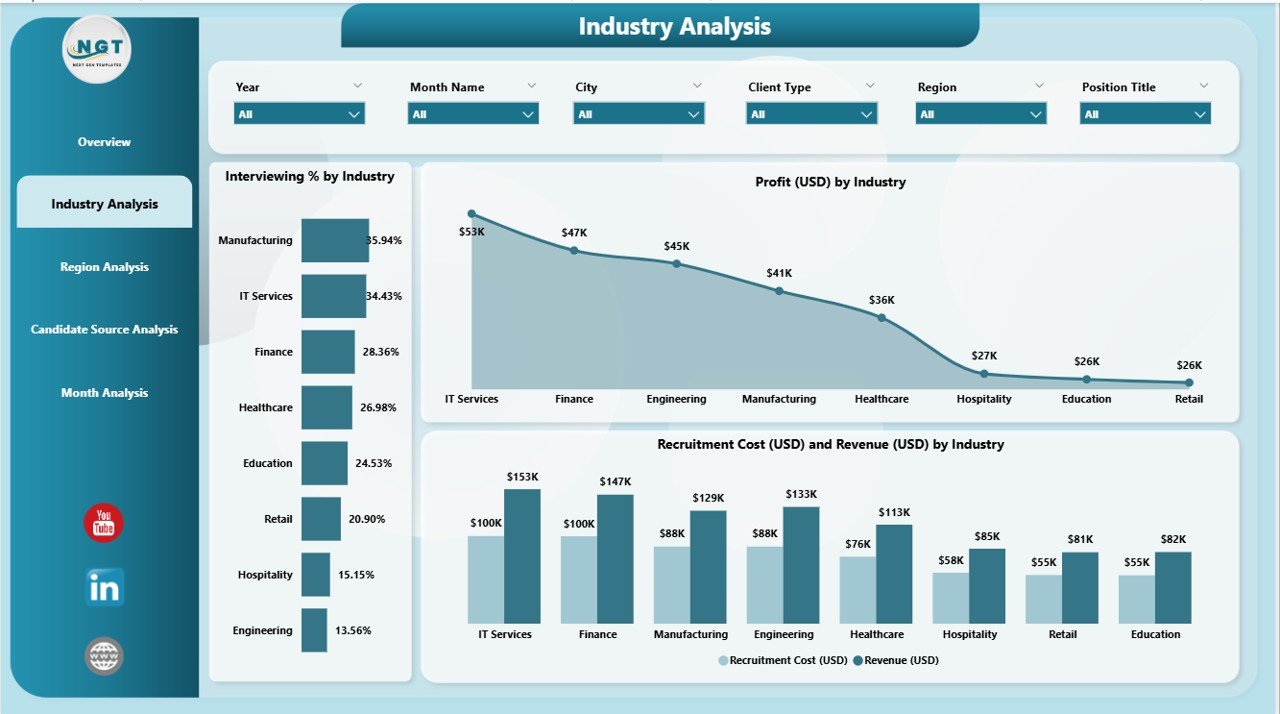
2️⃣ Industry Analysis Page – Compare Industries Easily
Recruitment agencies work with several industries like IT, Finance, Retail, Hospitality, Manufacturing, and Healthcare. This page helps you compare them with clarity.
Charts include:
-
📈 Interviewing % by Industry
-
💰 Profit (USD) by Industry
-
🔍 Recruitment Cost & Revenue by Industry
You can easily identify profitable industries, high-cost sectors, and the ones needing more effort.
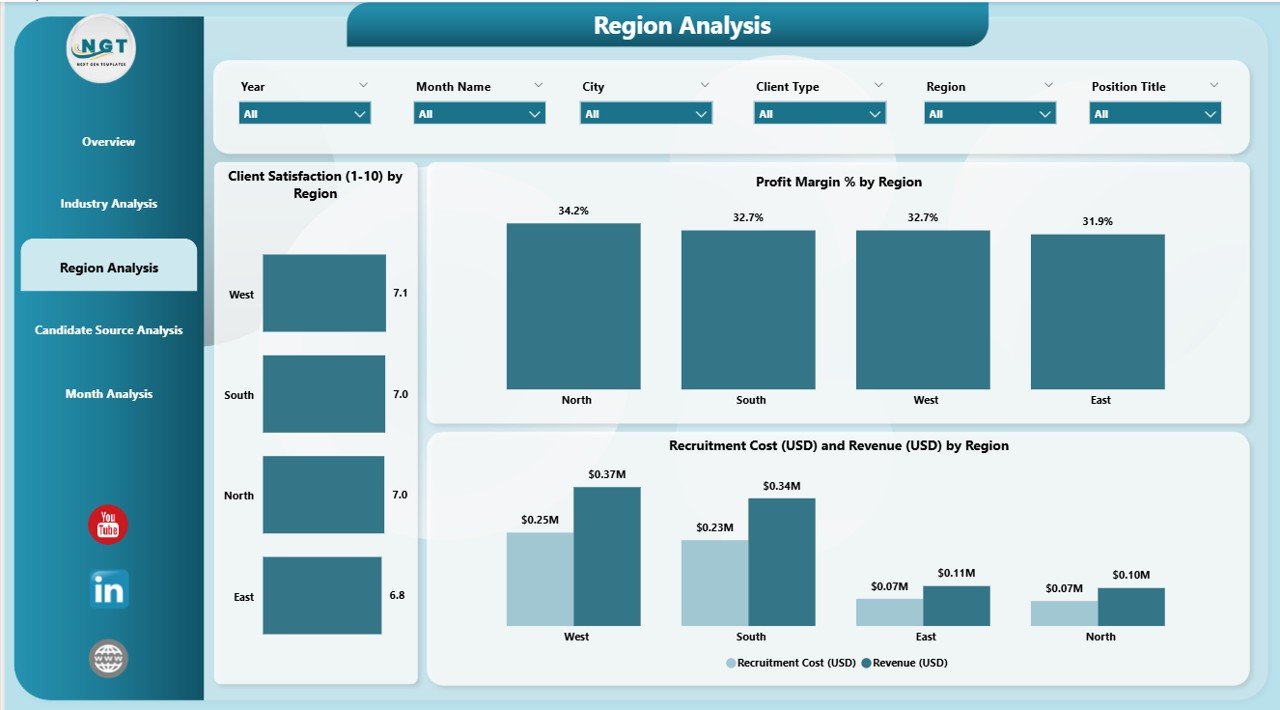
3️⃣ Region Analysis Page – Track Hiring Across Locations
Performance varies across cities, states, and regions. This page highlights regional strengths and weaknesses.
Charts include:
-
😊 Client Satisfaction by Region
-
💵 Profit (USD) by Region
-
📊 Recruitment Cost & Revenue by Region
Use these insights to refine strategies, reallocate recruiters, and improve regional performance.
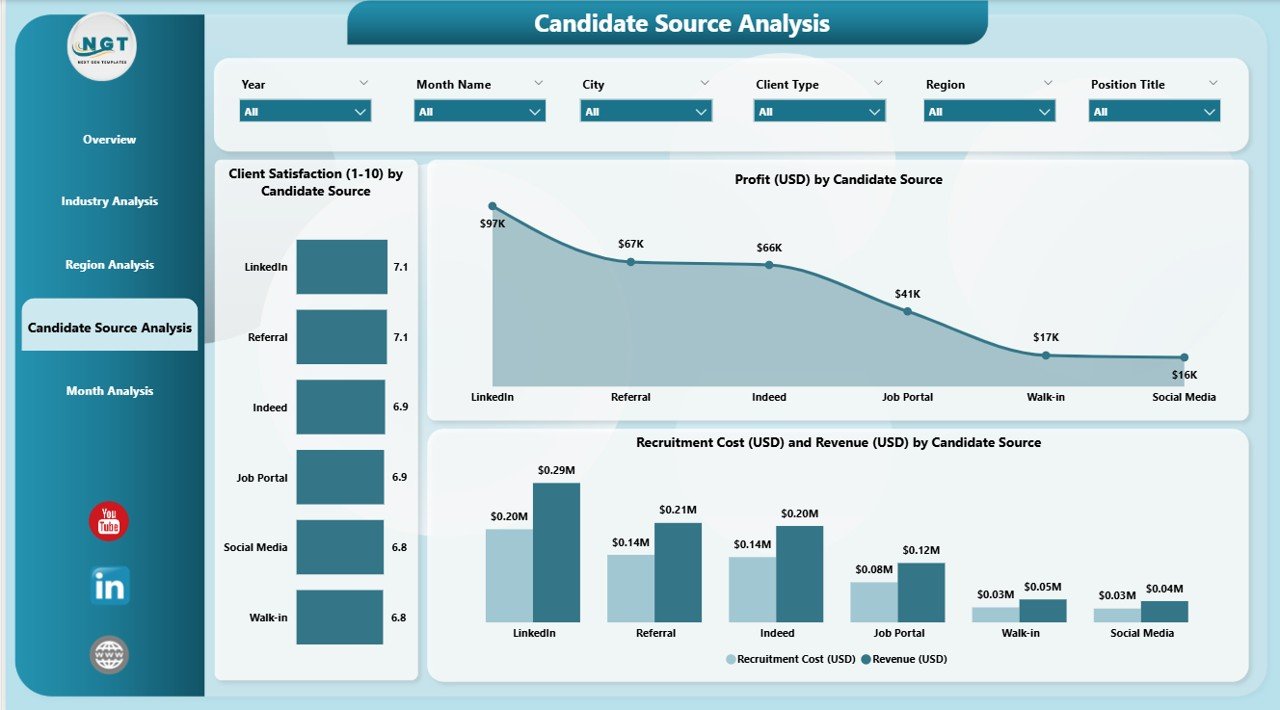
4️⃣ Candidate Source Analysis Page – Identify Best Candidate Sources
Every candidate source ranges in cost, quality, and conversion. This page analyzes them all.
Charts include:
-
⭐ Client Satisfaction by Candidate Source
-
💰 Profit (USD) by Candidate Source
-
📈 Recruitment Cost & Revenue by Candidate Source
This helps you invest in the most productive hiring channels.
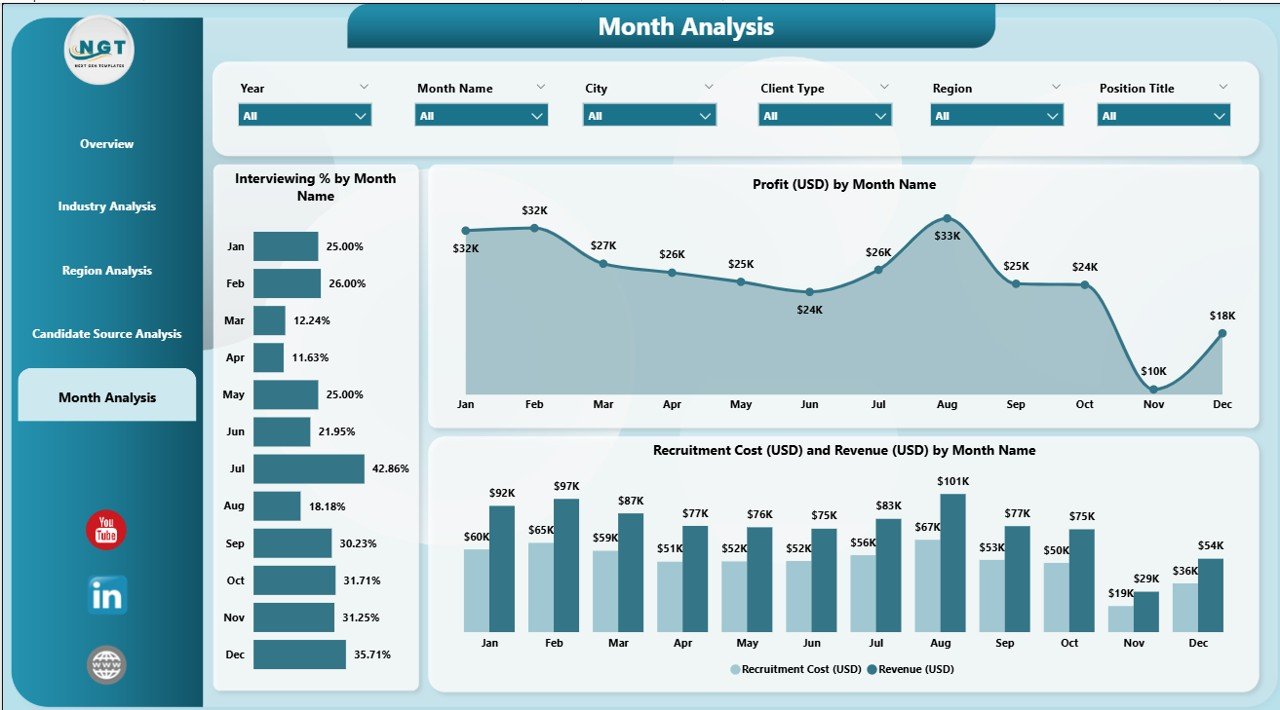
5️⃣ Monthly Trends Page – Understand Performance Over Time
Hiring patterns change every month. This page shows the full picture.
Charts include:
-
📅 Interviewing % by Month
-
💵 Profit (USD) by Month
-
📊 Recruitment Cost & Revenue by Month
This trend analysis helps you set accurate targets and predict hiring cycles.
🛠 How to Use the Recruitment Agencies Dashboard in Power BI
-
📥 Update your source Excel data
-
🔄 Refresh the Power BI file
-
🎯 Use slicers for deep filtering
-
📊 Review KPI cards & charts
-
🔍 Compare industries, regions, and sources
-
📈 Monitor month-by-month growth
-
📤 Share through Power BI Service
The dashboard is extremely easy to use and fully automated.
👥 Who Can Benefit from This Recruitment Dashboard?
This dashboard is ideal for:
-
🧑💼 Recruitment agencies
-
🏢 HR consulting firms
-
👨💼 Hiring managers & team leaders
-
📝 Recruitment analysts
-
📈 Business development teams
-
🧑💼 Freelance recruiters
-
🏛 Staffing companies
Anyone who manages hiring pipelines will benefit from this tool.


Reviews
There are no reviews yet.