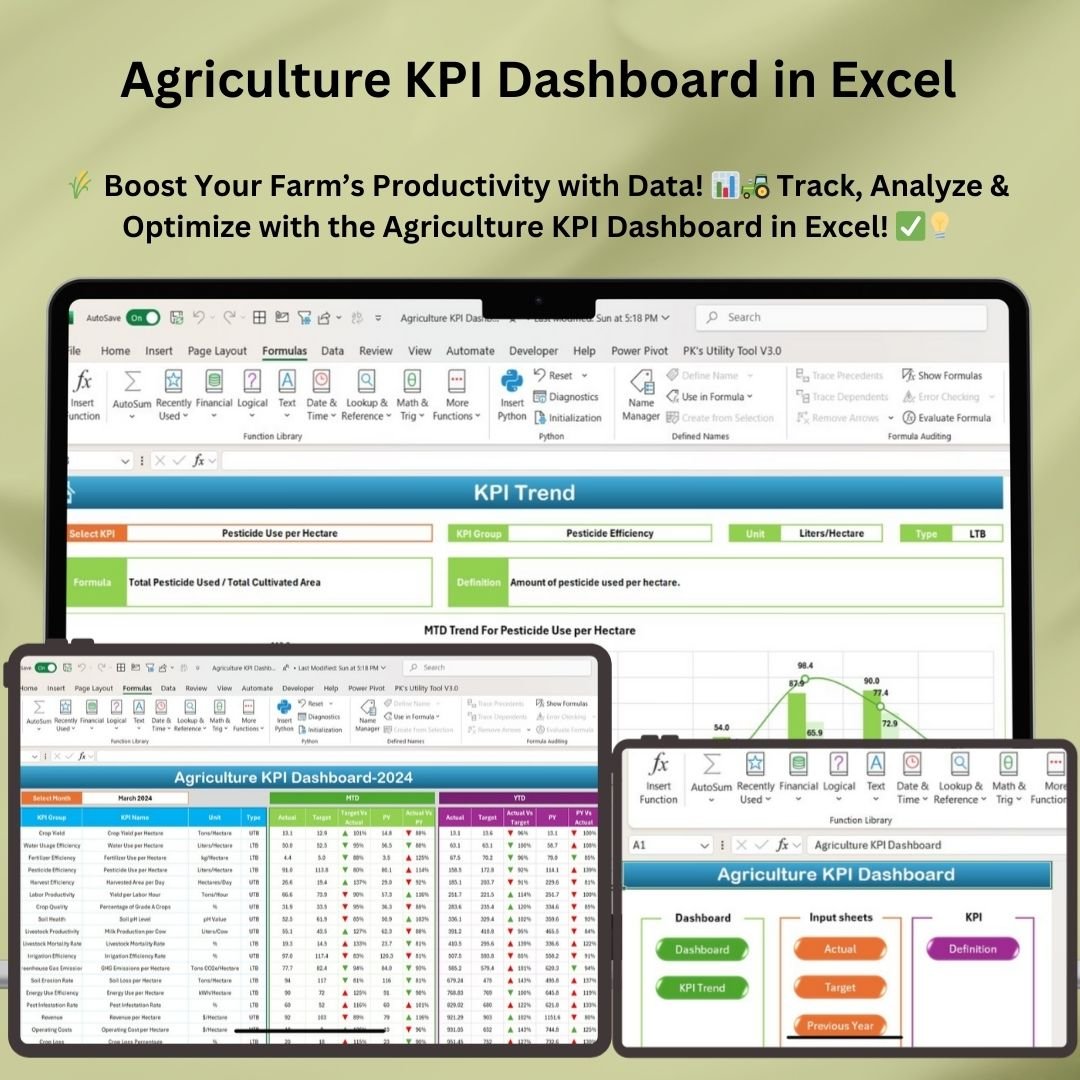


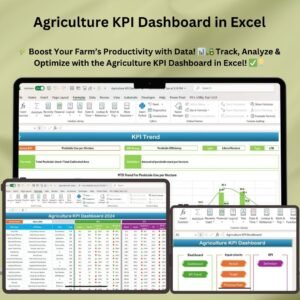
Are you looking for a smart and efficient way to track agricultural performance metrics? Our Agriculture KPI Dashboard in Excel is a powerful tool designed for farmers, agribusiness managers, and agricultural analysts to monitor key performance indicators (KPIs) for better productivity, sustainability, and profitability.
This dashboard provides a comprehensive view of farm operations, enabling you to track crop yield, water usage efficiency, fertilizer efficiency, labor productivity, cost management, and much more. Whether you’re managing a small farm or a large agribusiness, this tool is designed to help you make data-driven decisions and optimize resource utilization.
Key Features of the Agriculture KPI Dashboard
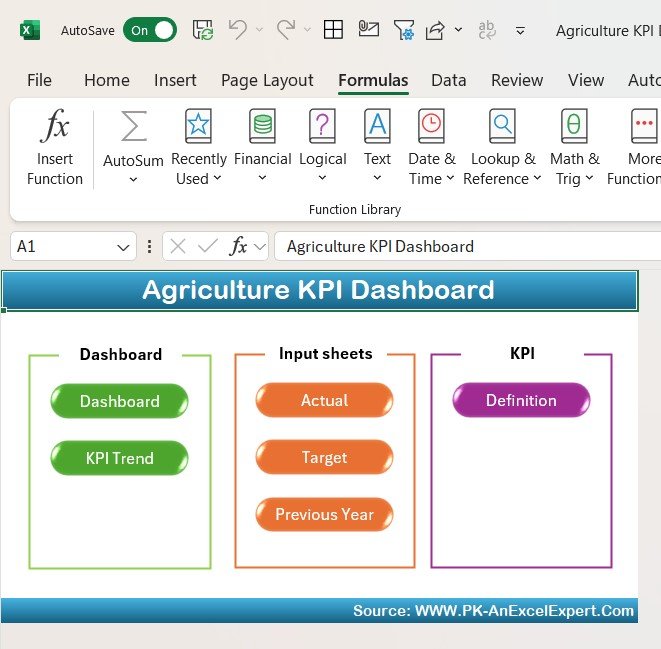
1. Home Sheet – Centralized Navigation
- A user-friendly home page with six interactive buttons for quick access to key sections.
- Easy navigation to Dashboard, KPI Trend, Input Sheets, and KPI Definitions.
- Provides a structured workflow for seamless user experience.
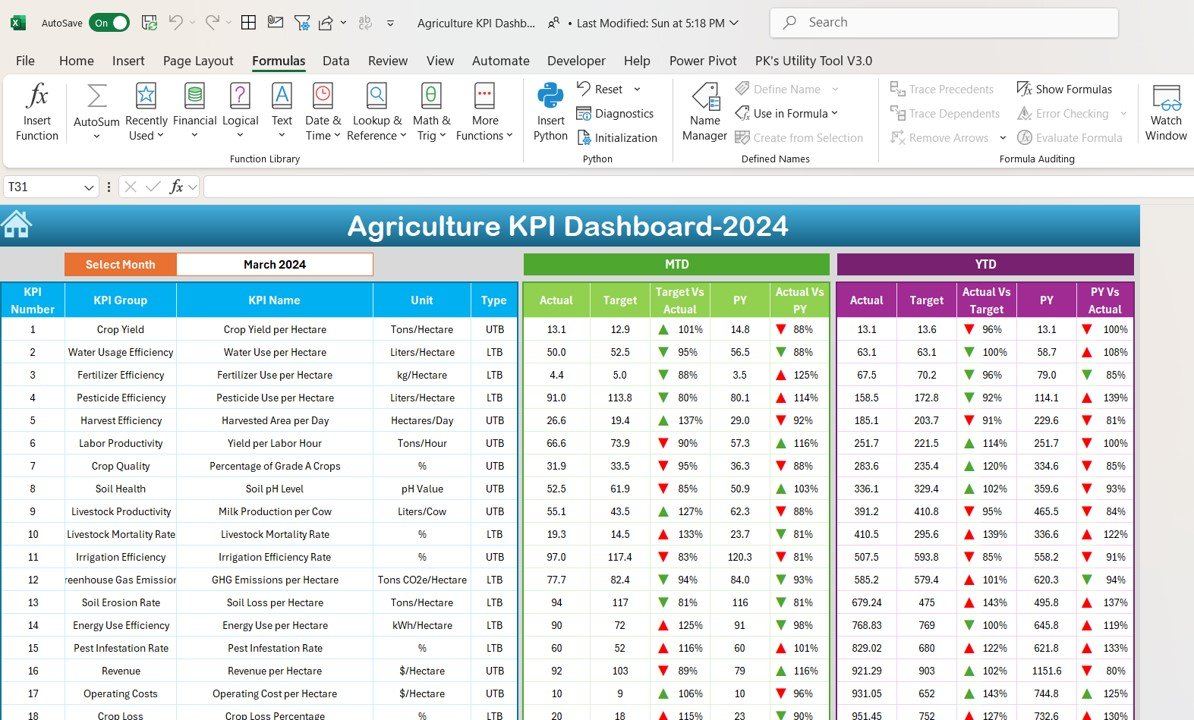
2. Dashboard Sheet – Visualizing Agricultural Performance
- Comprehensive Overview: Displays Month-to-Date (MTD) and Year-to-Date (YTD) performance for all key agricultural KPIs.
- Dynamic Filters: Select any month to view real-time KPI performance updates.
- Conditional Formatting: Helps you instantly identify underperforming and overperforming KPIs.
- Performance Insights: Quickly compare actual vs. target values and previous year’s performance.
3. KPI Trend Sheet – Data Visualization for Better Analysis
- Trend Analysis: Track the historical trend of key agricultural KPIs.
- Graphical Representation: Interactive line charts and bar graphs for KPI progress tracking.
- Data Comparison: Analyze MTD and YTD trends alongside targets and past data.
- Formula Integration: Each KPI is backed by formulas for accurate and real-time analysis.
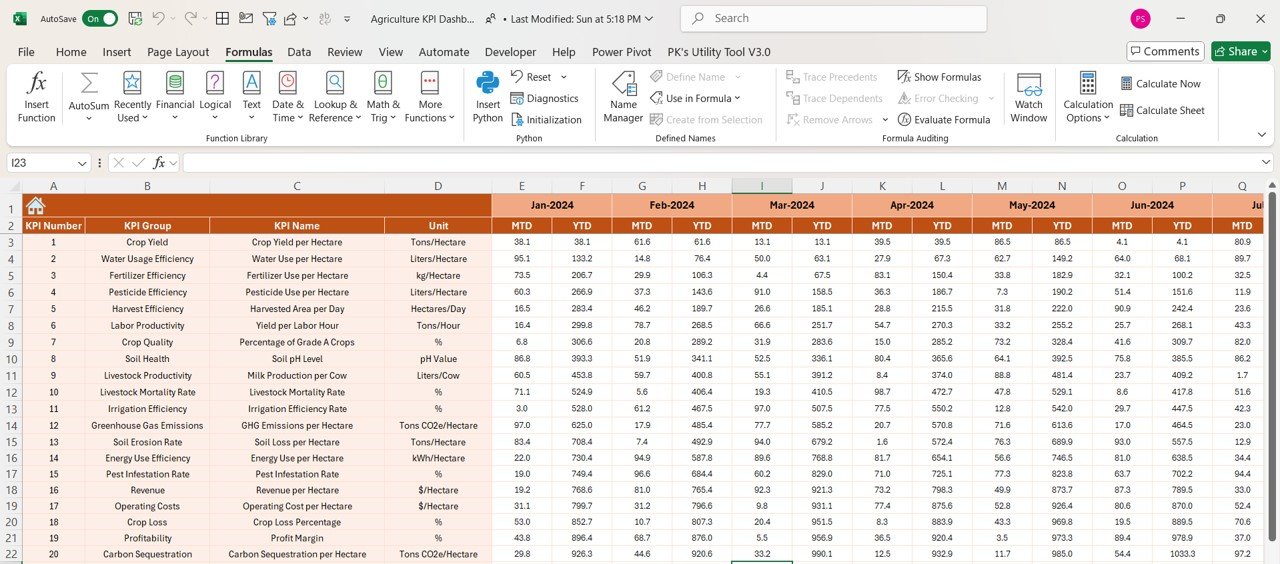
4. Actual Numbers Input Sheet – Customize Your Data
- Data Entry Made Easy: Manually input MTD and YTD actual values for each KPI.
- Customizable Fields: Modify KPI values as per real-world data collected from farm operations.
- Error Reduction: Ensures smooth data entry with validation checks.
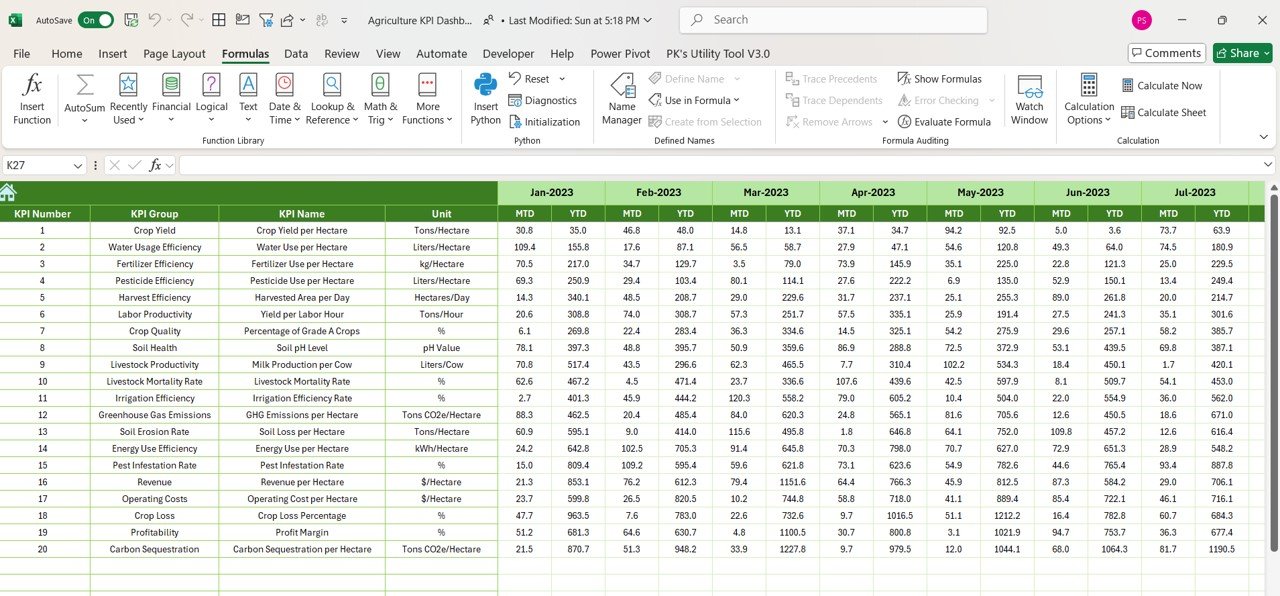
5. Target and Previous Year Sheets – Setting Goals & Benchmarking Performance
- Target Data Input: Set monthly and yearly targets for key agricultural KPIs.
- Previous Year Comparison: Compare current performance vs. past year’s results to assess growth and efficiency.
- Performance Alerts: Highlights KPIs that are not meeting targets or exceeding thresholds.
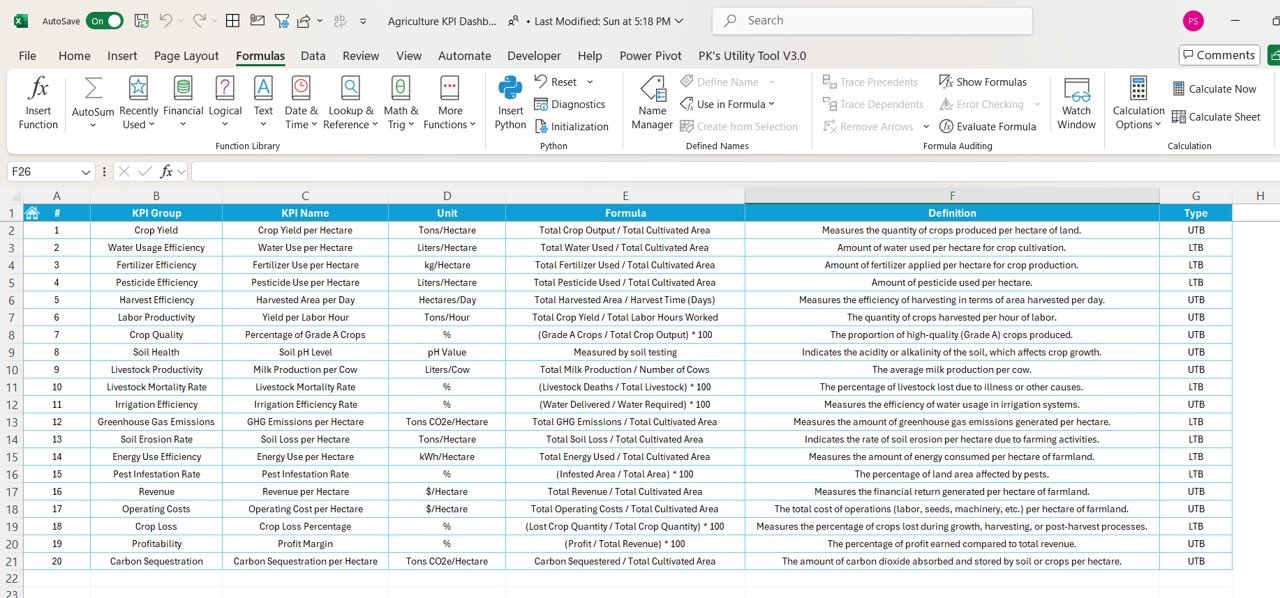
6. KPI Definition Sheet – Understanding Performance Metrics
- Detailed KPI Explanation: Understand the formula, unit, and logic behind each KPI.
- Formula Breakdown: Clearly defined calculation methods for easy performance analysis.
- Standardized Metrics: Ensures consistent KPI tracking across multiple farm operations.
What Can You Track with This Dashboard?
This dashboard includes a comprehensive list of agriculture-related KPIs, including:
✅ Crop Yield per Hectare – Measure how much crop is produced per hectare.
✅ Water Usage Efficiency – Track liters of water used per hectare for cultivation.
✅ Fertilizer & Pesticide Efficiency – Monitor the amount of fertilizer and pesticide used per hectare.
✅ Harvest Efficiency – Track the area harvested per day to assess productivity.
✅ Labor Productivity – Evaluate yield per labor hour.
✅ Soil Health & Crop Quality – Measure soil pH levels and the percentage of Grade A crops.
✅ Irrigation Efficiency – Assess the performance of irrigation systems.
✅ Energy & Greenhouse Gas Emissions – Track energy use efficiency and carbon footprint.
✅ Revenue & Cost Analysis – Monitor revenue, operating costs, and profit margins.
✅ Pest Infestation Rate – Analyze and reduce pest damage through preventive measures.
Who Can Use This Dashboard?
This Agriculture KPI Dashboard in Excel is ideal for:
🌿 Farm Owners & Managers – Monitor farm performance & optimize operations.
🌾 Agricultural Analysts – Gain insights into KPI trends & make data-driven recommendations.
🌍 Agribusiness Companies – Improve efficiency & profitability with real-time KPI tracking.
📊 Research Institutions – Use structured KPI data for in-depth agricultural studies.
Why Choose This Dashboard?
🚀 User-Friendly Interface – Simple navigation, structured layouts, and automated analysis.
📉 Real-Time Data Updates – Instant updates based on user input for better tracking.
📊 Data-Driven Decision Making – Helps in optimizing resource use and increasing productivity.
🔍 Customizable & Scalable – Modify, add, or update KPIs as per your specific farm operations.
✅ Automated Insights & Visualizations – No need for complex calculations—everything is automated!
Get Your Agriculture KPI Dashboard in Excel Today!
📥 Instant Download | ✅ Fully Editable & Customizable | 📊 Boost Productivity
🚜 Monitor. Analyze. Optimize. Grow. 🌿
This detailed description ensures clarity, engagement, and SEO optimization while covering every feature and benefit of the Agriculture KPI Dashboard in Excel. Let me know if you need modifications or additional details! 🚀
Click here to read the detailed blog post
Visit our YouTube channel to learn step-by-step video tutorials
Also check our HR KPI Dashboard in Excel


Reviews
There are no reviews yet.