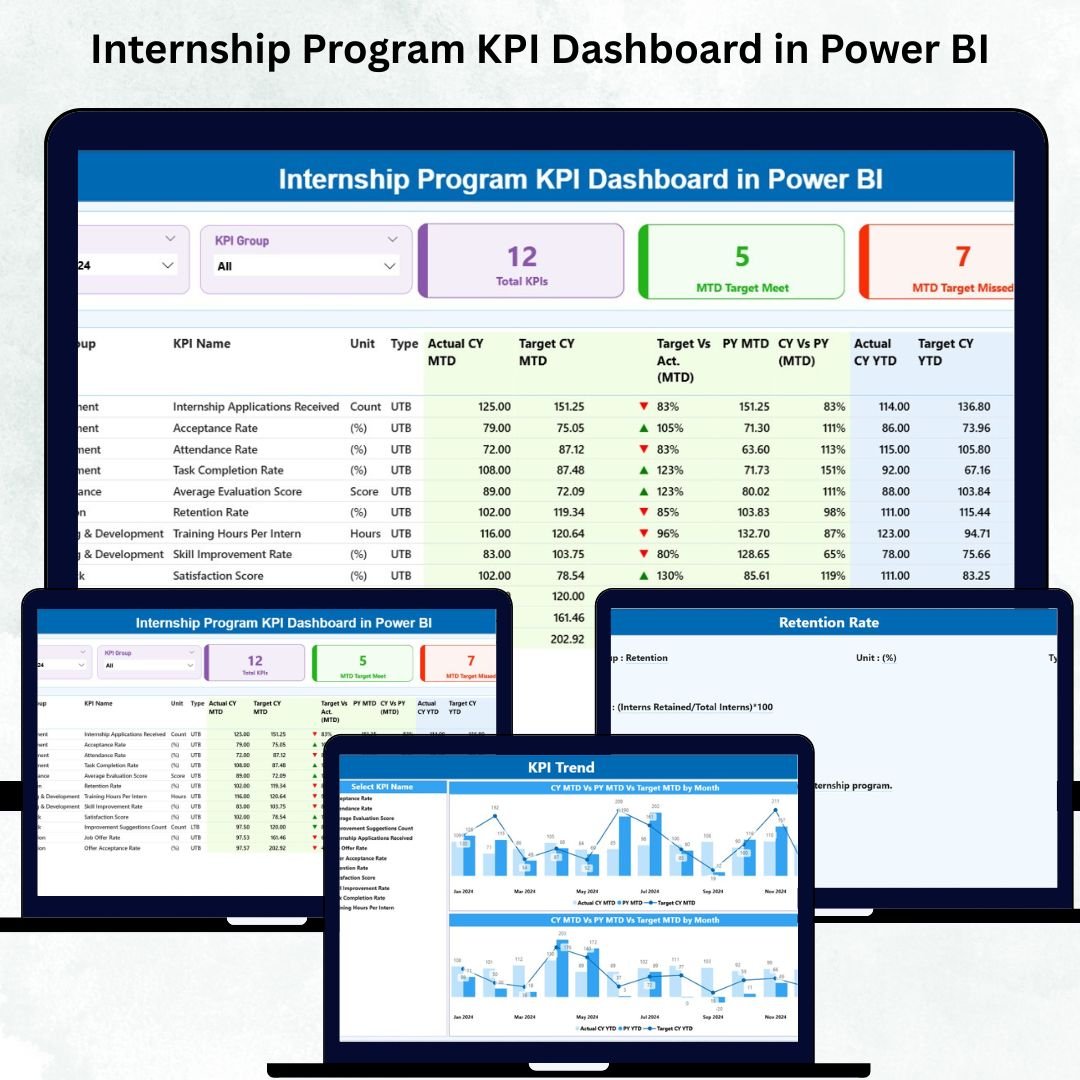
Managing an internship program becomes challenging when performance reports sit in different spreadsheets, attendance records come from multiple sources, and mentors track progress in separate files. HR teams need a clear overview, managers want progress insights, and leadership expects accurate reports. To solve these challenges, we created the Internship Program KPI Dashboard in Power BI — a visual, interactive, and fully automated solution that gives you real-time clarity on every intern’s performance.
This dashboard brings all KPIs together in one place: performance scores, attendance %, project completion rates, feedback ratings, skill development scores, engagement levels, and mentor evaluation metrics. Because Power BI reads Excel data and converts it into dynamic visuals, you get instant insights for MTD (Month-to-Date), YTD (Year-to-Date), and previous year comparisons. Whether you manage a corporate internship program, university internship cell, or department-specific training, this dashboard helps you track progress and make better decisions.
✨ Key Features of Internship Program KPI Dashboard in Power BI
📊 Summary Page – The Heart of the Dashboard
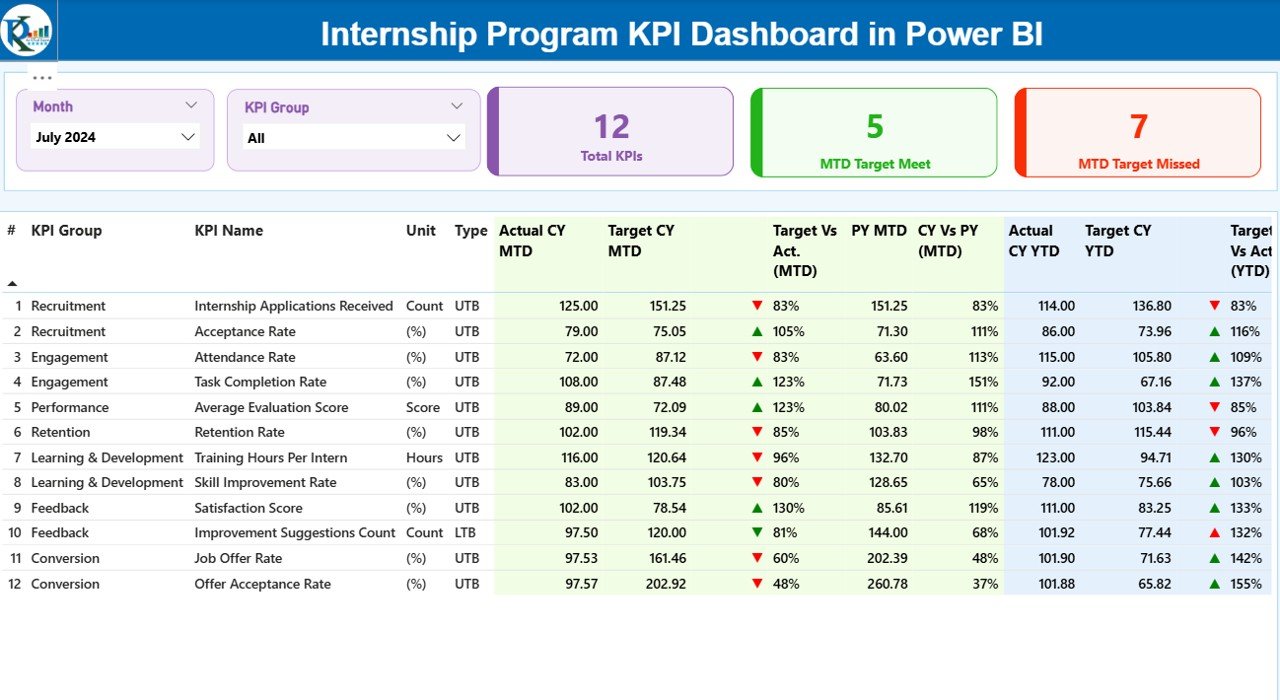
The Summary Page provides a complete view of internship KPIs on one screen. You get:
-
Month slicer for MTD/YTD analysis
-
KPI Group slicer for filtering categories like Training, Performance, Attendance & Behavior KPIs
-
3 KPI Cards showing Total KPIs, MTD Target Met & MTD Target Missed
A detailed interactive table displays each KPI’s number, unit, type (UTB/LTB), actual vs target values, MTD/YTD icons, previous year comparisons, and achievement percentages — all updating instantly when you change filters.
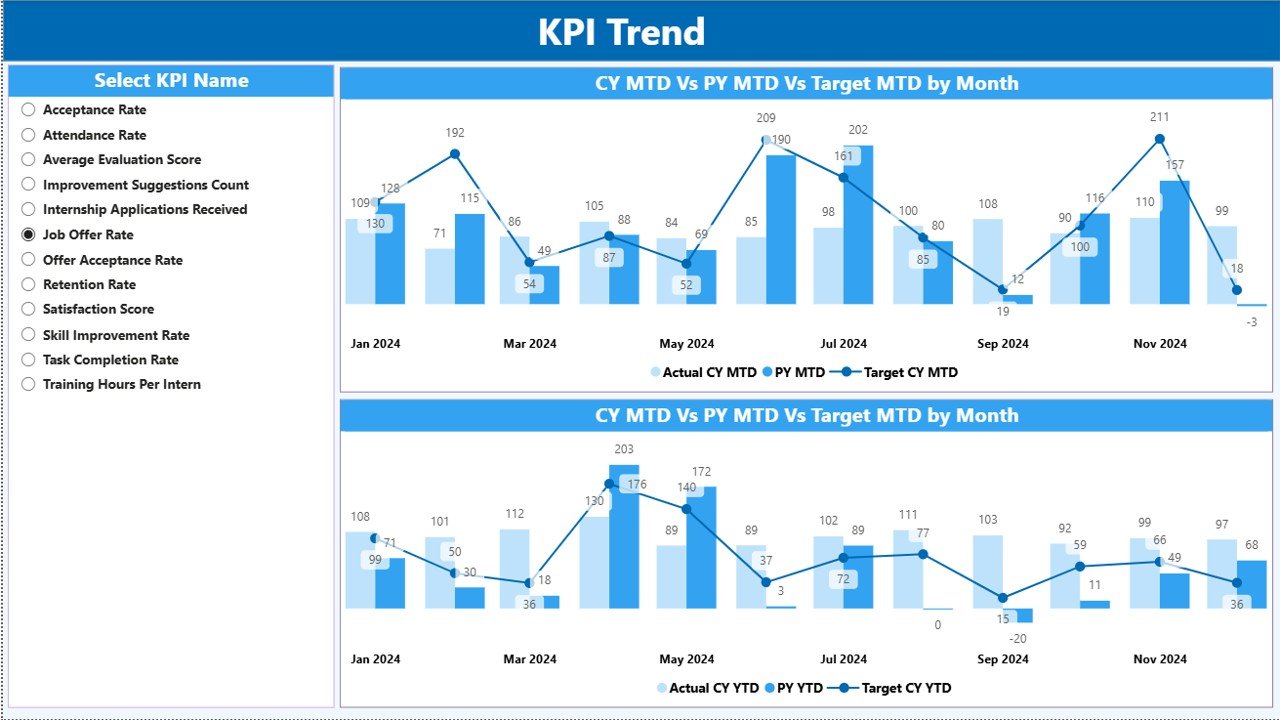
📈 KPI Trend Page – Track Performance Over Time
This page includes two combo charts that show:
-
MTD trends: Actual CY, PY Actual & Target
-
YTD trends: Actual CY, PY Actual & Target
A KPI Name slicer allows you to select any KPI and review progress patterns across months.
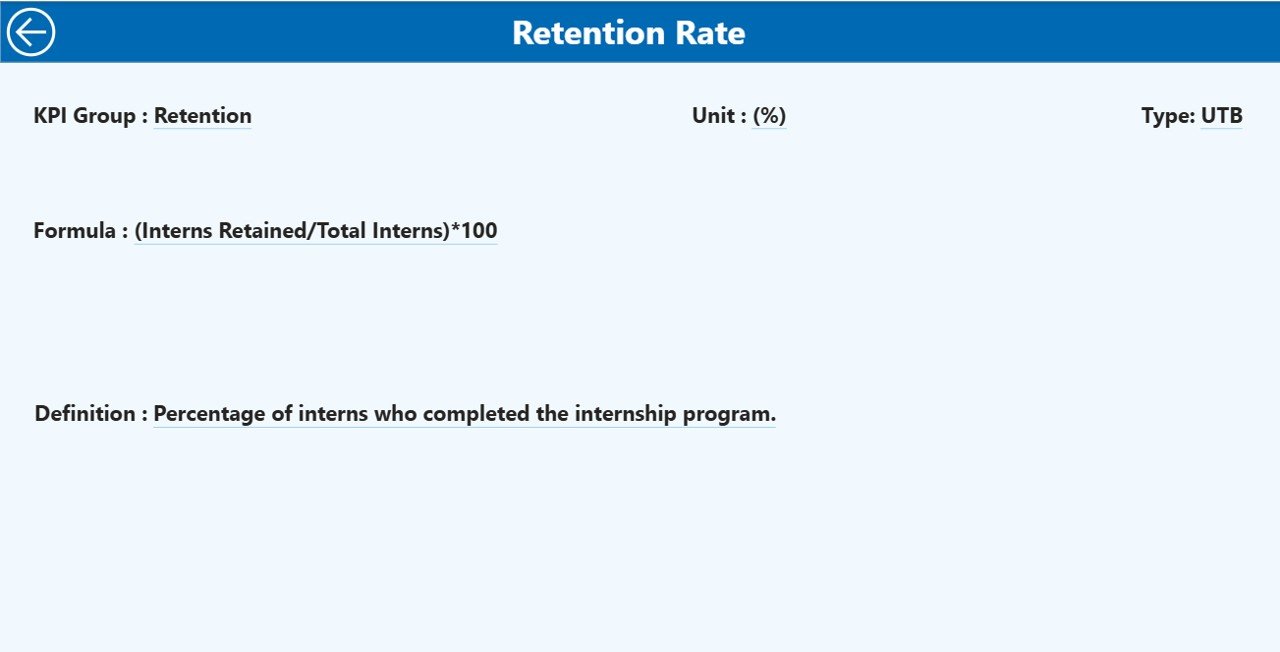
🔍 KPI Definition Page – Drill-Through Analysis
Right-click any KPI on the Summary Page to drill through and view:
-
KPI Number
-
KPI Group
-
Formula
-
Definition
-
Unit
-
Type (UTB/LTB)
A Back button brings you to the main dashboard anytime.
📦 What’s Inside the Internship Program KPI Dashboard
📁 1. Power BI PBIX File
A professionally designed dashboard with slicers, KPIs, drill-through features, combo charts, and interactive visuals.
📊 2. Excel-Based Data Source
Includes 3 important sheets:
-
Input_Actual – MTD/YTD actual performance
-
Input_Target – Monthly & Yearly targets
-
KPI Definition Sheet – Complete KPI reference structure
Just update Excel → refresh Power BI → all visuals update automatically.
🌐 3. Fully Automated KPI Calculations
Performance icons (▲▼), achievement percentages, month-to-month trends, and CY vs PY comparisons are auto-calculated.
⚡ 4. Filter-Friendly Dashboard
Use slicers to filter performance by month, KPI group, intern profile, and more.
🛠️ How to Use the Internship Program KPI Dashboard
1️⃣ Update Excel Sheets
Fill the Actual, Target, and KPI Definition sheets every month.
2️⃣ Refresh Power BI
Click Refresh — all KPIs, charts, and tables update instantly.
3️⃣ Use Slicers for Quick Filtering
Analyze performance by KPI category or specific time period.
4️⃣ Review Summary Cards
Check how many KPIs met or missed the target.
5️⃣ Study KPI-Level Insights
Understand achievement %, MTD/YTD values, and CY vs PY trends.
6️⃣ Use Trend Page for Progress Patterns
Identify growth, improvement areas, and performance fluctuations.
7️⃣ Drill Through for Detailed Definitions
Review KPI logic to avoid confusion.
🎯 Who Can Benefit from This Internship Program KPI Dashboard
👩💼 HR Teams
Track attendance, engagement, and progress accurately.
👨🏫 Mentors & Trainers
Review intern performance scores, feedback ratings, and skill development.
🧑💻 Program Managers
Monitor overall quality and alignment with internship goals.
🏢 Leadership Teams
Evaluate internship program impact and hiring success rates.
🎓 Interns (Optional Access)
View expectations, performance metrics, and progress patterns clearly.
### Click hare to read the Detailed blog post
Visit our YouTube channel to learn step-by-step video tutorials
👉 Youtube.com/@PKAnExcelExpert


Reviews
There are no reviews yet.