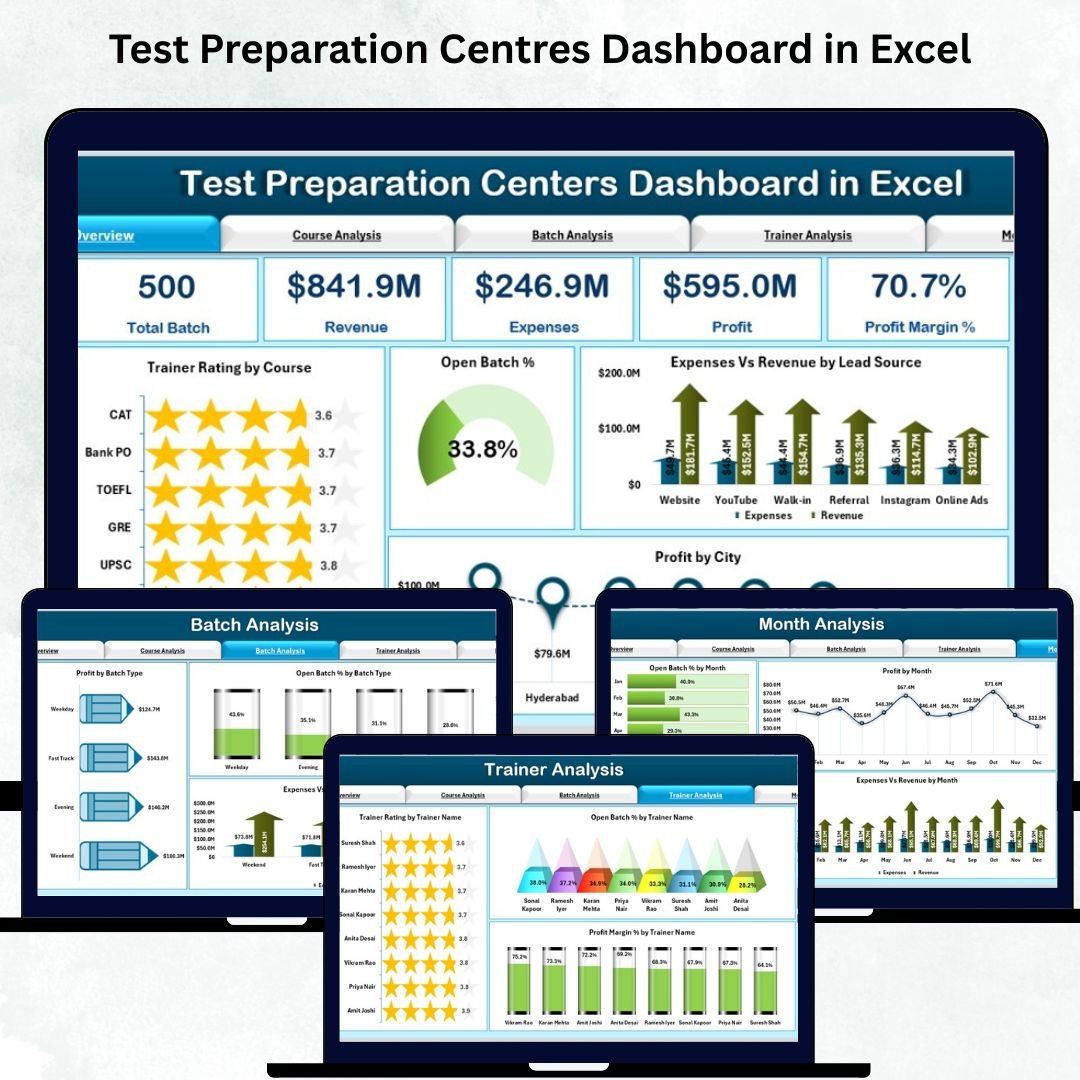
Running a test preparation Test Preparation Centers Dashboard difficult when data sits in multiple sheets, trainers maintain separate reports, and management struggles to see real-time insights. Students expect better progress tracking, trainers need updated performance reports, and owners want instant clarity on revenue, expenses, courses, batches, and overall performance. To solve these challenges, we created the Test Preparation Centers Dashboard in Excel — a modern, visual, and fully automated reporting system that centralizes every metric into one interactive dashboard.
This ready-to-use template helps you monitor coaching operations with ease. Whether you run an IELTS coaching centre, UPSC training institute, coding bootcamp, language academy, or school-based test prep business, this dashboard transforms scattered data into clear insights. With slicers, charts, and automated KPIs, you understand performance instantly and make faster decisions that support long-term growth.
✨ Key Features of Test Preparation Centres Dashboard in Excel
🎛️ Left-Side Page Navigator
Move across all analytical pages—Overview, Course Analysis, Batch Analysis, Trainer Analysis, and Month Analysis—with one click. No need to scroll or search through sheets.
📊 5 Fully Interactive Dashboard Pages
Each page focuses on a different dimension of coaching performance. From profit trends to trainer ratings, you get instant clarity.
💹 Automated KPI Cards
View critical highlights like revenue, expenses, batch status, trainer ratings, and profit margins—instantly and visually.
📈 Clear & Insightful Charts
The dashboard includes multiple visuals such as Profit by City, Expenses vs Revenue, Trainer Ratings, Batch Performance, and Month-wise Progress Trends.
🔄 One-Click Refresh
Just update the Data Sheet and click Refresh All. All KPIs, charts, and summaries update automatically—saving hours of manual work.
📦 What’s Inside the Test Preparation Centres Dashboard
📁 1. Excel Dashboard File (.xlsx)
A beautifully designed dashboard with slicers, icons, charts, and navigators. Every page is automated for effortless analysis.
📊 2. Support Sheet
Contains mapped values, formulas, and calculated fields that power all visuals. No manual editing required.
📁 3. Data Sheet
Enter all performance details such as:
-
Courses
-
Trainers
-
Batch Types
-
Cities
-
Revenue & Expenses
-
Ratings
-
Monthly Breakdown
-
Lead Sources
Once updated, the dashboard instantly reflects the new data.
🔎 4. Five Analytical Pages
Each page provides a different layer of insights:
-
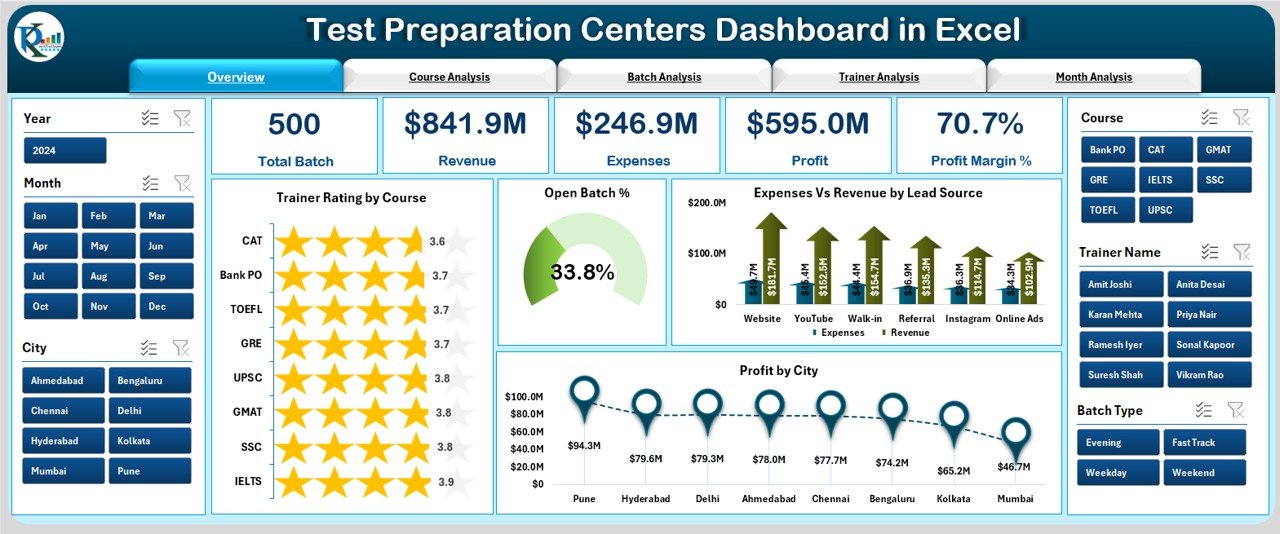
Overview Page – High-level KPIs & charts
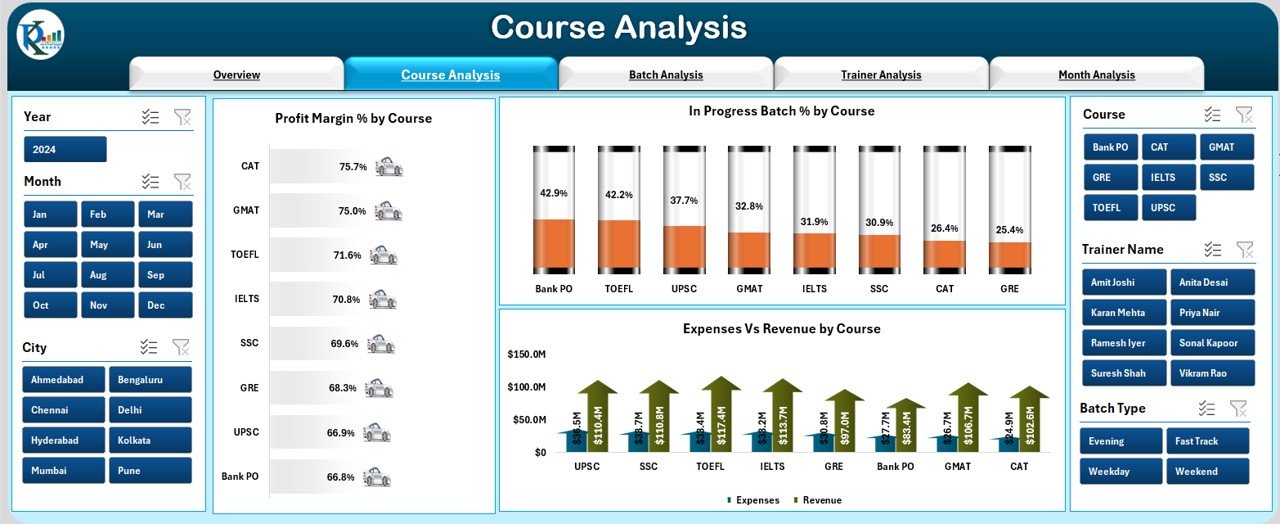
-
Course Analysis – Profit, batch progress, revenue & expenses by course
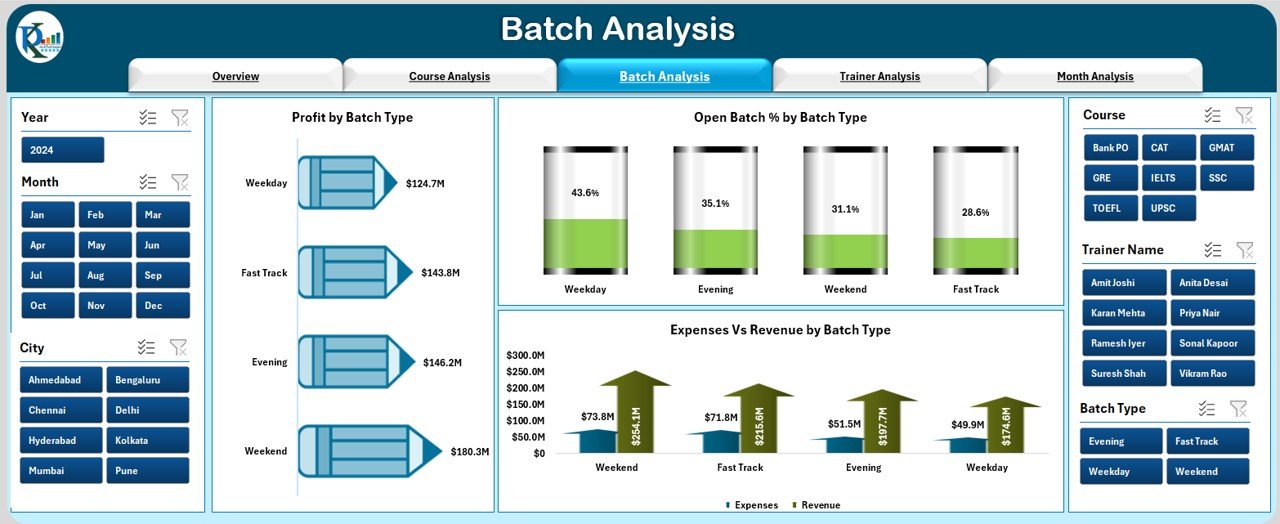
-
Batch Analysis – Batch type performance & profitability
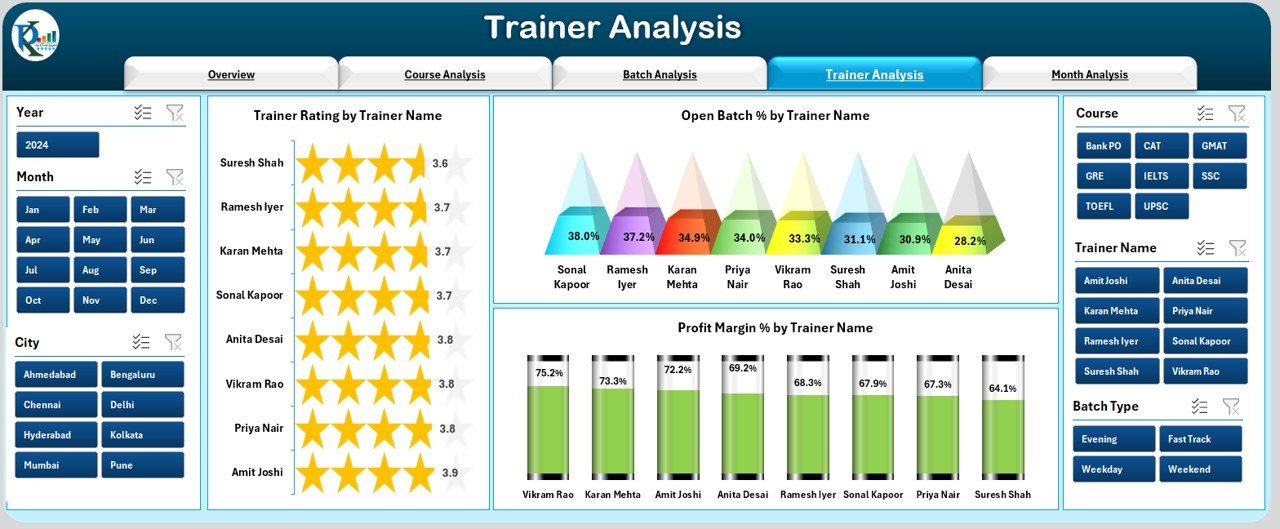
-
Trainer Analysis – Ratings, open batch %, and trainer-wise profit
-
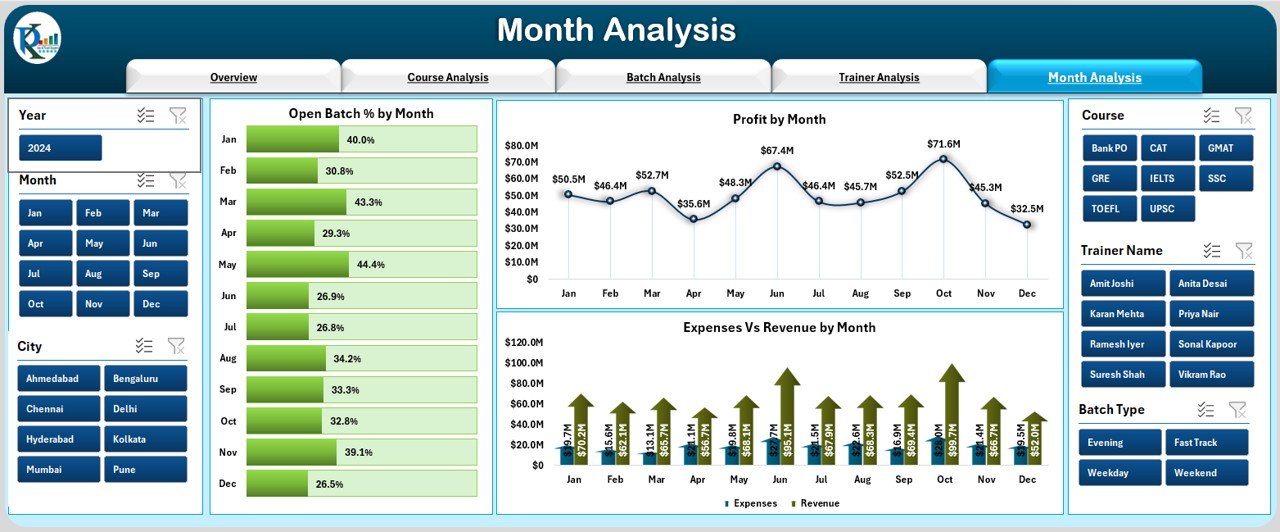
Month Analysis – Monthly revenue, expenses, and performance trends
🛠️ How to Use the Test Preparation Centres Dashboard
1️⃣ Enter Data in the Data Sheet
Update course details, batch information, trainers, revenue, expenses, ratings, and lead sources.
2️⃣ Click Refresh All
All KPIs, charts, and performance visuals update automatically.
3️⃣ Use Slicers to Filter Insights
View performance by:
-
Course
-
Trainer
-
Batch Type
-
City
-
Month
-
Lead Source
4️⃣ Review Key Insights
Check KPIs such as open batch %, profit margin, trainer rating, expenses, revenue, and monthly performance.
5️⃣ Analyze Trends for Planning
Use the Month Analysis and Course Analysis pages to plan future strategies.
🎯 Who Can Benefit from This Test Preparation Centres Dashboard
👨🏫 Trainers
Analyze ratings, performance, and batch progress to deliver better outcomes.
🧑💼 Institute Owners
Get a complete financial overview—profit, revenue, expenses, and monthly trends.
🏫 Centre Managers
Track batch progress, course performance, open batch %, and resource requirements.
📊 Business Analysts
Explore course profit margin, batch performance, lead source ROI, and long-term trends.
🎓 Academic Coordinators
Monitor trainer efficiency, course outcomes, and student-related KPIs.
### Click hare to read the Detailed blog post
Visit our YouTube channel to learn step-by-step video tutorials
👉 Youtube.com/@PKAnExcelExpert


Reviews
There are no reviews yet.