
Managing a large dealer network becomes challenging when data is scattered across spreadsheets, emails, and multiple reporting systems. This lack of visibility makes it difficult to track dealer performance, compare targets vs. actuals, and identify improvement areas. To solve these challenges, we created the Dealer Network KPI Dashboard in Power BI — a modern, visual, and fully automated reporting solution that brings every KPI into one clean and interactive dashboard.
Built with Power BI and connected to a structured Excel data source, this dashboard provides real-time performance insights for all dealers in your network. Whether you manage sales, service, operations, finance, or after-sales teams, this dashboard helps you track results instantly and make better decisions—faster than ever before.
✨ Key Features of Dealer Network KPI Dashboard in Power BI
🚀 Fully Interactive Summary Page
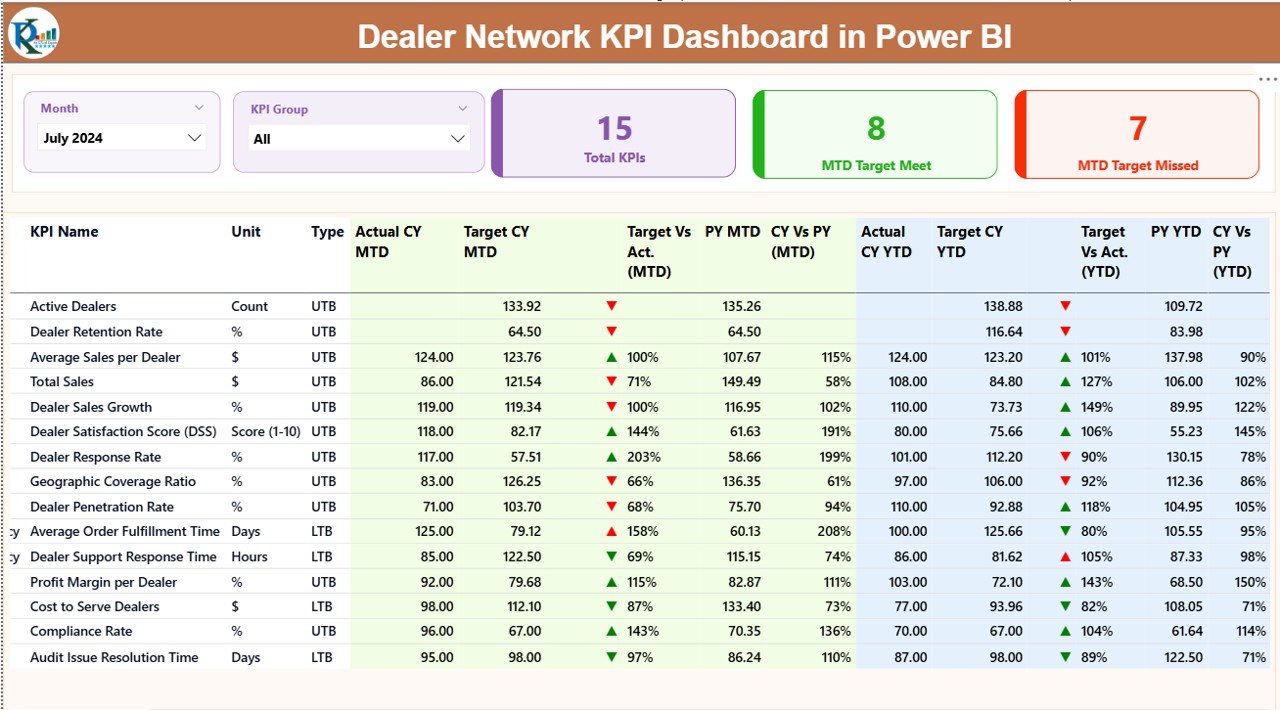
The main dashboard page provides slicers for Month and KPI Group, 3 performance cards (Total KPIs, MTD Target Met, MTD Target Missed), and a detailed KPI table that updates instantly whenever you change the filters.
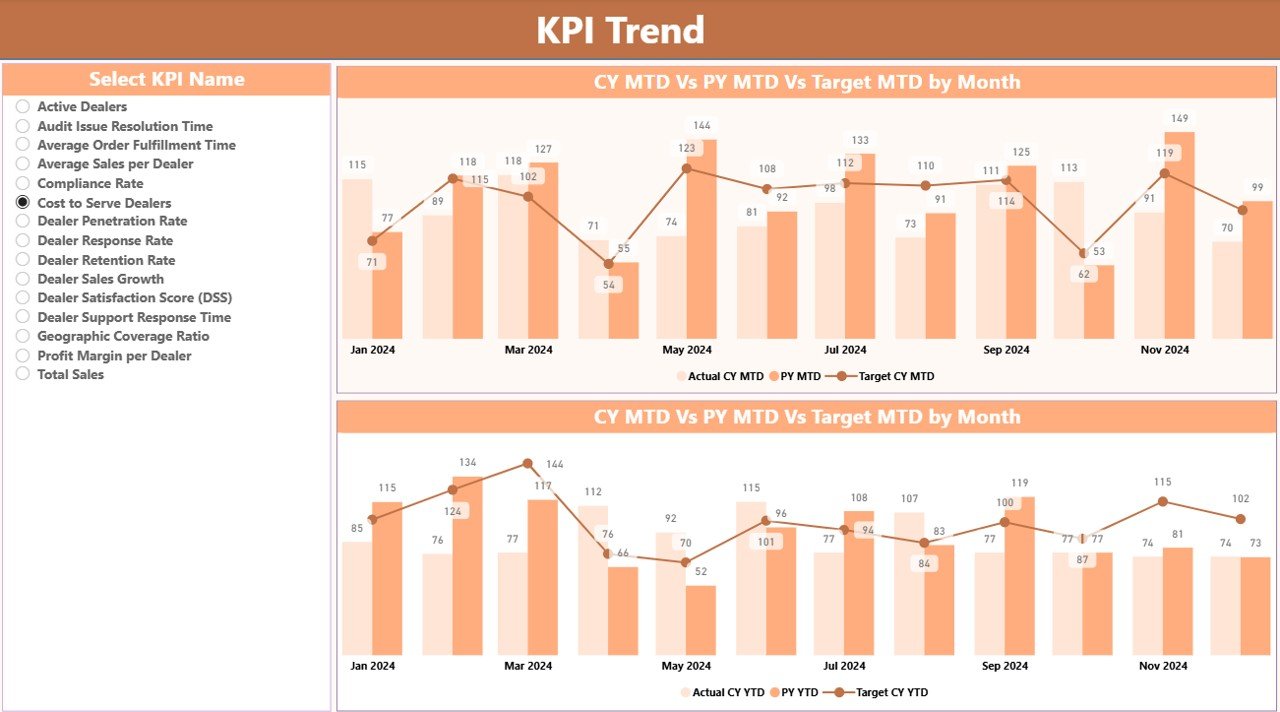
📊 Advanced KPI Trend Page
Two combo charts compare MTD and YTD values against target and previous year numbers. The KPI Name slicer allows you to evaluate long-term trends for any KPI with one click.
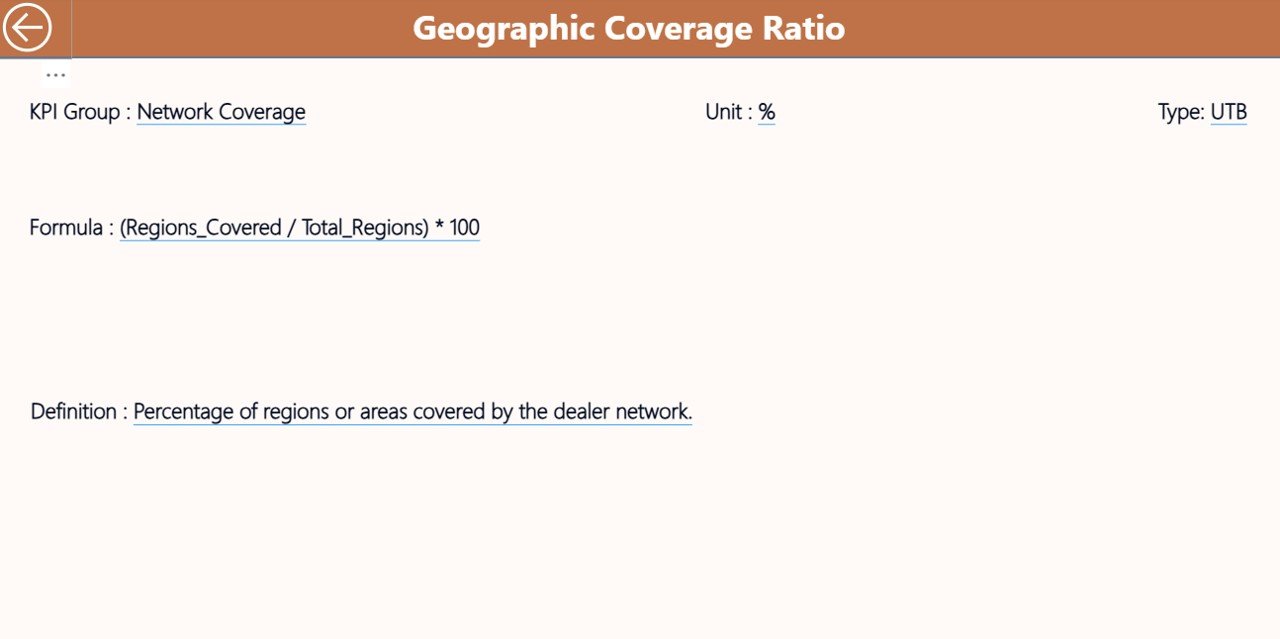
🔍 Drill-Through KPI Definition Page
Right-click on any KPI to open its definition, formula, unit, type (UTB/LTB), and calculation logic. A Back button brings you back to the Summary page.
🔄 One-Click Refresh
Update the Excel sheets (Actuals, Targets, KPI Definitions), refresh Power BI, and all visuals update instantly—no manual work required.
📦 What’s Inside the Dealer Network KPI Dashboard in Power BI
📁 1. PBIX Dashboard File
A fully designed, ready-to-use Power BI dashboard with 3 analytical pages.
📊 2. Excel Data Source File
Includes 3 structured sheets:
-
Input_Actual – MTD & YTD actual values
-
Input_Target – MTD & YTD targets
-
KPI Definition – All KPIs, formulas, units, and types
🖼️ 3. Interactive Visuals
-
Combo charts
-
KPI cards
-
Detailed KPI tables
-
Slicers for Month & KPI Group
-
Drill-through pages
📘 4. User-Friendly Navigation
Simple buttons, intuitive slicers, and automated tables make it easy for anyone to use—even without technical experience.
🛠️ How to Use the Dealer Network KPI Dashboard
🔹 Step 1: Update Excel Data
Enter actual values, targets, and KPI definitions in the provided sheets.
🔹 Step 2: Open Power BI
Load the PBIX file and click Refresh to update the dashboard.
🔹 Step 3: Use Month & KPI Group Slicers
Choose any month or KPI category to see updated values instantly.
🔹 Step 4: Review Summary Cards
Quickly identify how many KPIs are meeting or missing their targets.
🔹 Step 5: Explore Trends
Open the Trend Page to review MTD and YTD changes for selected KPIs.
🔹 Step 6: Drill Through for Definitions
Right-click any KPI to access its detailed formula and definition.
🎯 Who Can Benefit from This Dealer Network KPI Dashboard
👨💼 Dealer Managers
Track dealer performance, identify improvement areas, and monitor operational efficiency.
📈 Sales Teams
Compare actual vs. target numbers and plan future sales strategies more effectively.
🏢 Senior Leadership
Review high-level KPIs, monitor network-level performance, and make data-backed decisions.
📊 Business Analysts
Analyze trends, track MTD vs. YTD patterns, and highlight performance gaps.
🛠️ Operations Teams
Monitor service quality, customer satisfaction, and delivery KPIs across all dealers.
📘 Click here to read the Detailed Blog Post
(Insert your blog post link)
Visit our YouTube channel to learn step-by-step video tutorials
👉 Youtube.com/@PKAnExcelExpert


Reviews
There are no reviews yet.