Sales performance is the heartbeat of every successful business. To keep your sales strategy sharp and data-driven, you need a clear, organized, and interactive way to track results. The Sales KPI Scorecard in Google Sheets is a ready-to-use, dynamic solution built to help sales managers, teams, and executives monitor performance with precision.
This powerful Google Sheets template transforms your raw sales data into actionable insights through visual dashboards, automated indicators, and real-time analysis. Whether you manage a small team or a large sales department, this scorecard ensures that every goal, trend, and opportunity is easy to see and understand.
🔑 Key Features of the Sales KPI Scorecard
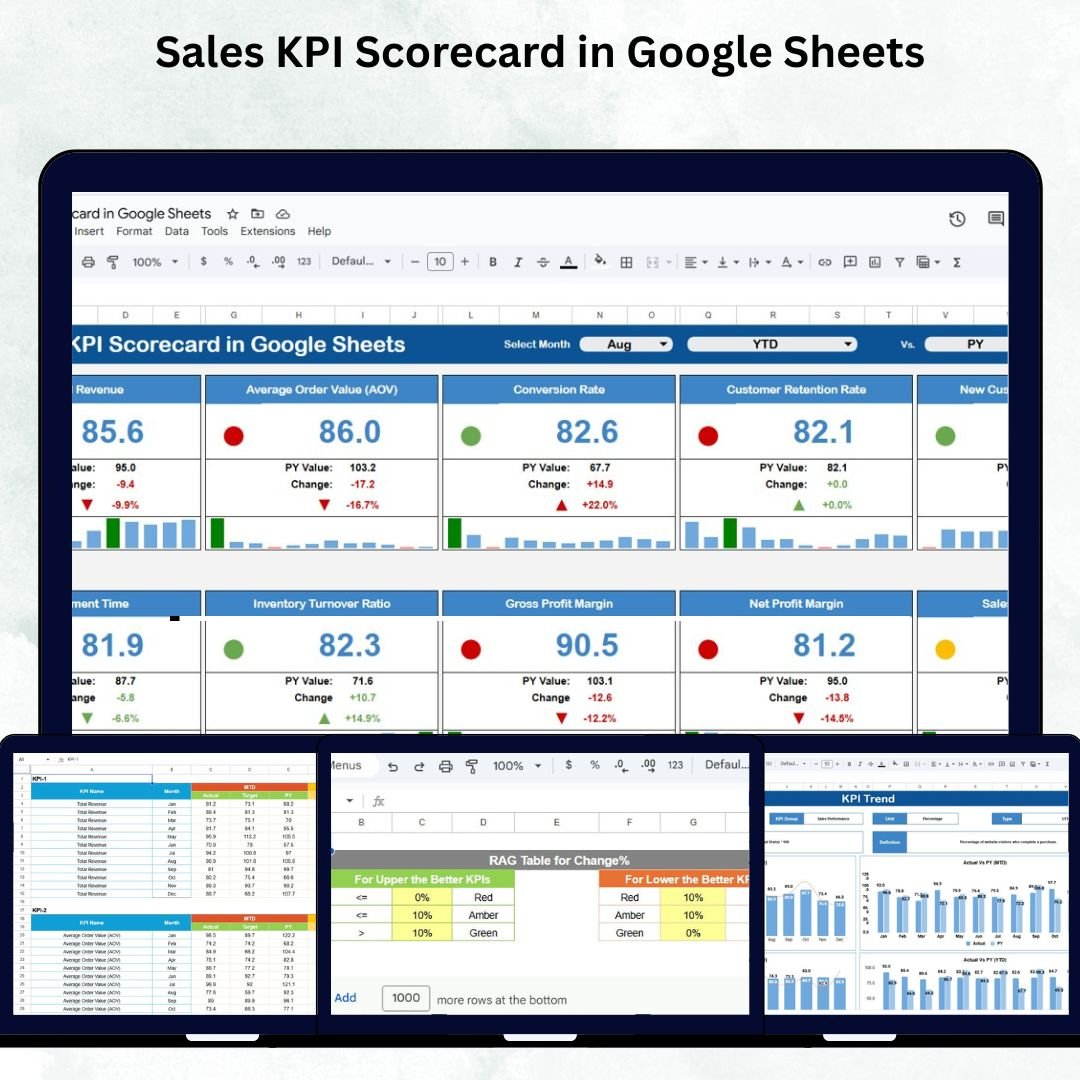
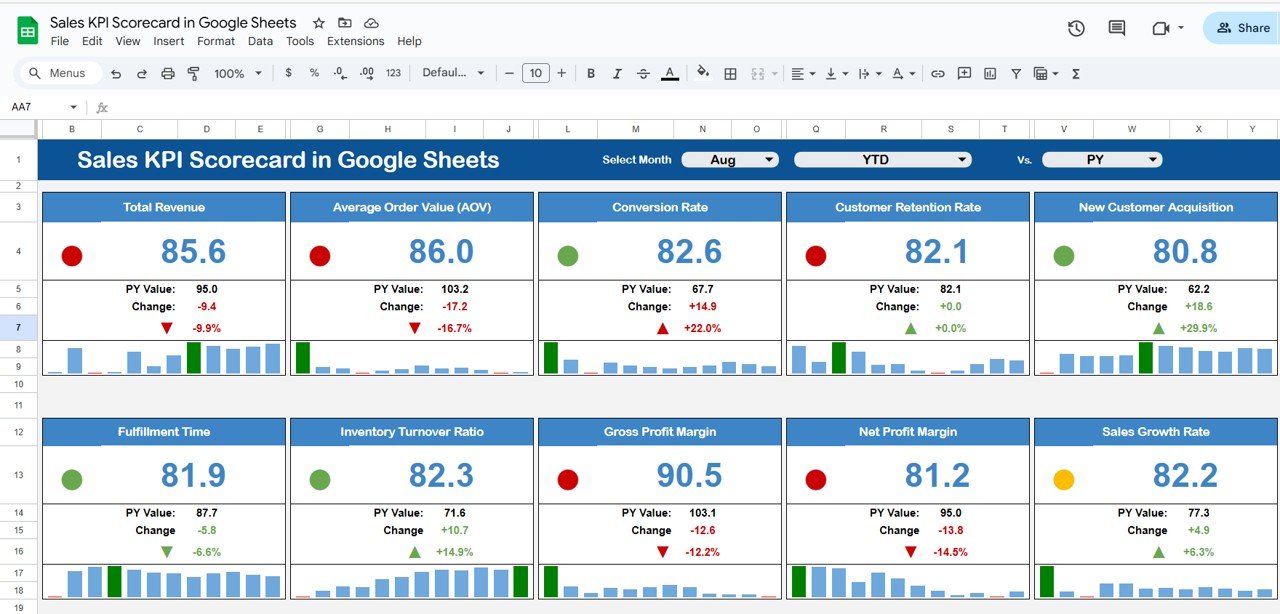
📊 1. Dashboard Sheet Tab – Performance Overview
The Dashboard Sheet is the centerpiece of your scorecard. It brings all critical metrics together for a clear snapshot of sales performance.
Highlights:
-
📆 Month Dropdown (Cell D3): Choose any month to dynamically update all KPIs.
-
🟢 Traffic Light Indicators: Green, Yellow, and Red show performance status at a glance.
-
🔼 Up/Down Arrows: Indicate improvement or decline compared to previous results.
-
🕒 MTD & YTD Toggle: Easily switch between Month-to-Date and Year-to-Date views.
-
💰 Ten Key Sales KPIs: Track essential metrics like Revenue Growth, Sales Conversion Rate, Pipeline Value, and Customer Retention.
This dashboard makes it effortless to identify what’s working, what needs improvement, and where to focus next.
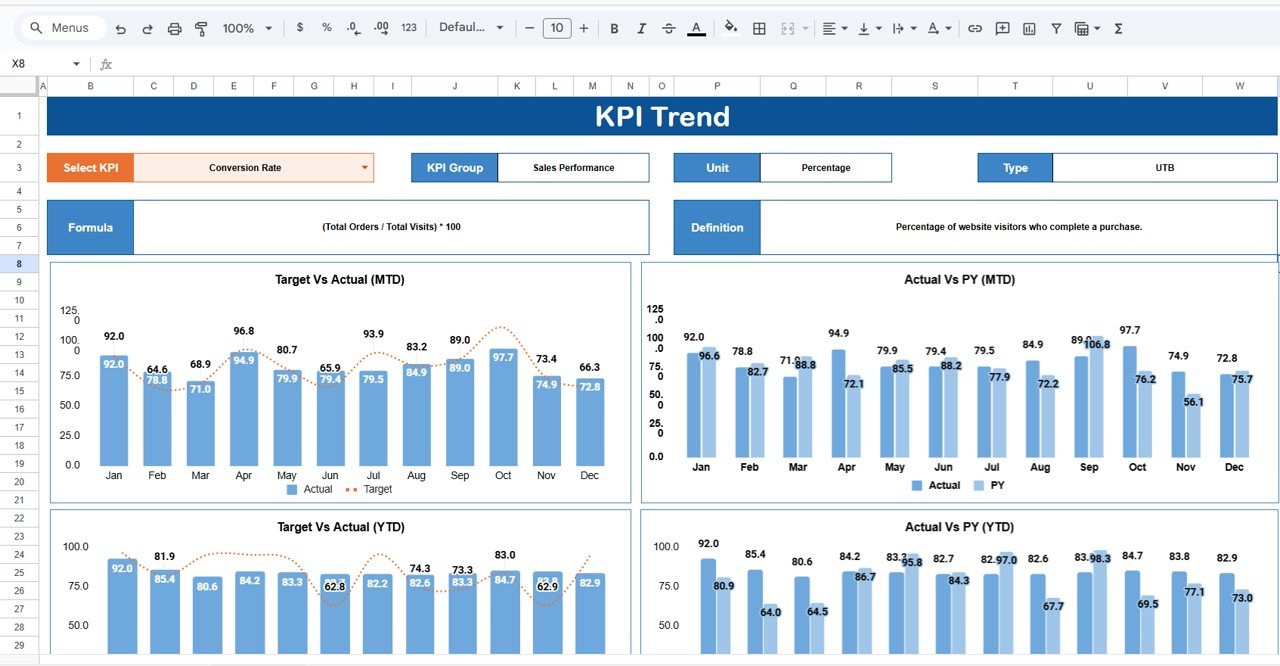
📈 2. KPI Trend Sheet Tab – Track Progress Over Time
The KPI Trend Sheet offers a detailed view of how each KPI evolves month by month.
Features Include:
-
🎯 KPI Selector (Cell C3): Pick any KPI from a dropdown to visualize trends.
-
📘 KPI Details Displayed: Group, Unit, Formula, Definition, and Type (UTB or LTB).
-
📉 Trend Charts: Show MTD, YTD, and previous year comparisons for in-depth analysis.
This tab provides a long-term perspective that helps you detect growth patterns and optimize sales strategies proactively.
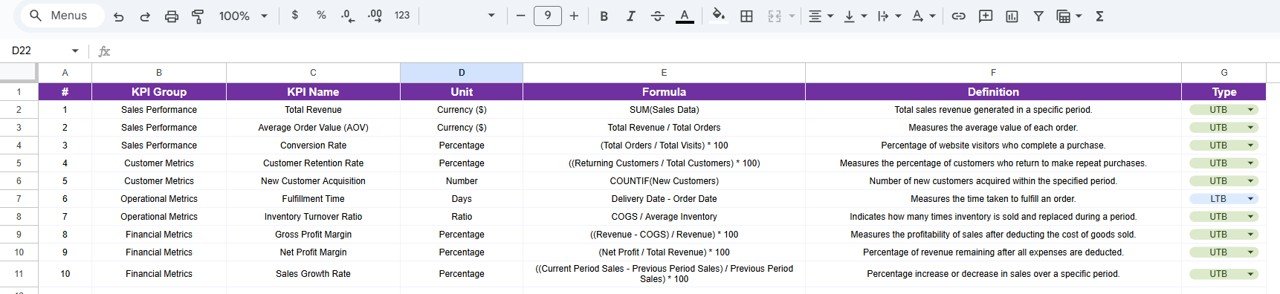
📚 3. KPI Definition Sheet Tab – Maintain Consistency
The KPI Definition Sheet ensures your entire team speaks the same performance language.
Includes Columns For:
-
KPI Name
-
KPI Group (e.g., Sales, Customer Success, Marketing)
-
Unit (%, $, Count)
-
Formula
-
Definition
-
Type (UTB – Upper the Better, LTB – Lower the Better)
This guarantees data accuracy and uniform reporting across the organization.
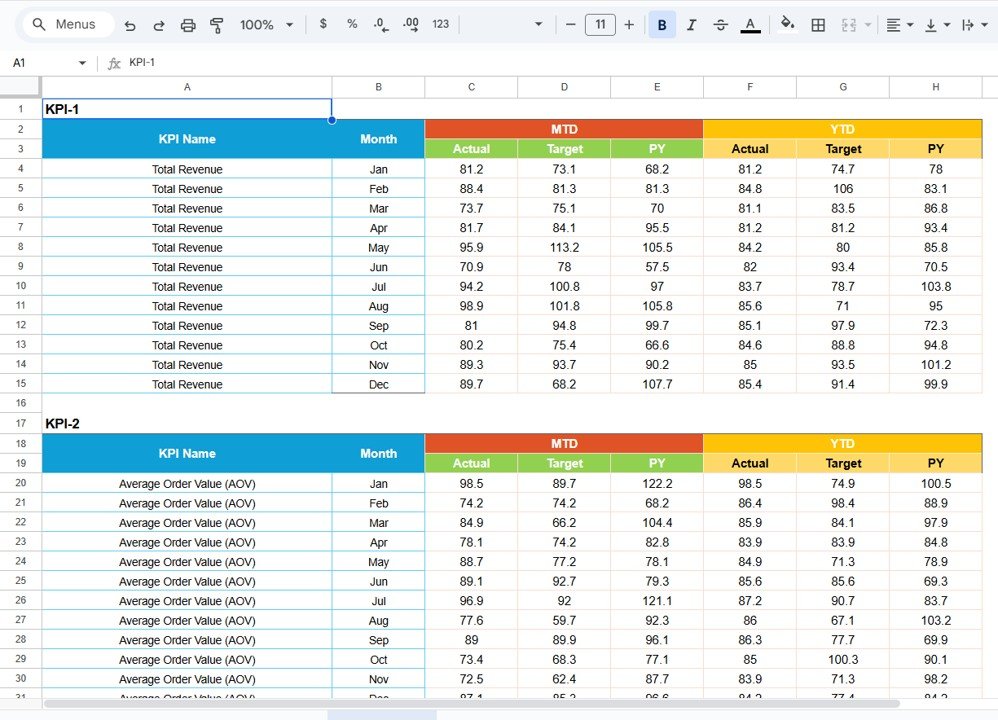
💾 4. Data Input Sheet Tab – Feed Your Dashboard
The Data Input Sheet is where you record all monthly metrics.
How It Works:
-
Enter Actual, Target, and Previous Year data for each KPI.
-
The dashboard automatically calculates performance gaps and trend visuals.
It’s a simple and structured way to ensure your dashboard stays updated with the latest numbers.
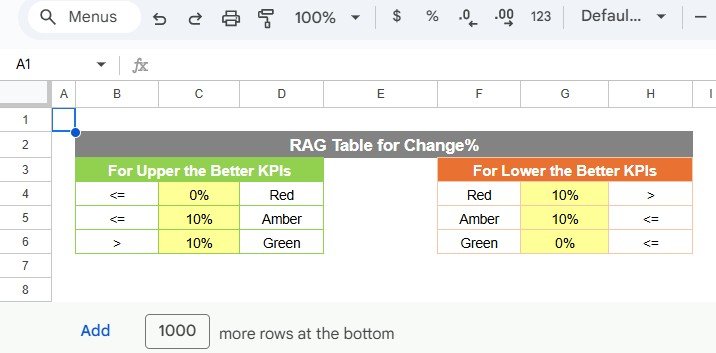
🎨 5. Color Settings Tab – Customize Visuals
Tailor the traffic light thresholds and arrow conditions according to your company’s standards.
You Can:
-
Adjust performance ranges for Red (Underperforming), Yellow (Average), and Green (Excellent).
-
Modify conditional formatting to match your brand theme.
This flexibility ensures the dashboard aligns with your organization’s visual and analytical style.
🌟 Advantages of the Sales KPI Scorecard
-
📍 Centralized Sales Data: Combine all metrics in one professional dashboard.
-
⚙️ Automated Insights: Charts and performance indicators refresh instantly.
-
📅 Flexible Time Analysis: Switch between monthly and yearly summaries easily.
-
🔄 Trend Identification: Recognize recurring success patterns or bottlenecks.
-
🤝 Team Collaboration: Multiple users can work together in real time via Google Sheets.
-
🎯 Strategic Alignment: Align sales KPIs directly with company targets.
-
💡 Action-Oriented Insights: Focus attention on KPIs that need the most improvement.
💡 Best Practices
✅ Update Monthly: Keep data current for accurate insights.
✅ Set SMART Targets: Ensure goals are specific, measurable, and realistic.
✅ Monitor Trends: Use KPI Trend Sheet for performance forecasting.
✅ Customize Indicators: Tailor thresholds to fit your sales strategy.
✅ Share Reports: Collaborate with leadership or clients through Google Sheets sharing.
✅ Review Regularly: Conduct team reviews based on MTD and YTD outcomes.
👨💼 Who Can Benefit
-
💼 Sales Managers: Evaluate team performance and improve coaching.
-
🧮 Executives: Track top-line growth and revenue trends.
-
📊 Analysts: Analyze conversion and retention metrics for actionable insights.
-
🤝 Sales Teams: Stay accountable and aligned with company goals.
🚀 How This Scorecard Helps
-
Builds transparency in performance tracking.
-
Simplifies data reporting and KPI presentation.
-
Strengthens decision-making with trend analysis.
-
Improves forecast accuracy and target achievement.
-
Enhances team productivity and motivation through visibility.
🔗 Click here to read the detailed blog post
Watch the step-by-step video Demo:


Reviews
There are no reviews yet.