In the fast-paced, data-driven world of modern journalism, understanding your newsroom’s performance is just as important as breaking the next big story. Whether you’re tracking readership, ad revenue, or social engagement, insights from your data shape every editorial and business decision.
That’s where the News and Journalism KPI Dashboard in Excel comes in. ⚡
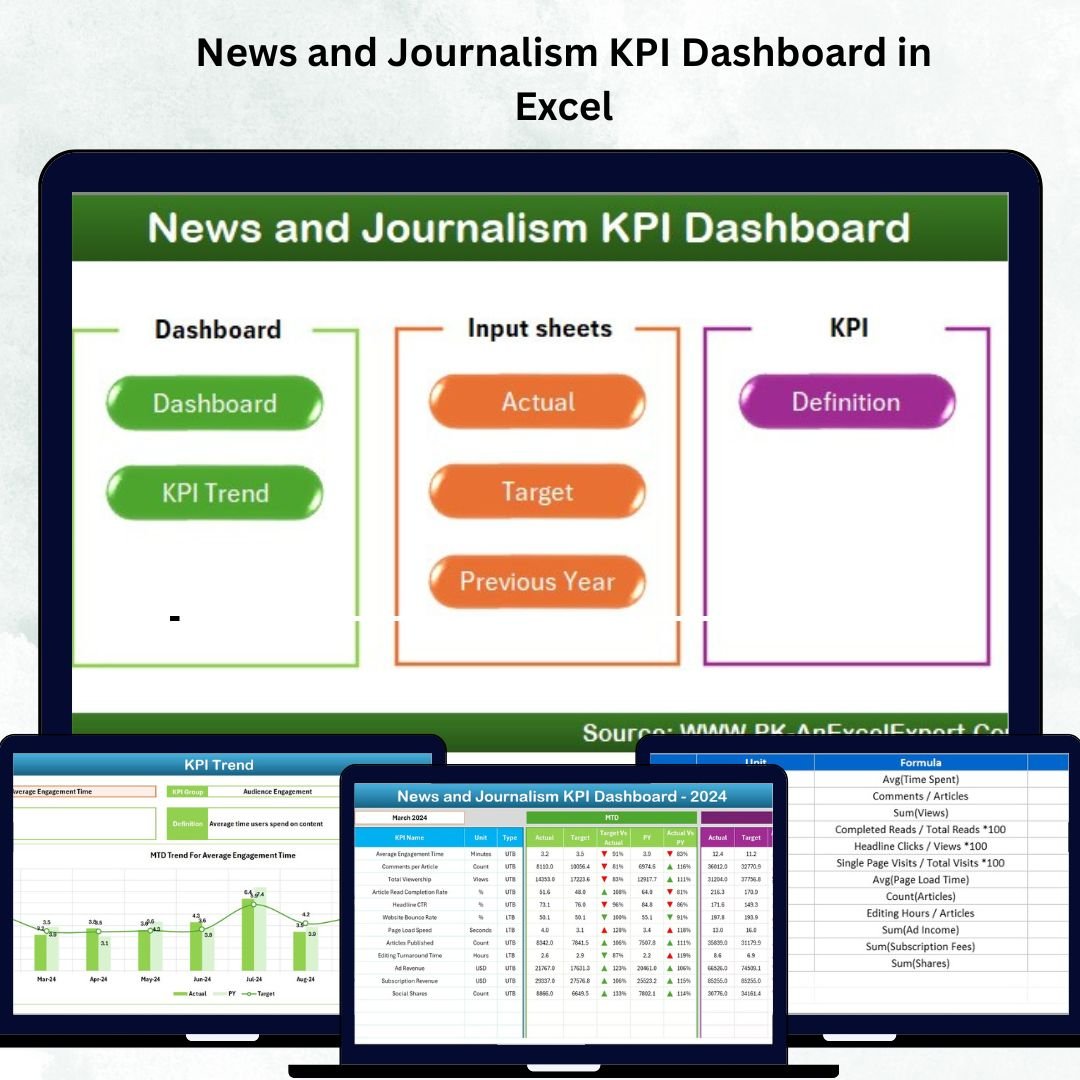
This ready-to-use Excel dashboard gives editors, analysts, and media managers a complete 360° view of key performance indicators (KPIs) — all in one place. With dynamic charts, dropdowns, and automatic comparisons, it helps you visualize how well your publication is performing month after month.
Built entirely in Microsoft Excel, the dashboard requires no coding and provides an affordable, powerful alternative to complex analytics software. It’s the perfect tool for tracking your newsroom’s editorial quality, audience growth, and business success.
⚙️ Key Features of the News and Journalism KPI Dashboard in Excel
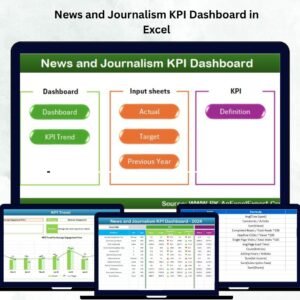
🏠 Interactive Home Page – Use six clickable buttons to navigate seamlessly between Dashboard, KPI Trend, Input Sheets, and Definitions.
📊 Comprehensive Dashboard View – Displays all MTD (Month-to-Date) and YTD (Year-to-Date) performance metrics in one visual layout.
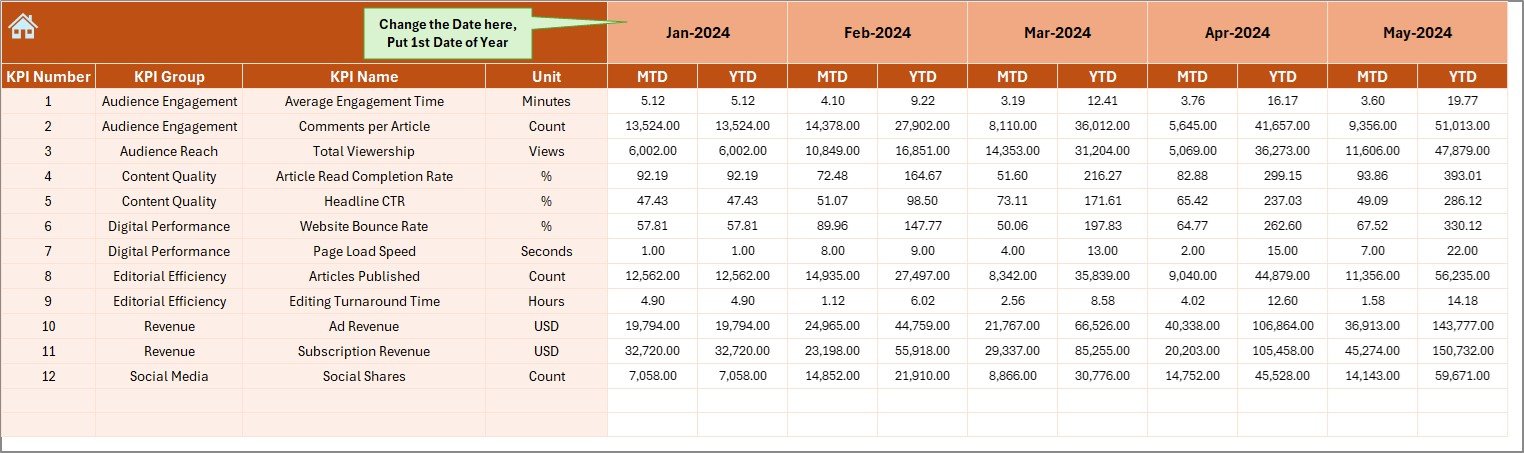
📆 Dynamic Month Selector (Cell D3) – Instantly switch between months for real-time analysis.
🎯 Actual vs Target & Previous Year Comparison – Compare current performance against goals and last year’s results.
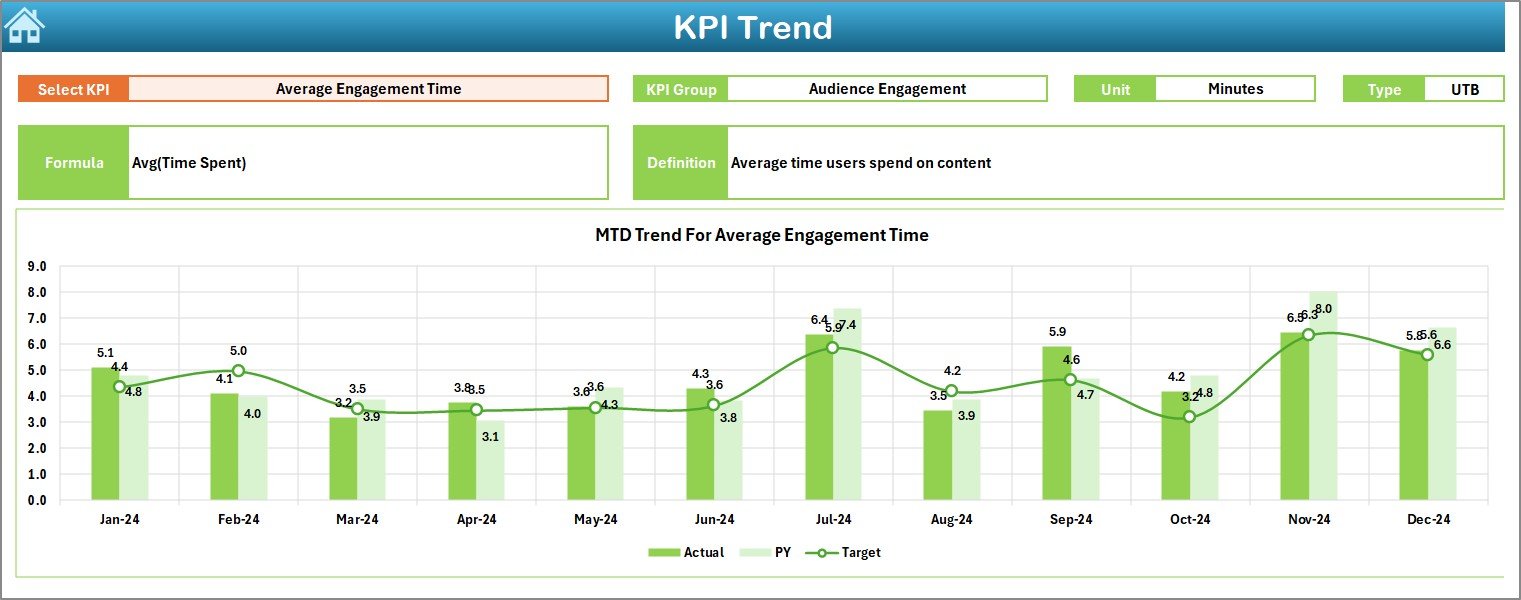
📈 Trend Analysis Page – Visualize KPI behavior over time using combo charts for MTD and YTD metrics.
📋 Input Sheets for Data Entry – Separate sheets for Actuals, Targets, and Previous Year data ensure structured and accurate updates.
📘 KPI Definition Sheet – Acts as your newsroom’s KPI dictionary, keeping all formulas, units, and definitions standardized.
🔄 Automatic Calculations – The dashboard updates instantly when new data is added — no manual recalculations needed.
💡 Conditional Formatting & Arrows – Visual indicators show growth (▲) or decline (▼) in each KPI.
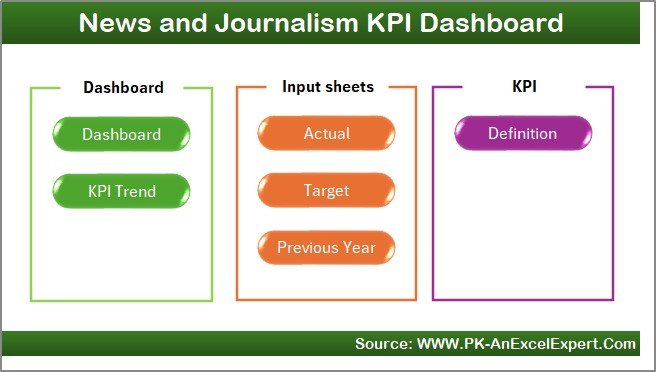
📂 What’s Inside the News and Journalism KPI Dashboard in Excel
🏠 1. Home Sheet:
An intuitive navigation hub featuring buttons that link to all key sections. Makes it simple for journalists and non-technical users to explore the dashboard.
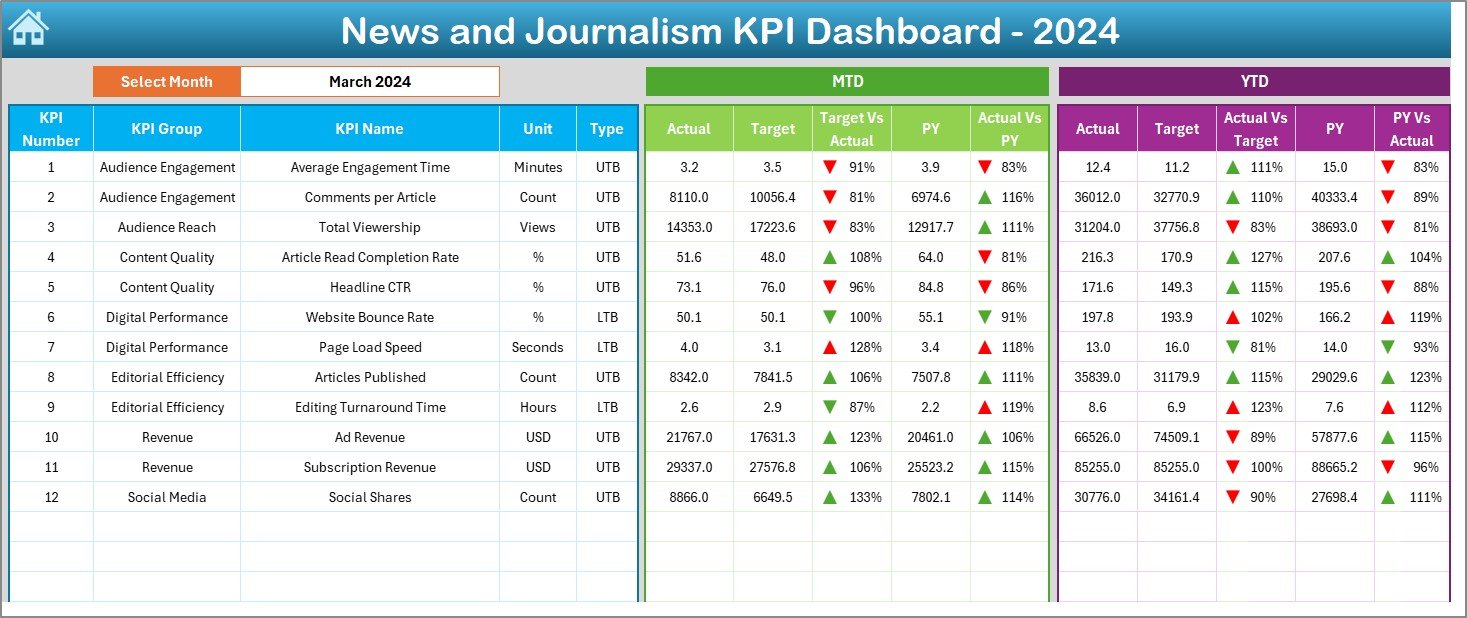
📊 2. Dashboard Sheet:
The core analysis sheet. Displays MTD and YTD actuals, targets, and previous year data with arrows, color indicators, and achievement percentages.
Ideal for tracking audience, editorial, engagement, and revenue metrics in one view.
📈 3. KPI Trend Sheet:
Select any KPI from a dropdown (Cell C3) and see historical performance trends via two combo charts — MTD and YTD. Perfect for identifying long-term patterns and seasonal performance shifts.
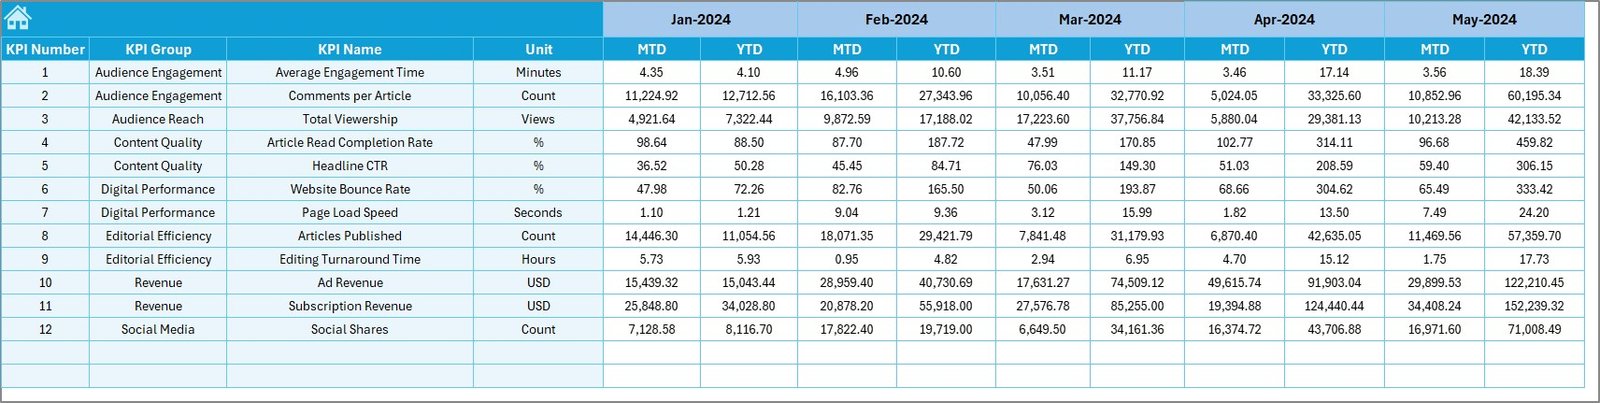
🧾 4. Actual Numbers Input Sheet:
Input real data for each KPI on a monthly basis. All visualizations are powered by this sheet.
🎯 5. Target Sheet:
Set measurable performance goals — whether it’s page views, ad revenue, or engagement rates — to align editorial and business objectives.
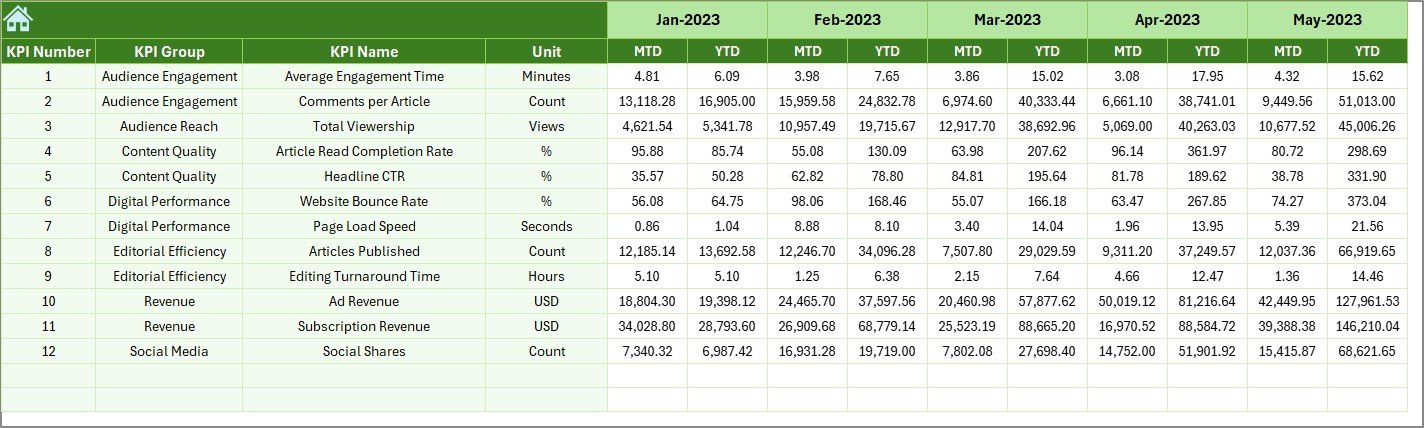
📅 6. Previous Year Numbers Sheet:
Compare current metrics with historical performance to identify year-over-year growth or challenges.
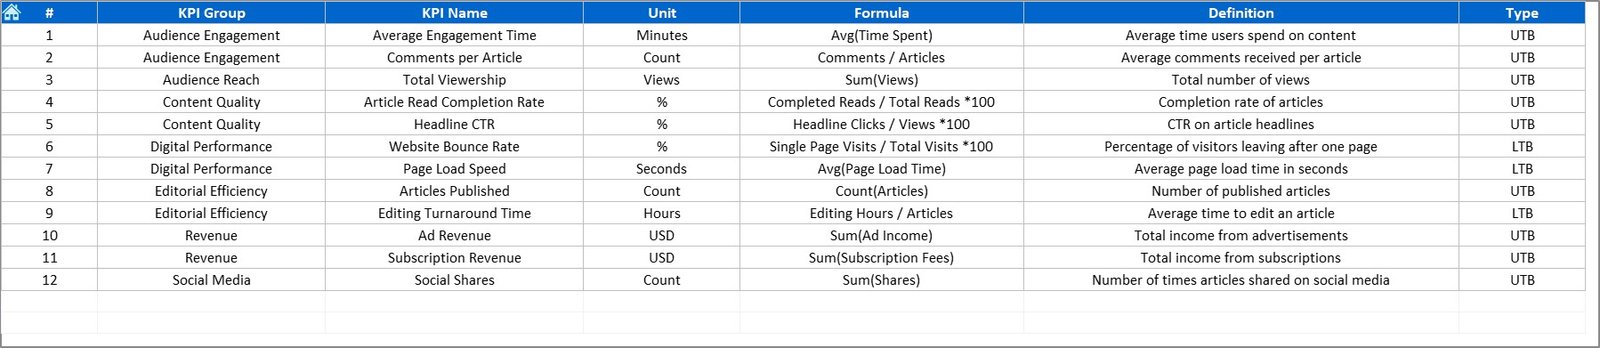
📘 7. KPI Definition Sheet:
Define KPI names, formulas, units, and classifications (UTB/LTB) so everyone in the organization uses consistent metrics.
Together, these seven sheets create a structured, automated framework for data-driven newsroom management.
🧭 How to Use the News and Journalism KPI Dashboard in Excel
1️⃣ Open the File: Review all seven sheets to understand structure and flow.
2️⃣ Define KPIs: Fill the KPI Definition sheet with metrics relevant to your publication.
3️⃣ Input Data: Enter actual, target, and previous year numbers in their respective sheets.
4️⃣ Select Month: Choose the desired month from the dropdown in Cell D3.
5️⃣ Analyze Performance: View results on the Dashboard Sheet, complete with MTD/YTD comparisons and visual indicators.
6️⃣ Study Trends: Use the KPI Trend sheet for historical insights and forecasting.
7️⃣ Update Monthly: Refresh your data regularly to maintain accurate tracking.
💡 Tip: Store the dashboard on OneDrive or Google Drive for real-time collaboration across editorial and business teams.
👥 Who Can Benefit from This Dashboard
🧑💼 Editors-in-Chief: Monitor editorial performance, story output, and quality.
📊 Audience Analysts: Track audience reach, engagement rate, and return visits.
💼 Business & Ad Managers: Analyze revenue trends and advertising performance.
📱 Marketing Teams: Evaluate campaign effectiveness and social engagement.
🖋️ Freelance Journalists & Startups: Keep track of personal or small team publishing performance.
Whether you’re managing a digital media site, newspaper, or broadcast outlet, this dashboard keeps your team focused, informed, and aligned.


Reviews
There are no reviews yet.