
In today’s interconnected business environment, Shared Services teams are the backbone of operational excellence. Whether managing HR, Finance, IT, Procurement, or administrative support — consistency, cost control, and efficiency are critical. But tracking performance across departments can be a daunting challenge.
That’s why the Shared Services KPI Scorecard in Excel is the ultimate solution! 💡 Designed to bring all your KPIs into one centralized dashboard, this ready-to-use template helps organizations monitor productivity, identify inefficiencies, and enhance service delivery — all in Microsoft Excel. No complex systems, no coding — just smart analytics that drive real results.
⚙️ Key Features of the Shared Services KPI Scorecard in Excel
📊 Comprehensive Performance View – Get an all-in-one summary of your shared services performance across HR, Finance, IT, and more.
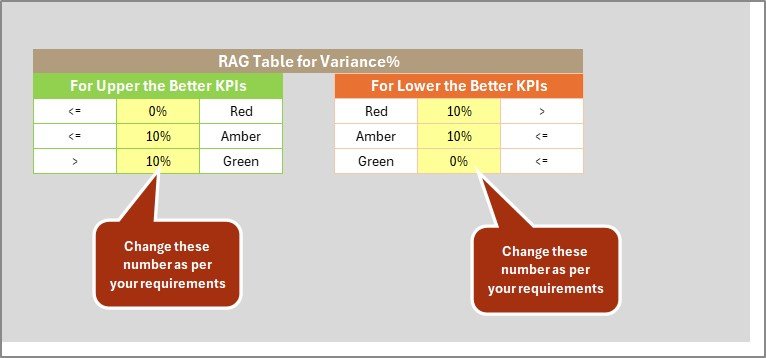
🎯 Actual vs. Target Tracking – Instantly spot gaps and progress through dynamic color codes and icons.
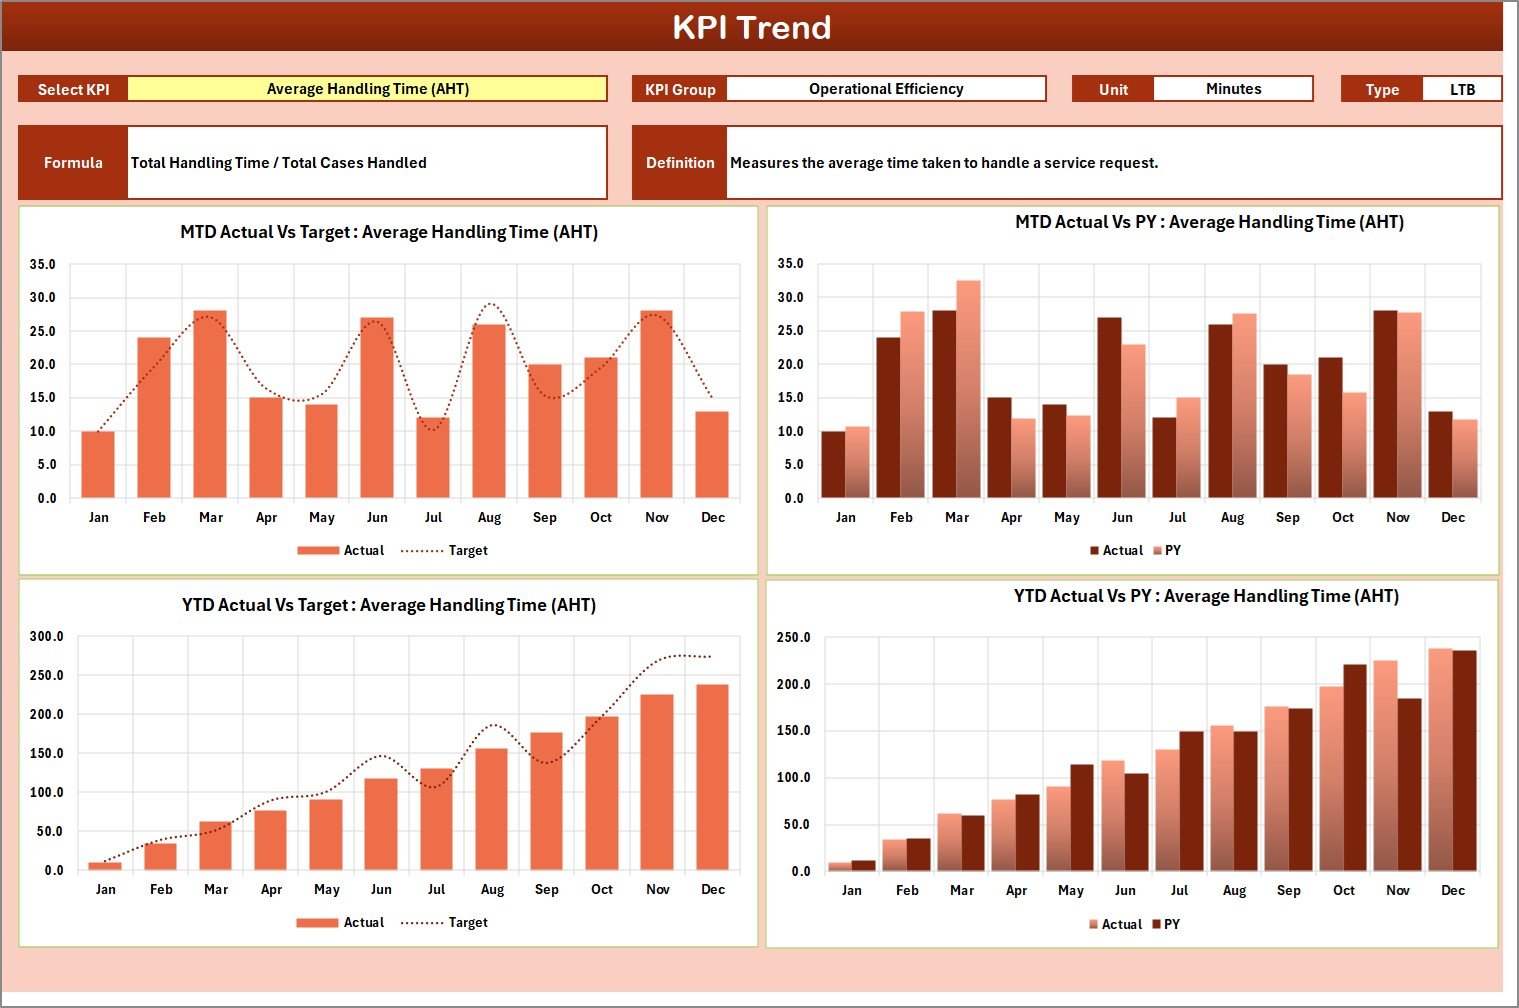
📈 Trend Analysis Charts – Visualize performance over time for every KPI using interactive charts.
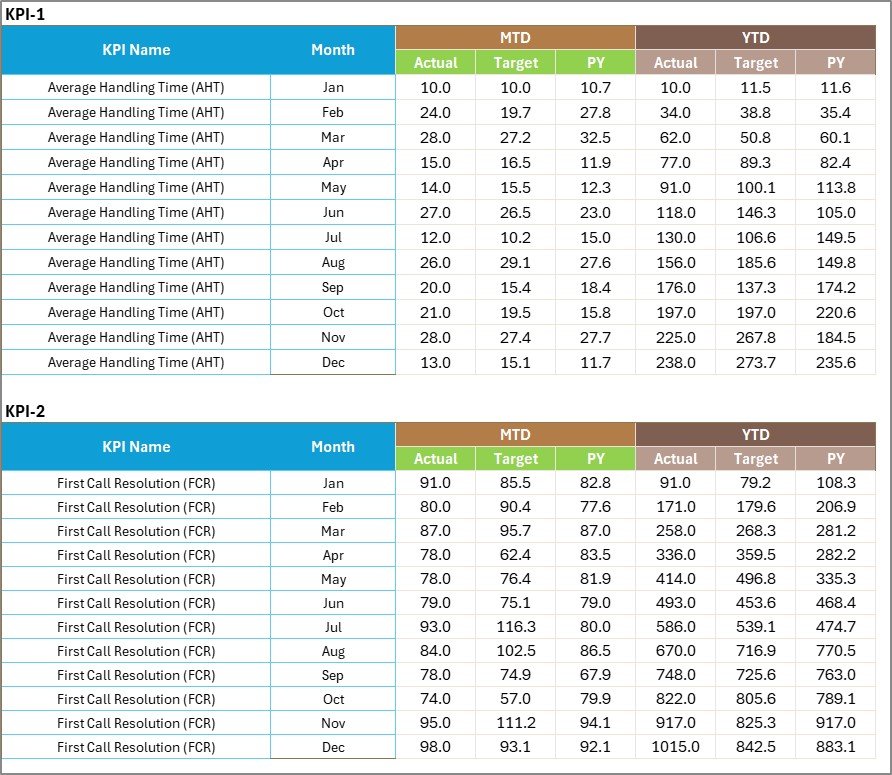
📆 MTD & YTD Analytics – View monthly and year-to-date results for a complete performance picture.
🔍 Dropdown Selectors – Analyze data by department, month, or year with easy-to-use filters.
💡 Conditional Formatting Indicators – Green, yellow, and red visuals quickly show which areas need attention.
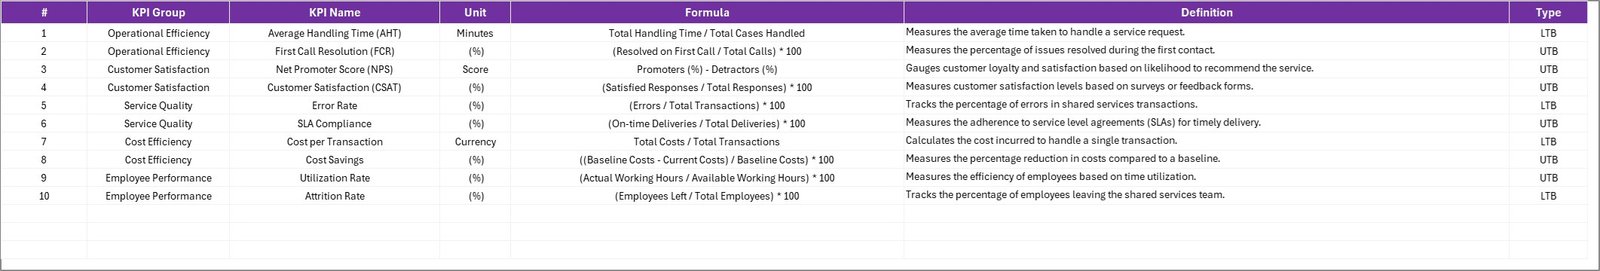
📘 KPI Definition Sheet – Understand exactly how each KPI is calculated for full transparency.
⚙️ Automatic Calculations – Built-in formulas handle ratios and percentages automatically.
🧩 Excel-Based Flexibility – Fully customizable; add new KPIs or departments as your organization grows.
📂 What’s Inside the Shared Services KPI Scorecard in Excel
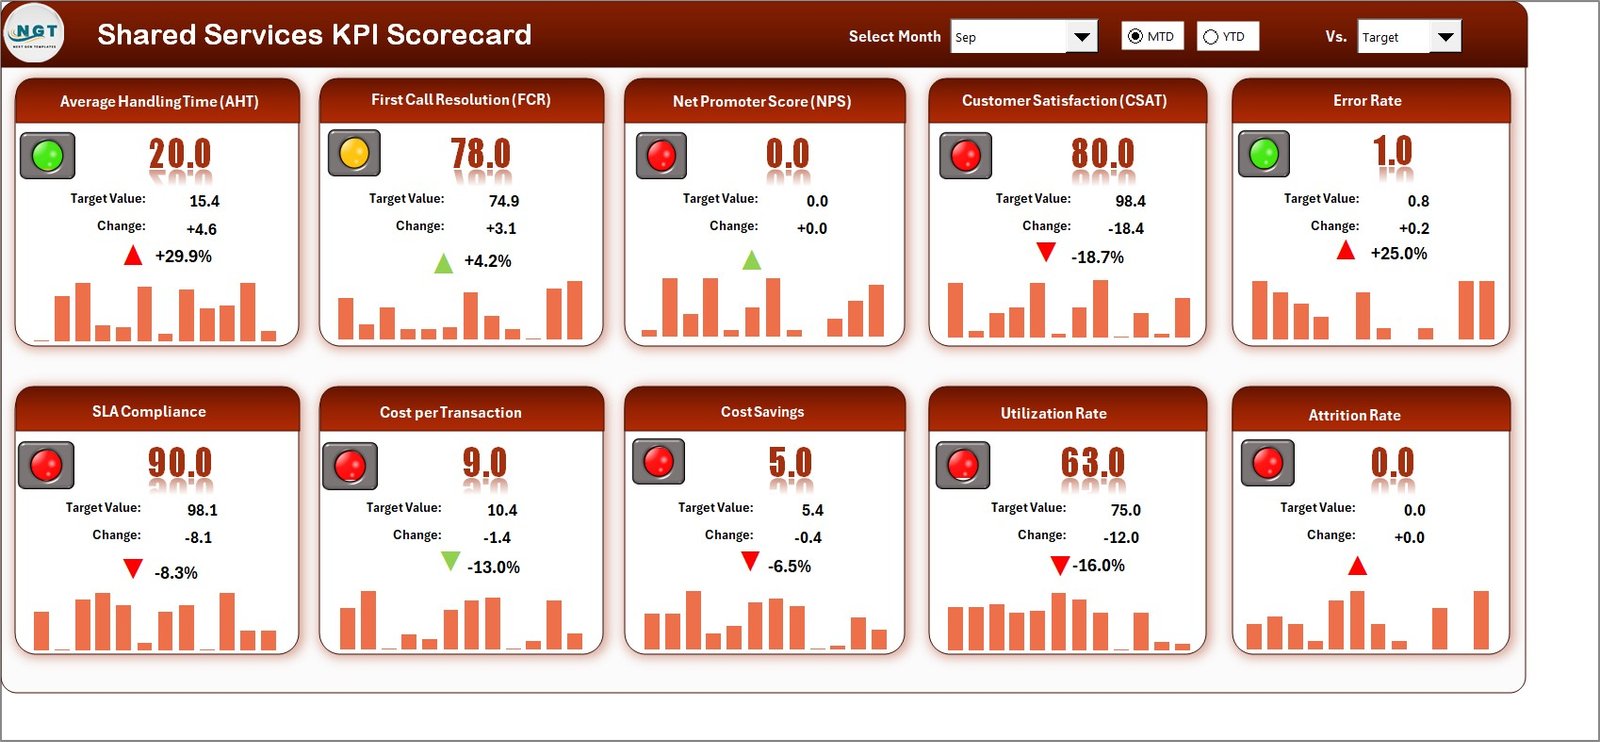
📋 1. Scorecard Sheet – The main performance dashboard displaying Actual vs Target data for all KPIs. Includes dropdowns for month and MTD/YTD view plus color-coded results for clarity.
📈 2. KPI Trend Sheet – Analyze trends over time. Select any KPI from a dropdown to see its definition, type (UTB/LTB), and graphical trends versus Target and Previous Year.
📊 3. Input Data Sheet – Record monthly Actuals and Targets here. Once entered, data automatically feeds the dashboard and trend charts.
📘 4. KPI Definition Sheet – Acts as your internal KPI dictionary, defining each metric, its unit, and formula — ensuring alignment across all departments.
This structured layout guarantees accurate, efficient, and standardized reporting every month.
🧭 How to Use the Shared Services KPI Scorecard in Excel
1️⃣ Enter Actual & Target Data – Input monthly results in the Input Data Sheet.
2️⃣ Select Month or Year View – Use dropdown menus to analyze any reporting period.
3️⃣ Review Dashboard Results – Instantly see performance with color-coded indicators.
4️⃣ Check Trends – Explore KPI movements and identify improvement opportunities.
5️⃣ Share Reports – Export visuals to PDF or presentations for quick sharing with leadership.
💡 Pro Tip: You can easily link this Excel file with Power Query or Power BI for automated and real-time updates.
👥 Who Can Benefit from This Scorecard
🏢 Shared Service Center Managers – Monitor cross-functional performance at a glance.
💼 Finance & Operations Heads – Identify cost-saving opportunities and efficiency gaps.
🧑💻 HR & IT Leaders – Ensure your teams deliver consistent service levels and meet SLAs.
📊 Business Analysts – Leverage KPI trends for forecasting and strategic reporting.
🏛️ Corporate Executives – Gain a unified view of all support functions in one dashboard.
This tool turns departmental chaos into clarity — promoting accountability, transparency, and continuous improvement across your organization.


Reviews
There are no reviews yet.