Public transportation plays a vital role in urban life — connecting communities, supporting economic activity, and reducing environmental impact. But managing such a complex network requires precision, transparency, and real-time insights. The Public Transit KPI Dashboard in Excel delivers exactly that — a ready-to-use performance management system that transforms operational data into clear, actionable intelligence.
This powerful Excel template empowers transport authorities, planners, and consultants to monitor key metrics such as ridership, punctuality, fuel efficiency, cost control, and customer satisfaction — all in one interactive dashboard. Whether you’re managing city buses, metro services, or regional transit, this tool helps you stay data-driven and efficient.
⚙️ Key Features of Public Transit KPI Dashboard in Excel
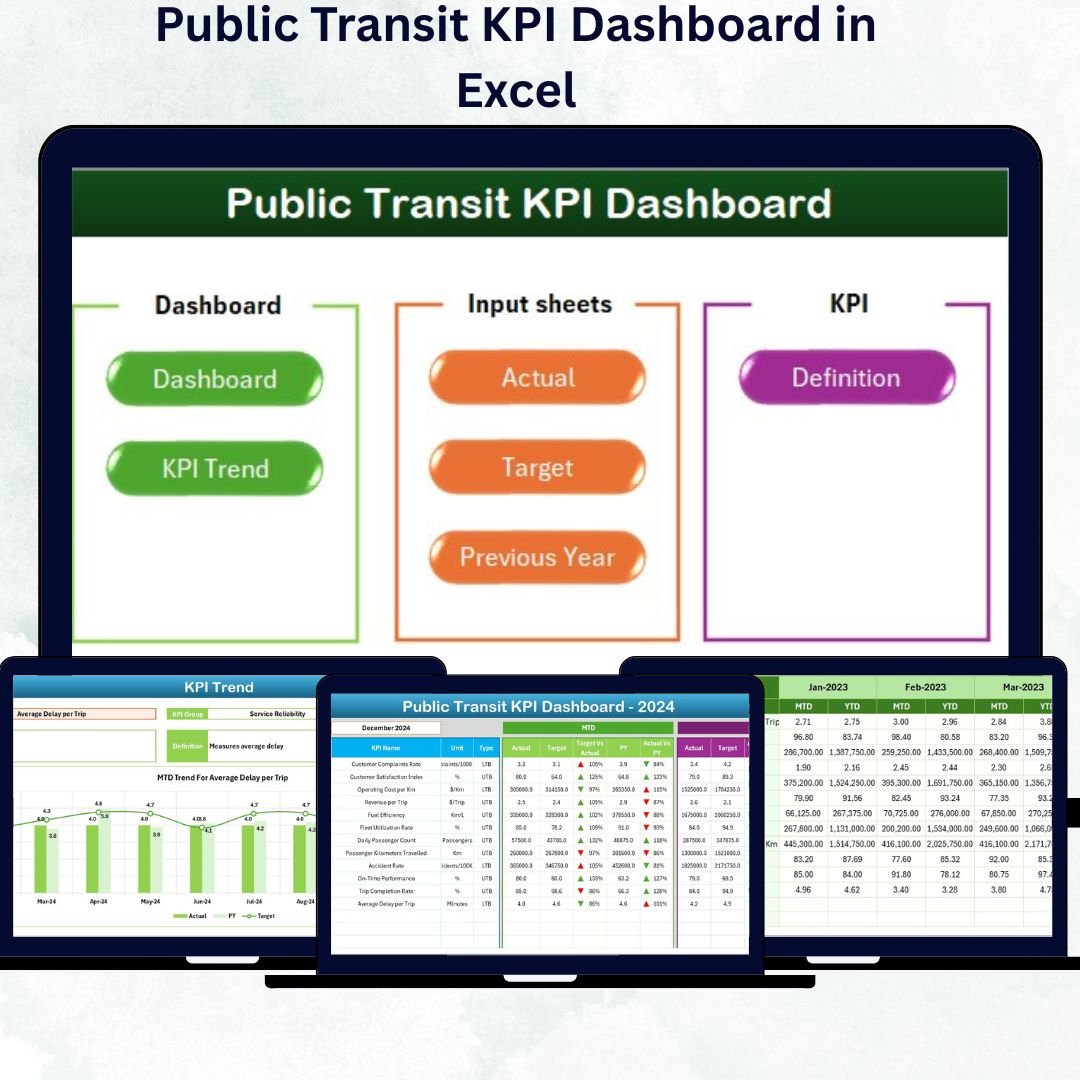
✅ 7 Fully-Structured Worksheets: Home, Dashboard, KPI Trend, Actual Input, Target, Previous Year, and KPI Definition.
✅ Interactive Navigation Buttons: Jump between sheets instantly from the Home page.
✅ Automated Month Selection: Update visuals dynamically by choosing any month from the dropdown (cell D3).
✅ MTD & YTD Analytics: Track Month-to-Date and Year-to-Date performance for Actual, Target, and Previous Year.
✅ Smart Visual Indicators: Green = Achieved, Red = Missed; up/down arrows show improvement or decline.
✅ Customizable KPIs: Add or remove indicators, modify formulas, or adjust visuals easily.
✅ Trend Analysis: Dual charts display monthly trends for Actual vs Target vs Previous Year values.
✅ Automated Calculations: Built-in formulas eliminate manual reporting.
✅ Professional Layout: Clean design suitable for board reviews and departmental presentations.
✅ Low-Cost & Scalable: Works in any Excel version — no additional software required.
This dashboard gives decision-makers a 360° view of transit operations, helping improve reliability, efficiency, and passenger experience.
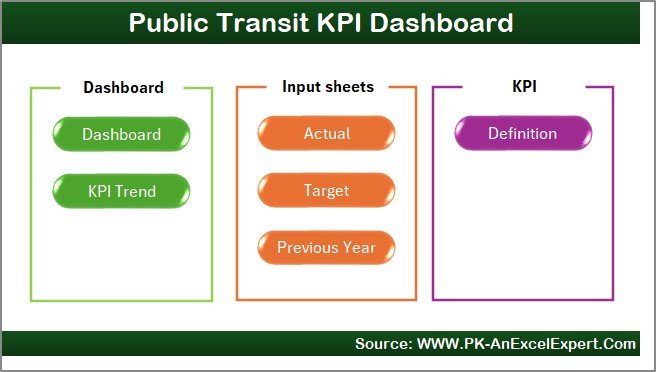
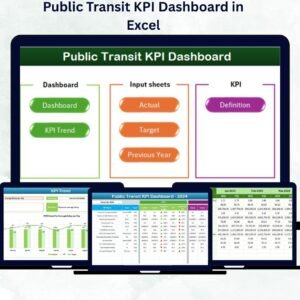
📊 What’s Inside the Public Transit KPI Dashboard Template
The file contains seven interactive sheets, each serving a specific analytical function 👇
1️⃣ Home Sheet – Easy Navigation
Acts as the dashboard’s command center.
-
Six buttons link directly to Dashboard, KPI Trend, Actual Input, Target, Previous Year, and KPI Definition.
-
Simplifies navigation and enhances user experience with a professional, app-like design.
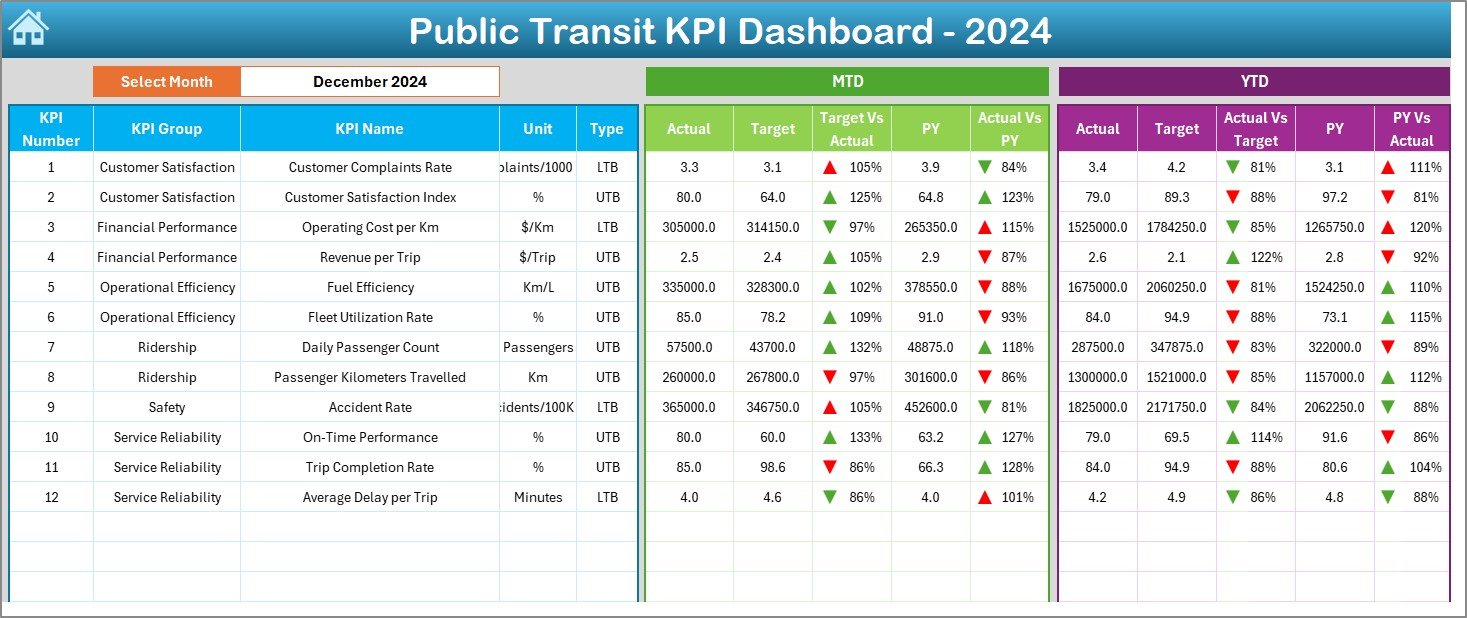
2️⃣ Dashboard Sheet – System-Wide Overview
Your main visualization hub.
-
Month Dropdown (D3): Select any month to refresh all visuals.
-
MTD & YTD Comparisons: Actual vs Target vs Previous Year side by side.
-
Conditional Formatting: Color cues and arrows show instant performance status.
Ideal for top management and quick reporting.
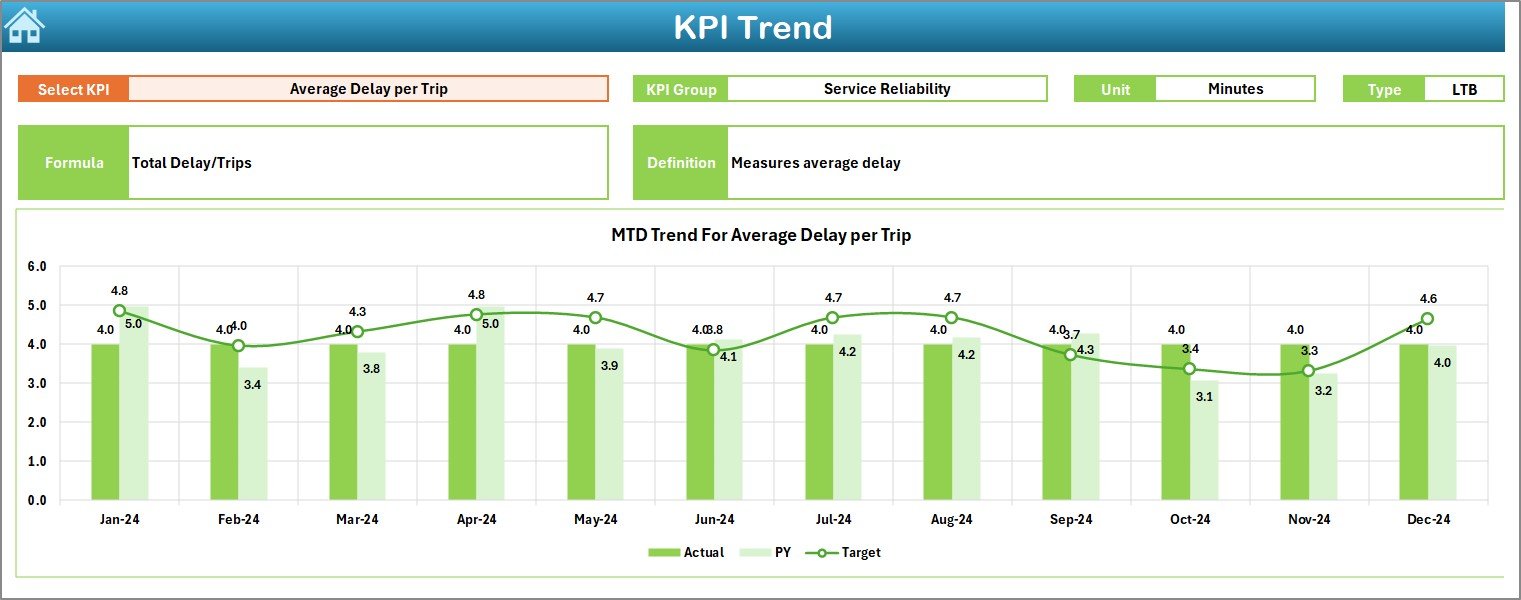
3️⃣ KPI Trend Sheet – Track Progress Over Time
Dive deeper into performance trends.
-
KPI Selector (C3): Pick any metric to analyze.
-
Dual Trend Charts: Display monthly MTD and YTD variations.
-
KPI Details: Group, Unit, Type (UTB/LTB), Formula, and Definition.
Identify seasonal trends, growth patterns, and recurring challenges effortlessly.
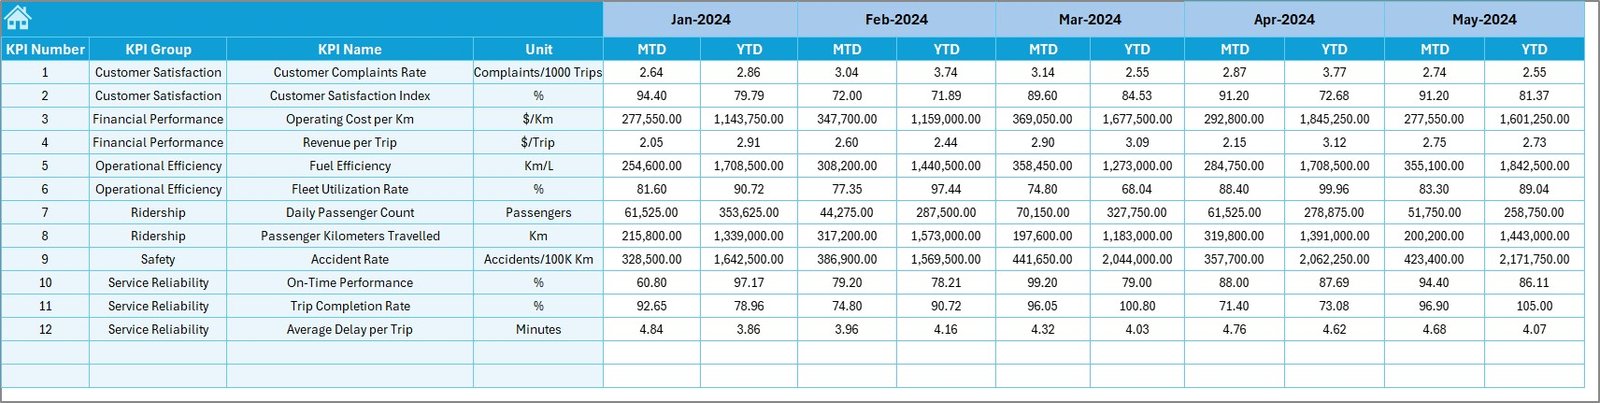
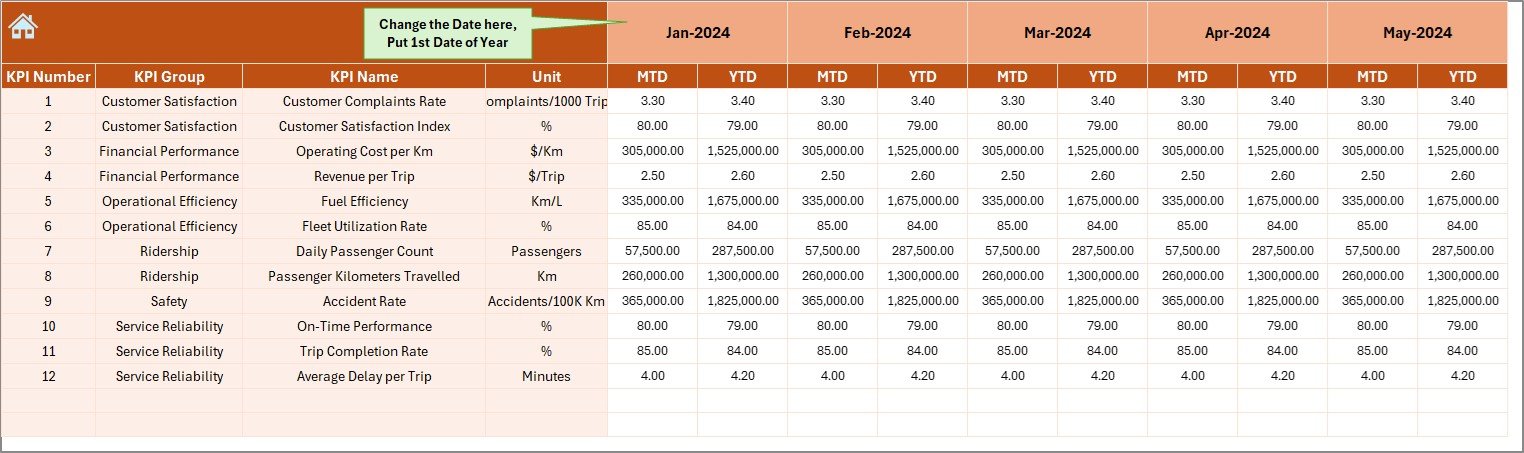
4️⃣ Actual Numbers Input Sheet – Simplified Data Entry
Central place for entering monthly performance data.
-
Input Actual values for MTD and YTD by KPI.
-
Use cell E1 to adjust the starting month.
-
Structured layout minimizes manual errors.
5️⃣ Target Sheet – Define Goals
Set monthly and yearly benchmarks.
-
Enter MTD and YTD targets for each KPI.
-
Enables quick variance and gap analysis.
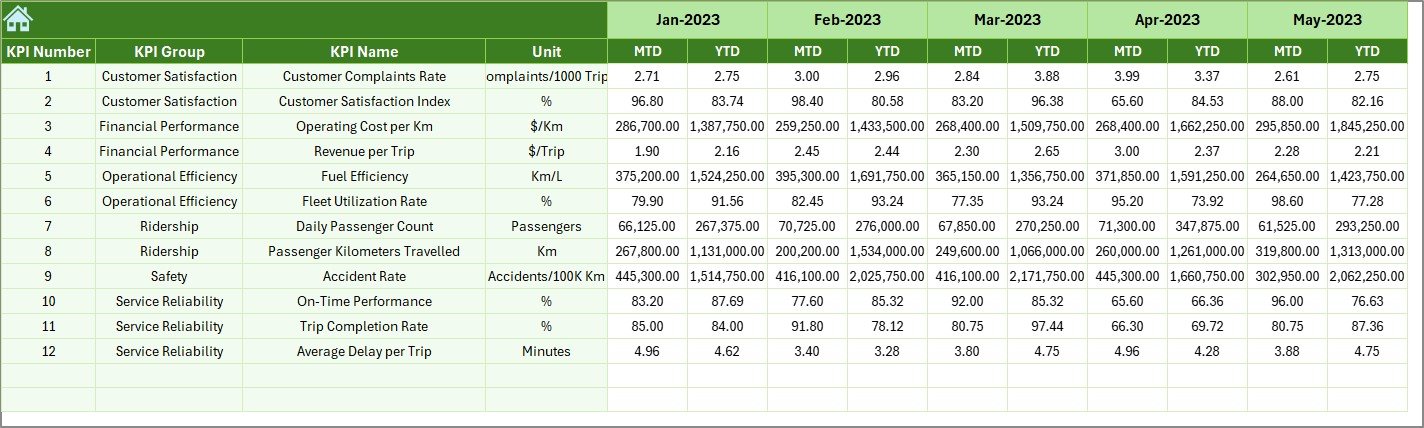
6️⃣ Previous Year Sheet – Historical Comparison
Benchmark performance with past results.
-
Record last year’s MTD & YTD data.
-
The dashboard auto-generates Year-over-Year comparisons for continuous improvement tracking.
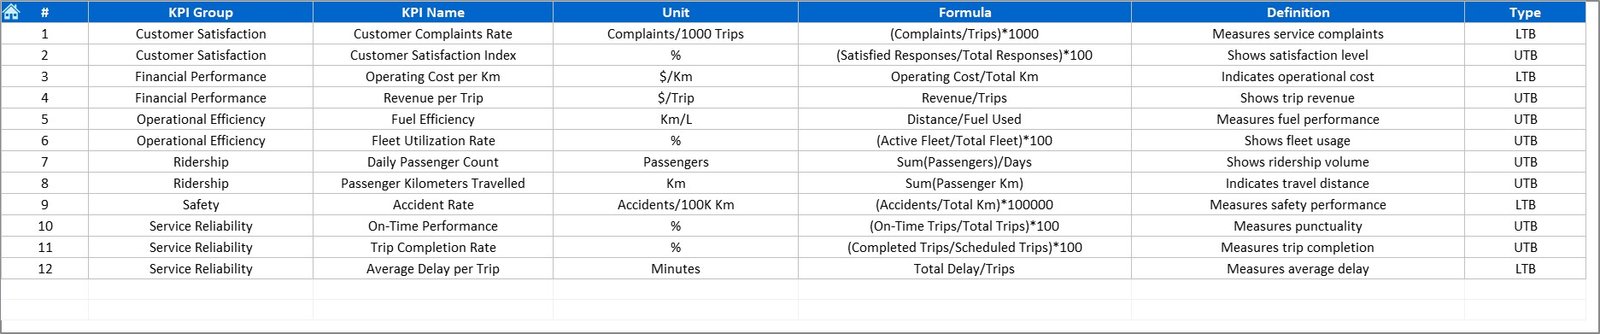
7️⃣ KPI Definition Sheet – Complete Transparency
Document every metric for clarity.
-
Fields: KPI Name, Group, Unit, Formula, Definition, Type (UTB/LTB).
-
Ensures alignment between analysts, planners, and executives.
🧠 How to Use the Dashboard
1️⃣ Open the Excel file and go to the Actual Input sheet.
2️⃣ Enter monthly Actual values and Targets.
3️⃣ Review comparisons on the Dashboard sheet.
4️⃣ Analyze long-term performance on the KPI Trend sheet.
5️⃣ Adjust targets and strategies based on findings.
6️⃣ Use visuals for board meetings or reports.
Within minutes, you’ll turn raw data into clear insights for better planning and governance.
🚍 Who Can Benefit from This Dashboard
🏙️ Municipal Transport Corporations – Monitor fleet operations and passenger metrics.
🚊 Metro and Tram Systems – Analyze punctuality and service efficiency.
🚌 Bus Operators – Track ridership, fuel usage, and maintenance KPIs.
📊 City Planners & Policy Analysts – Leverage data for infrastructure planning.
🔧 Operations & Maintenance Teams – Improve uptime and reduce costs.
🔗 Click here to read the Detailed Blog Post
🎥 Visit our YouTube channel for step-by-step tutorials
👉 YouTube.com/@PKAnExcelExpert


Reviews
There are no reviews yet.