In the modern subscription economy, growth isn’t just about signing new users — it’s about retaining loyal customers and reducing churn. The Subscription Retention KPI Dashboard in Power BI empowers you to monitor customer renewal rates, churn %, and recurring revenue — all in real time through one smart, interactive dashboard.
Built in Power BI and connected to an Excel dataset, this ready-to-use dashboard visualizes all key metrics that matter most to subscription-based businesses — from Monthly Recurring Revenue (MRR) and Lifetime Value (LTV) to Renewal Rate and Churn %. It transforms raw data into actionable insights that help you boost retention, optimize revenue, and strengthen customer loyalty.
⚙️ Key Features of Subscription Retention KPI Dashboard in Power BI
✅ 📊 Three Analytical Pages – Summary, KPI Trend, and KPI Definition for complete retention analysis.
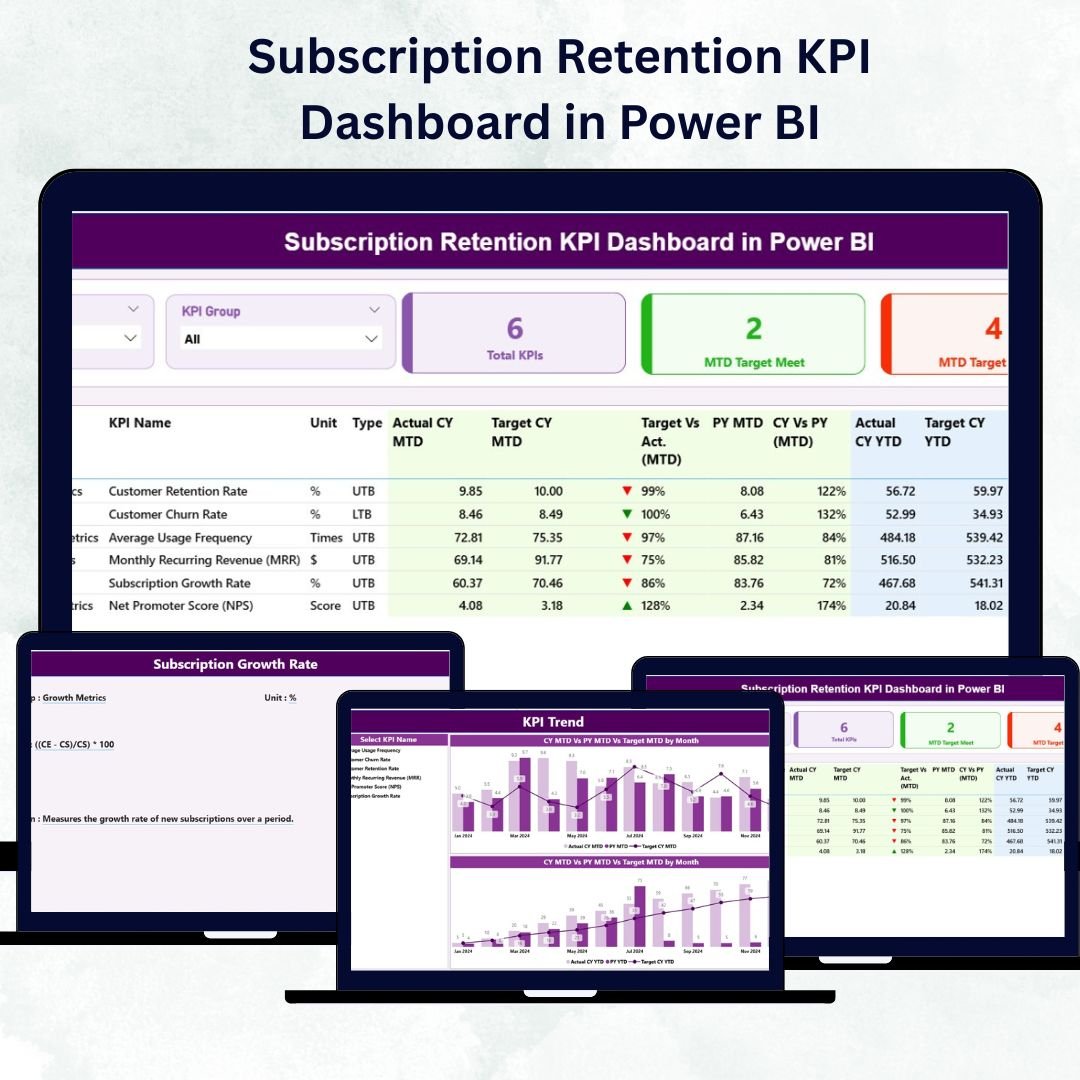
✅ 📋 Summary Page – Retention Command Center
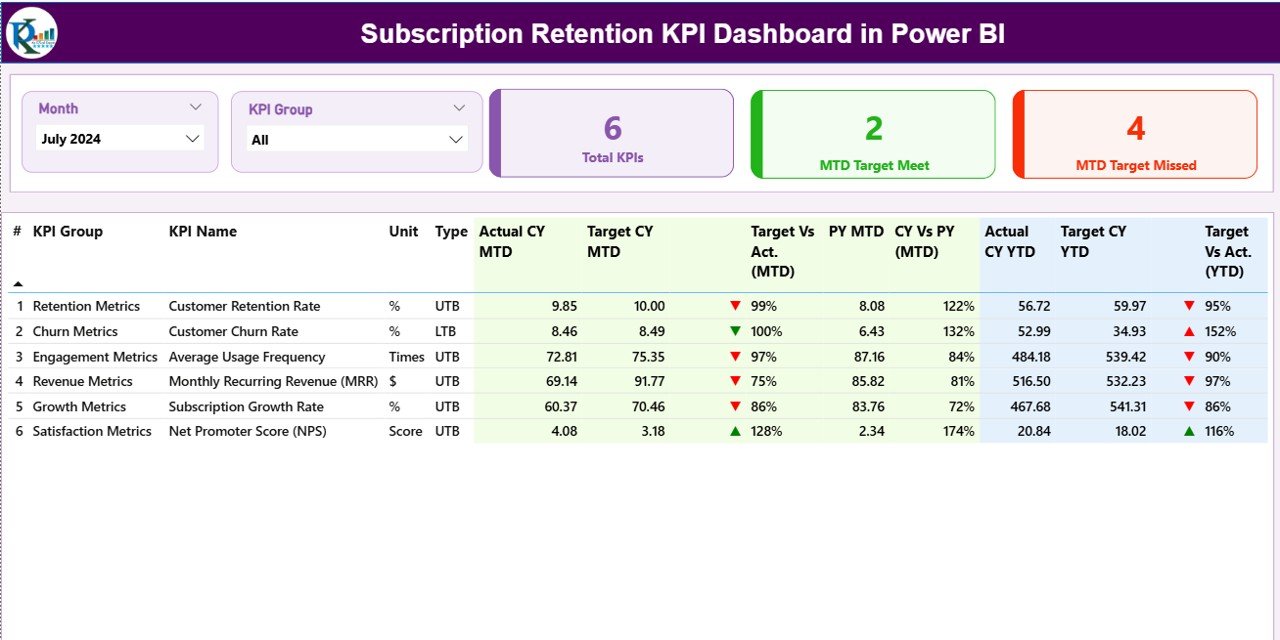
See everything in one glance with:
-
Month & KPI Group slicers for dynamic filtering
-
Cards showing Total KPI Count, MTD Target Met, and MTD Target Missed
-
A detailed KPI table listing: KPI Name, Group, Unit, Type (UTB/LTB), Actual vs Target (MTD/YTD), CY vs PY comparison, and performance icons ▲ or ▼.
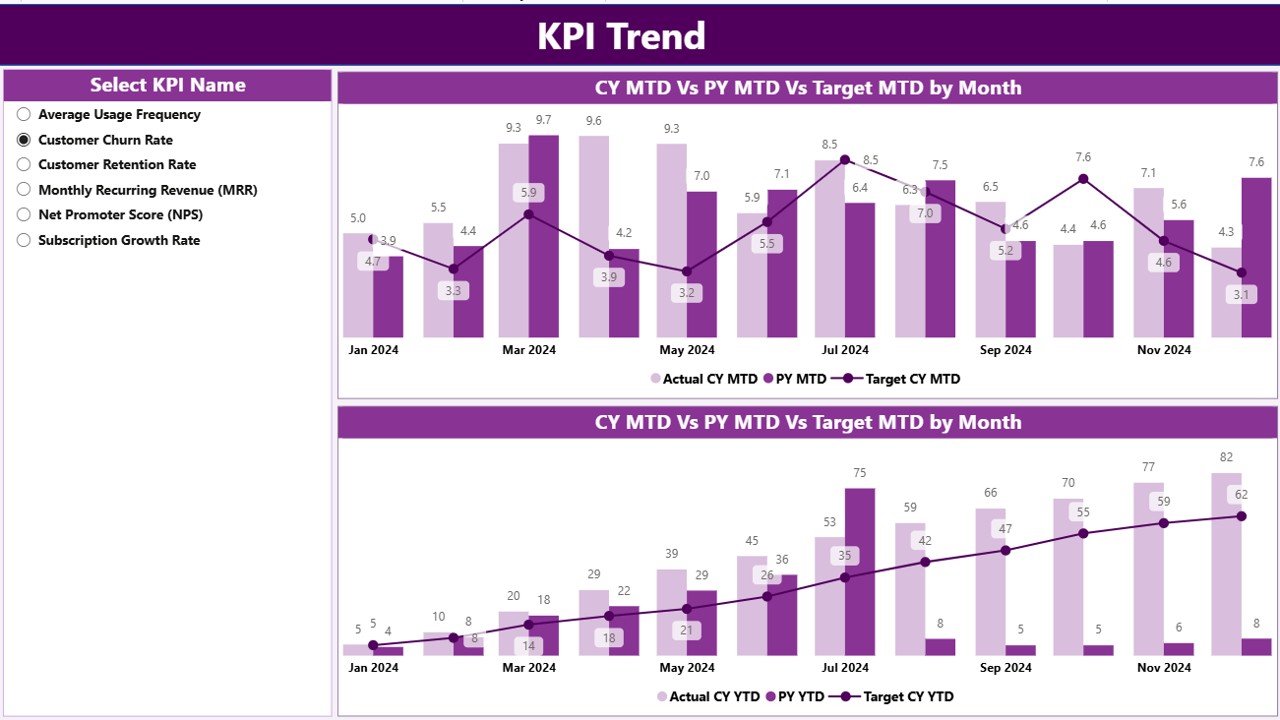
✅ 📈 KPI Trend Page – Visualize how retention performs over time with two combo charts for MTD and YTD comparisons. A KPI slicer lets you instantly analyze specific metrics like Renewal Rate or Churn %.
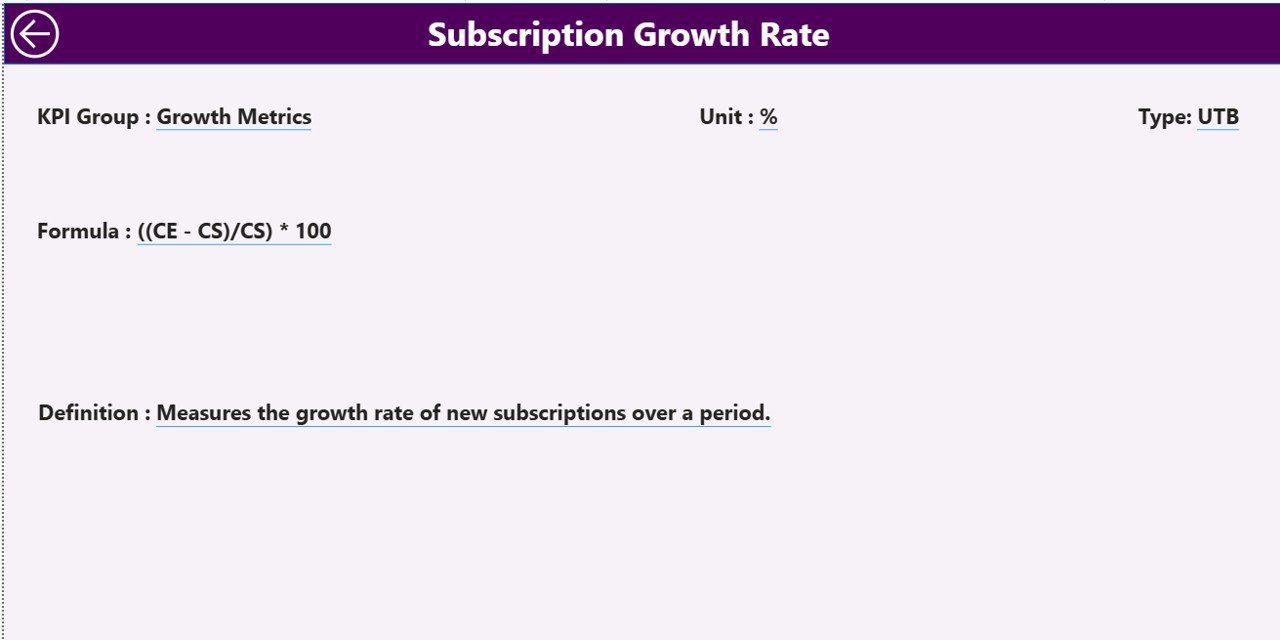
✅ 📘 KPI Definition Page – A drill-through reference hub showing KPI Formula, Definition, Unit, and Performance Type (UTB/LTB). Includes a “Back” button for easy navigation.
✅ 📂 Excel Integration – Pulls data from three structured sheets:
-
Input_Actual (MTD & YTD Actuals)
-
Input_Target (MTD & YTD Targets)
-
KPI Definition (KPI Number, Group, Unit, Formula & Type)
✅ ⚡ Automatic Refresh – Update your Excel data and Power BI refreshes instantly — no manual work.
✅ 🎨 Interactive Design – Filters, slicers, icons, and comparisons make data easy to understand.
✅ 💼 Universal Usability – Perfect for SaaS, telecom, media, insurance, and education subscription businesses.
🧩 What’s Inside the Dashboard
📁 Summary Page – Your main view for KPI performance and goal tracking.
📁 KPI Trend Page – Analyze retention movement through time.
📁 KPI Definition Page – Understand formulas and logic behind each metric.
📁 Excel Data Sheets – Three backbone files (Actual, Target, Definition) power the entire dashboard.
Every element is fully linked — edit your Excel data and Power BI updates automatically to give you fresh insights in seconds.
💡 How to Use the Subscription Retention Dashboard
1️⃣ Enter Data into Excel sheets (Actual, Target, Definition).
2️⃣ Connect Power BI to the Excel file via Power Query.
3️⃣ Refresh Data to auto-update KPIs and charts.
4️⃣ Use Slicers to filter by Month or KPI Group.
5️⃣ Drill Through for KPI formulas and definitions.
6️⃣ Analyze Trends using MTD vs YTD visuals and CY vs PY comparisons.
It’s simple enough for beginners yet powerful enough for data-driven leaders.
👥 Who Can Benefit from This Dashboard
💻 SaaS Companies – Track renewal and churn rates easily.
📺 Media & Streaming Services – Measure subscriber retention and engagement.
📞 Telecom Operators – Monitor plan renewals and upgrades.
🏦 Insurance Providers – Track policy renewal and customer lifecycle.
🎓 Education Platforms – Analyze student subscription continuity.
🧮 Finance Teams – Review recurring revenue health and forecast cash flow.
If your business depends on subscriptions, this dashboard turns raw data into clear retention insights and profitable actions.
🚀 Why You’ll Love This Power BI Dashboard
-
📊 All Retention KPIs in One Place – No more manual reports.
-
⚡ Real-Time Monitoring – Instant refresh from Excel or cloud data.
-
🎯 MTD vs YTD Comparisons – Spot short-term and long-term trends.
-
💬 Visual Indicators (▲/▼) – Quickly see target status.
-
📈 Benchmark Performance – Compare current and previous periods.
-
🔍 Interactive Filtering – Zoom into any KPI group or month.
-
💼 Customizable Metrics – Modify KPIs to fit your business.
-
💡 Actionable Insights – Move from reporting to retention strategy.
🔗 Click here to read the Detailed blog post
📺 Visit our YouTube channel to learn step-by-step video tutorials
👉 YouTube.com/@PKAnExcelExpert


Reviews
There are no reviews yet.