
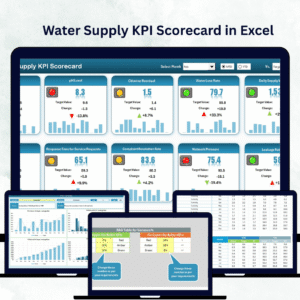
Efficient water management is vital for sustainability, cost control, and service reliability. The Water Supply KPI Scorecard in Excel is a ready-to-use performance tracking solution that helps water utilities, municipal boards, and private service providers monitor key metrics and drive operational excellence.
This data-driven Excel dashboard provides a centralized platform to measure, compare, and analyze KPIs such as production efficiency, non-revenue water, quality compliance, customer response, and financial performance. It’s designed to turn raw operational data into actionable insights — empowering managers to make informed, real-time decisions.
⚙️ Key Features of the Water Supply KPI Scorecard in Excel
📊 4 Organized Sheets – Scorecard Dashboard, KPI Trend, Input Data, and KPI Definition.
🎯 MTD & YTD Views – Switch between short-term and cumulative results.
📈 Actual vs Target vs Previous Year – Analyze performance in real time.
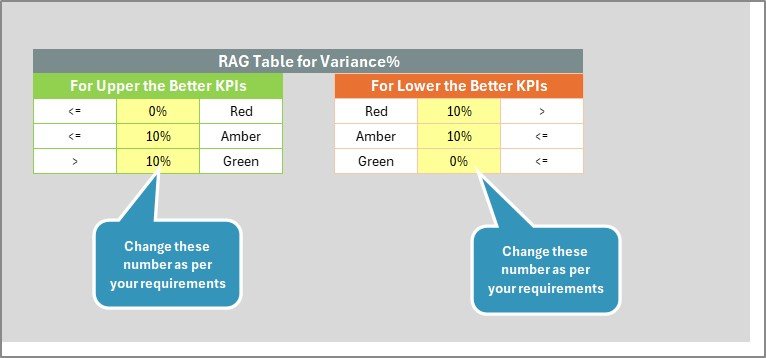
🟢 Color-Coded Indicators – Instantly spot on-track (green), at-risk (yellow), or underperforming (red) KPIs.
📘 Dynamic Dropdowns – Choose months or KPIs easily.
💡 Interactive Charts – Visualize trends and progress over time.
⚙️ Automated Formulas – No manual calculations or coding required.
💼 Fully Editable & Scalable – Customize to match your operational needs.
🧭 Structure of the Template
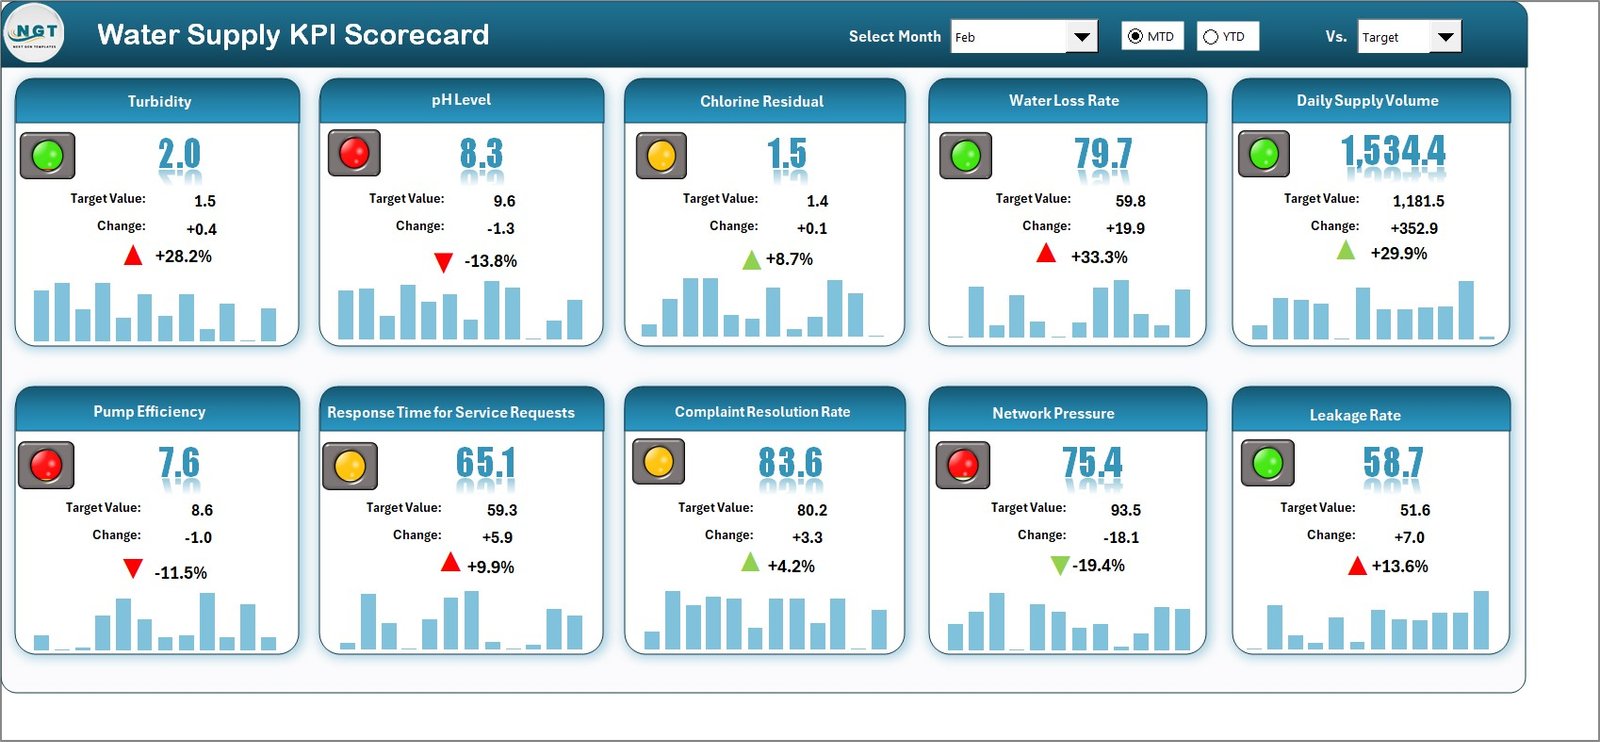
1️⃣ Scorecard Sheet – Main Dashboard
This is your command center.
-
Dropdown menus to select month or view (MTD/YTD).
-
Displays 10 KPIs per view for clarity.
-
Actual vs Target results visualized with color indicators.
💡 Instantly identify which areas are excelling and which need improvement.
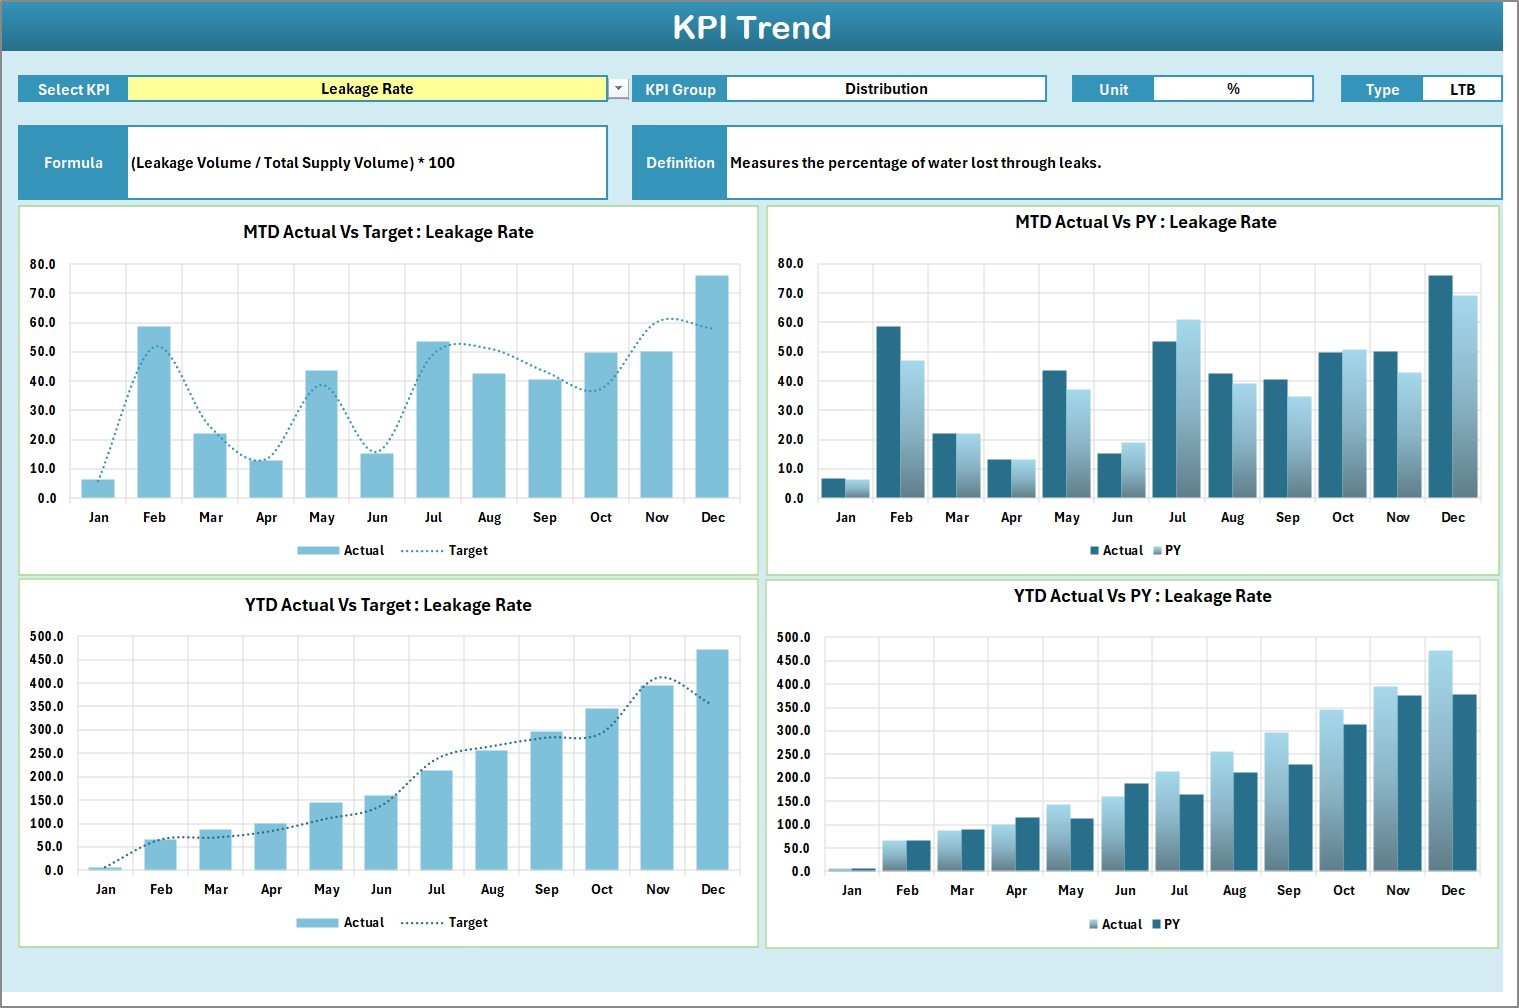
2️⃣ KPI Trend Sheet – Performance Over Time
Track monthly and yearly performance for any KPI.
-
Dropdown (C3) to select the KPI.
-
Displays KPI details like Group, Unit, and Formula.
-
Charts compare Actual, Target, and Previous Year (MTD/YTD).
Perfect for performance reviews and progress reports.
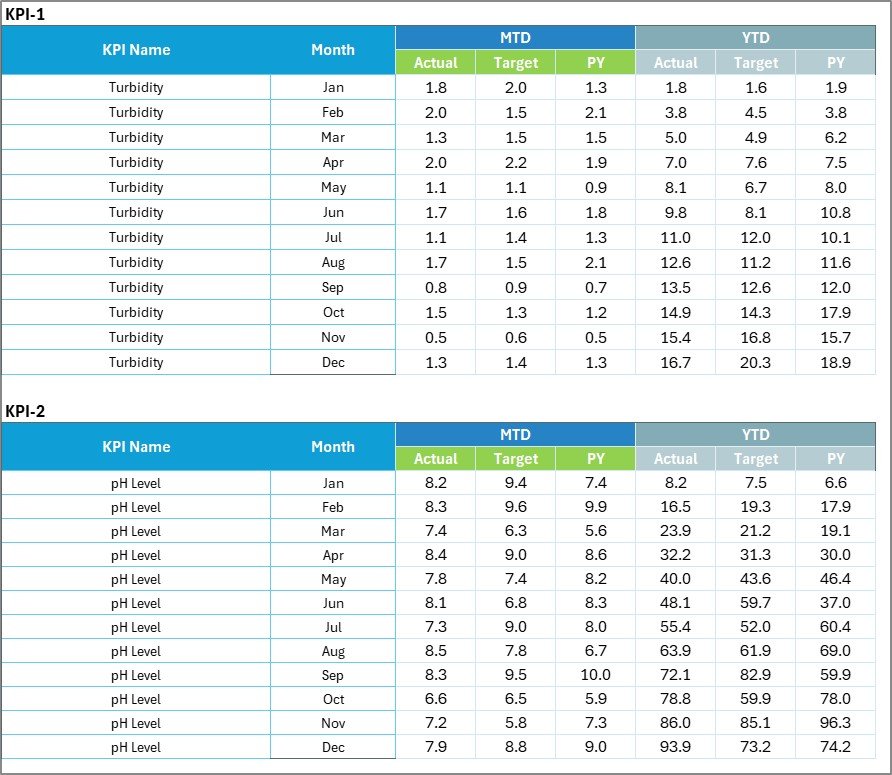
3️⃣ Input Data Sheet – Data Management Hub
Store monthly data for all KPIs in one place.
-
Enter Actual, Target, and Previous Year metrics.
-
Dashboard updates automatically with new entries.
-
Eliminates repetitive manual reporting.
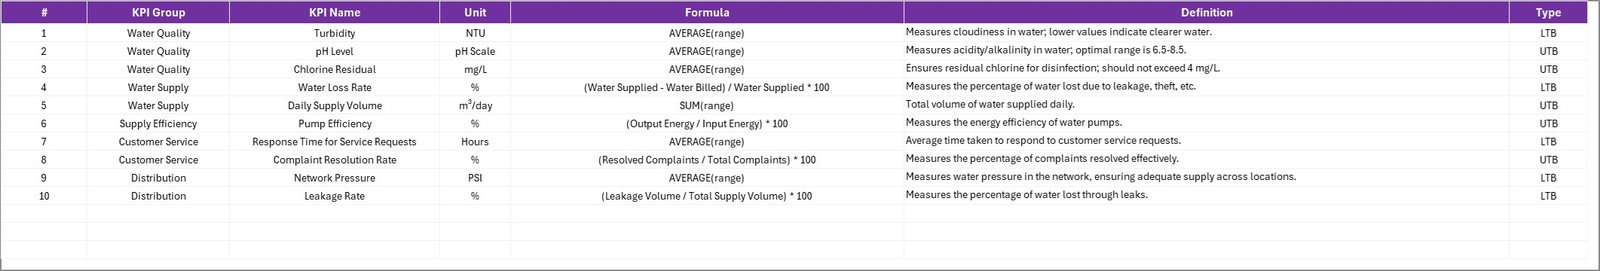
4️⃣ KPI Definition Sheet – Consistency and Clarity
Document your performance indicators for transparency.
-
Includes KPI Name, Group, Unit, Formula, Definition, and Type (UTB/LTB).
Ensures every stakeholder interprets performance the same way.
💧 Why Use Excel for KPI Tracking?
Excel is the most accessible and flexible tool for performance monitoring.
Key Benefits:
✅ No need for specialized software.
✅ Highly customizable for local and organizational needs.
✅ Easy integration with existing systems.
✅ Visual dashboards using charts and conditional formatting.
✅ Cost-effective, scalable, and beginner-friendly.
The Water Supply KPI Scorecard combines automation and simplicity, making it suitable for small departments and large water utilities alike.
📈 Advantages of Using the Water Supply KPI Scorecard in Excel
✅ Data-Driven Decision-Making – View real-time MTD/YTD performance and take quick action.
✅ Improved Accountability – Assign KPIs to teams and track responsibility.
✅ Centralized Data Management – Keep all records organized in one file.
✅ Visual Insights – Charts and color codes make analysis effortless.
✅ Strategic Planning Support – Compare monthly and yearly trends to plan budgets.
✅ Cost Efficiency – High-end functionality at zero additional software cost.
🌍 Practical Applications
-
Municipal Water Departments – Track production, leakage, and service delivery.
-
Private Utilities – Monitor energy costs, treatment efficiency, and revenue.
-
Public Health Programs – Measure water quality compliance and access coverage.
-
Engineering Teams – Evaluate pumping and distribution efficiency.
🧠 Best Practices for Optimal Use
✔ Define 10–15 measurable and relevant KPIs.
✔ Update monthly with verified data.
✔ Use visual alerts to highlight exceptions.
✔ Compare MTD, YTD, and Previous Year for insights.
✔ Protect formulas and key cells to avoid accidental edits.
✔ Conduct quarterly reviews to realign targets.
✔ Back up data regularly.
These practices ensure your scorecard remains reliable, consistent, and insightful.
💡 Example Impact
A city water board implemented this scorecard and achieved:
-
12% faster leak repair turnaround.
-
8% reduction in pumping energy costs.
-
5% improvement in water quality compliance.
By tracking the right KPIs consistently, the board increased operational efficiency and improved customer satisfaction significantly.
🧩 Customizable for Any Organization
You can easily:
-
Add or remove KPIs.
-
Modify formulas or visuals.
-
Insert slicers, filters, or charts.
-
Change colors or branding.
-
Export data to Power BI for advanced visualization.
Adapt it once — and use it for years of performance reporting.
🧾 Conclusion
The Water Supply KPI Scorecard in Excel isn’t just a dashboard — it’s a complete performance management framework for water utilities.
It empowers teams to track progress, reduce non-revenue water, improve customer satisfaction, and enhance sustainability.
Whether you manage a local utility or a regional infrastructure network, this Excel scorecard transforms your operations into a transparent, measurable, and data-driven system.
💧 Start today — measure what matters, manage efficiently, and sustain your success.
Click here to read the Detailed blog post
👉 Visit our YouTube Channel: https://www.youtube.com/@PKAnExcelExpert


Reviews
There are no reviews yet.