

In today’s fast-paced corporate world, employee well-being is the foundation of productivity and success. The Corporate Wellness Program Report in Excel is a powerful, ready-to-use tool that helps HR professionals, wellness coordinators, and business leaders track, analyze, and enhance wellness initiatives — all in one interactive Excel dashboard.
Built to simplify data-driven wellness management, this Excel report consolidates participation rates, health scores, and budget data into visual insights that guide smarter decisions. Whether you’re managing fitness sessions, nutrition programs, or mental health workshops, this template provides the structure and analytics you need to measure impact effectively.
With its intuitive design, pre-built formulas, and easy-to-navigate dashboard, the Corporate Wellness Program Report empowers organizations to transform wellness data into actionable performance insights — promoting a healthier, more engaged workforce.
⚙️ Key Features of the Corporate Wellness Program Report in Excel
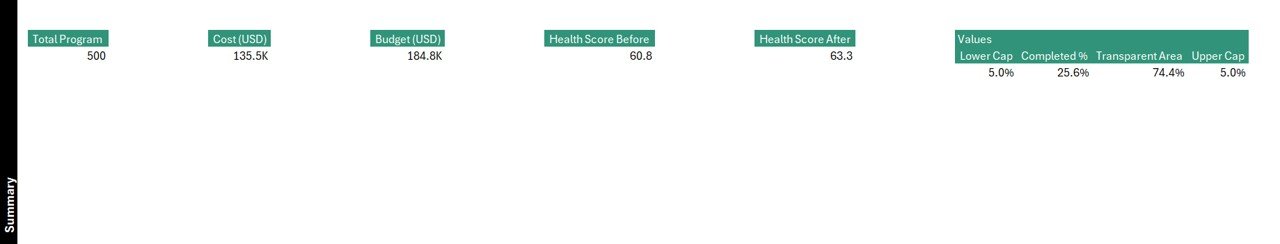
📊 Comprehensive Summary Dashboard

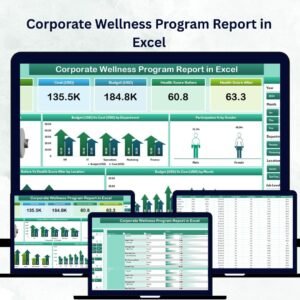
The Summary Page acts as the main hub for your wellness analytics. At a glance, HR teams can monitor all essential metrics like:
-
👥 Total Participants – Track overall engagement.
-
❤️ Average Health Score – Compare pre- and post-program wellness levels.
-
✅ Completed % – Measure completion across programs.
-
💰 Budget (USD) vs. Cost (USD) – Analyze spending efficiency.
🎛️ Interactive Filters:
Slicers allow you to filter insights by Department, Gender, or Location, ensuring a quick and detailed view of wellness trends.
📈 Insightful Charts & Visuals:
-
Completed %
-
Budget vs. Cost by Department
-
Participation % by Gender
-
Health Score Before vs. After by Location
-
Budget vs. Cost by Month
Each chart offers real-time visibility, helping HR teams pinpoint successful initiatives and areas needing improvement.
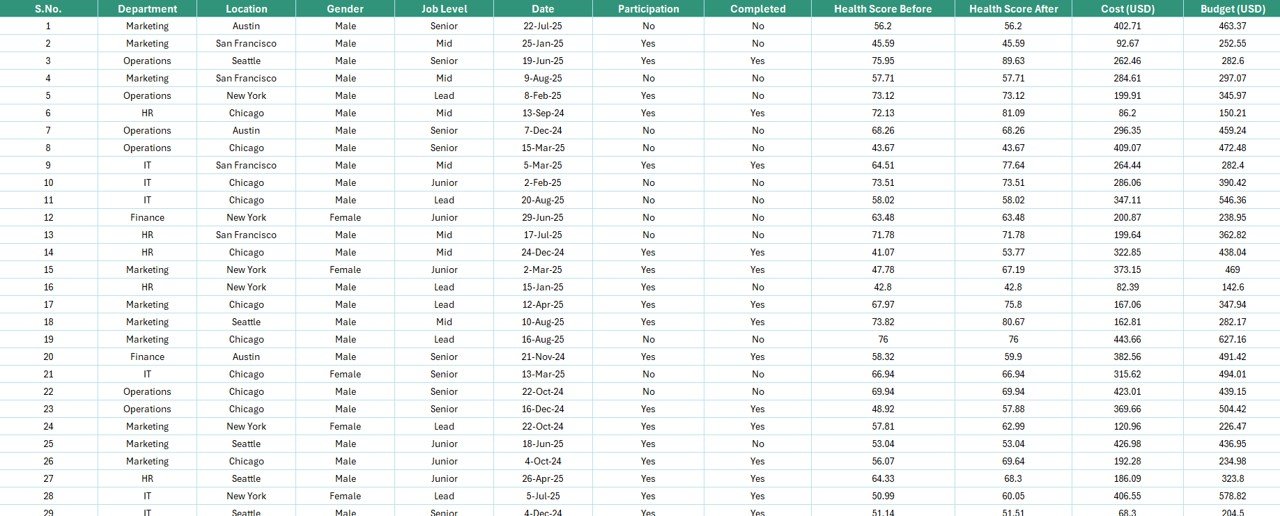
📋 Detailed Report Page
The Report Page provides a granular breakdown of wellness data through a left-side slicer and data table. It includes:
-
Employee ID or Name
-
Department & Program Type
-
Health Scores (Before & After)
-
Participation & Completion Status
-
Budget & Cost Details
This page is ideal for departmental reviews, presentations, and export-ready reports.
🧾 Data Sheet – The Engine Behind the Dashboard
All core data — such as employee demographics, health scores, and financial figures — is stored in the Data Sheet. Once new records are added, charts and KPIs update automatically.
🧩 Support Sheet – Structured and Error-Free Data
This sheet stores reference lists for departments, program types, and status options. It ensures data consistency and reduces human error during updates.
📊 What’s Inside the Template
1️⃣ Summary Page: Interactive dashboard with KPIs & charts
2️⃣ Report Page: Detailed, filterable table view
3️⃣ Data Sheet: Centralized raw data storage
4️⃣ Support Sheet: Reference lists for dropdowns
Each page is preformatted for instant usability — no advanced Excel knowledge required.
🧭 How to Use the Corporate Wellness Program Report in Excel
✅ Step 1: Input or import employee data into the Data Sheet.
✅ Step 2: Update the Support Sheet with departments, programs, and status lists.
✅ Step 3: Review visual KPIs on the Summary Page.
✅ Step 4: Use slicers to filter by department, gender, or region.
✅ Step 5: Export the Report Page for performance reviews.
Within minutes, you’ll have a fully functional wellness monitoring system that converts raw data into actionable insights.
👥 Who Can Benefit from This Report
🏢 HR Professionals: Track wellness participation, ROI, and impact.
👩⚕️ Wellness Coordinators: Monitor program effectiveness and engagement.
💼 Department Heads: Compare performance across teams or locations.
📊 Executives: Make data-driven decisions on health investments.
Whether you run a small HR department or manage a large workforce, this tool scales to fit your needs.
🌟 Advantages of the Corporate Wellness Program Report in Excel
✅ All-in-One View: Consolidates wellness KPIs, costs, and participation data in one dashboard.
✅ Easy to Customize: Modify charts, labels, and categories to match your company’s structure.
✅ Promotes Transparency: Department-wise and gender-based filters highlight inclusivity and engagement.
✅ Drives Results: Compares pre- and post-health scores to measure real outcomes.
✅ Saves Time: Automates data visualization with pre-built pivot charts.
✅ Cost-Effective: Offers HR reporting power without expensive software.
✅ Encourages Accountability: Departments can monitor their own results.
💡 Best Practices for Using This Report
🔹 Update data regularly for accurate insights.
🔹 Use consistent naming conventions across sheets.
🔹 Add conditional formatting to flag low participation or high costs.
🔹 Include employee feedback columns for qualitative evaluation.
🔹 Review monthly trends to identify improvement opportunities.
🔹 Share the dashboard in HR meetings to encourage transparency.
By following these practices, organizations can continuously improve wellness outcomes and employee satisfaction.
🔗 Click here to read the Detailed Blog Post
🎥 Visit our YouTube channel for step-by-step tutorials
🔗 YouTube.com/@PKAnExcelExpert


Reviews
There are no reviews yet.