In today’s competitive business world, every call matters — and every second counts.
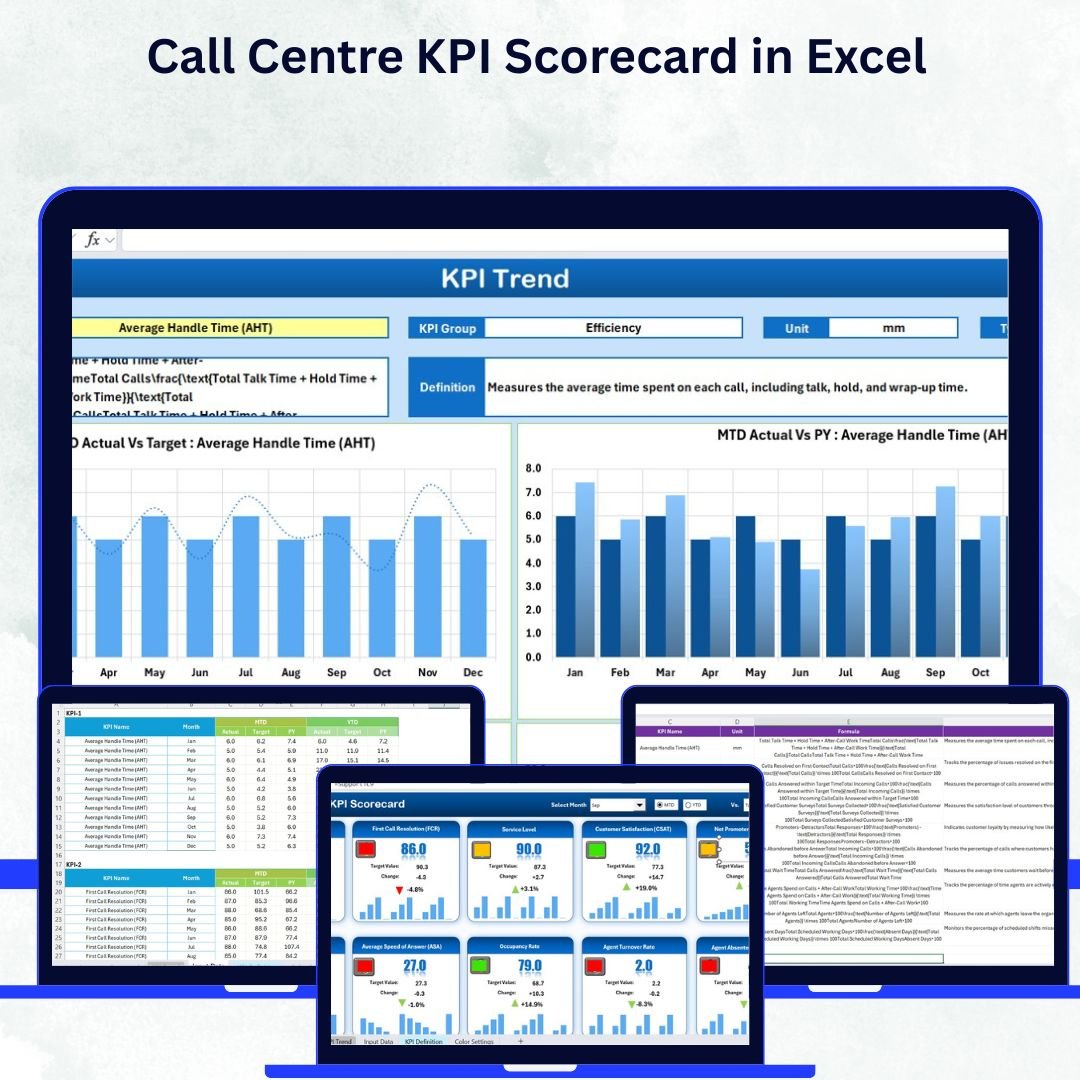
The Call Centre KPI Scorecard in Excel is your all-in-one solution to monitor, analyze, and improve customer service performance with ease. Whether you manage a small team or a large-scale contact centre, this ready-to-use Excel template turns your data into actionable insights that drive better decisions and happier customers.
✨ Key Features of Call Centre KPI Scorecard in Excel
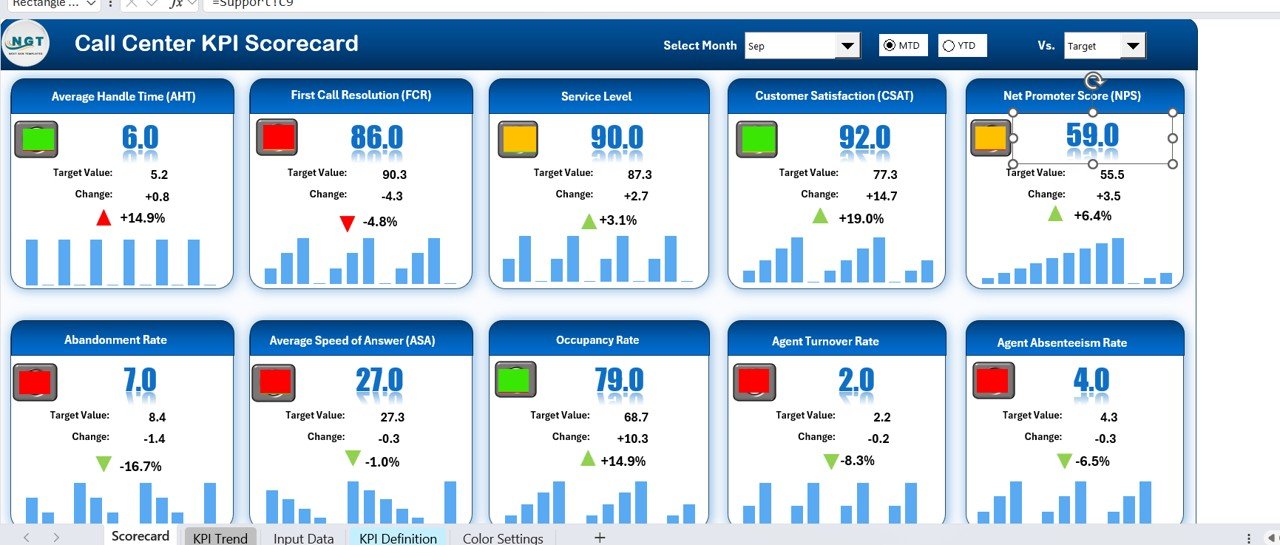
📊 Comprehensive KPI Tracking: Monitor up to 10 key metrics like Average Handle Time (AHT), First Call Resolution (FCR), and Customer Satisfaction (CSAT) in one view.
🎯 Actual vs Target Analysis: Instantly compare your performance against monthly or yearly goals to identify strengths and areas for improvement.
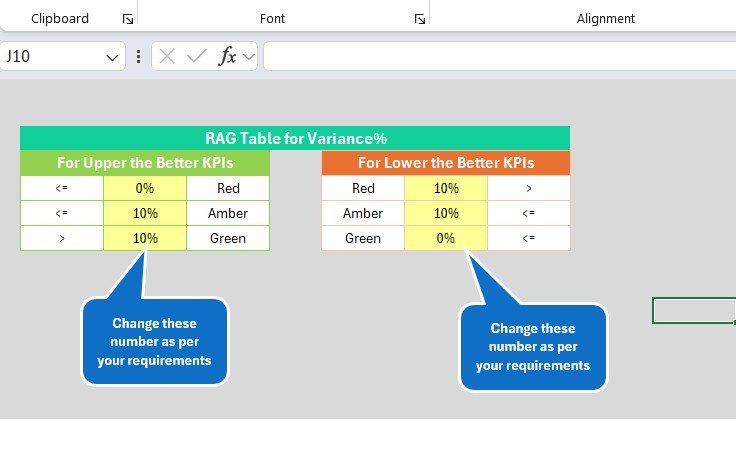
🟢 Color-Coded Performance Indicators: Conditional formatting provides green, yellow, and red visuals for instant performance interpretation.
📈 MTD and YTD Mode: Seamlessly switch between Month-to-Date and Year-to-Date summaries for flexible reporting.
📅 Interactive Dropdown Menus: Quickly filter by month or KPI category for focused analysis.
📂 Structured Data Input: Simplified data entry with preformatted cells ensures consistency and accuracy across all KPIs.
💡 Automatic Updates: Update one sheet, and all visuals and charts refresh automatically — saving hours of manual work.
🔄 Customizable Dashboard: Modify KPIs, colors, or charts to match your organization’s objectives and branding.

📦 What’s Inside the Call Centre KPI Scorecard in Excel
This Excel template is built with four powerful worksheets, each serving a distinct purpose:
1️⃣ Scorecard Sheet – The central dashboard for real-time KPI performance.
-
View actuals vs targets with progress percentages.
-
Instantly visualize team performance with color-coded metrics.
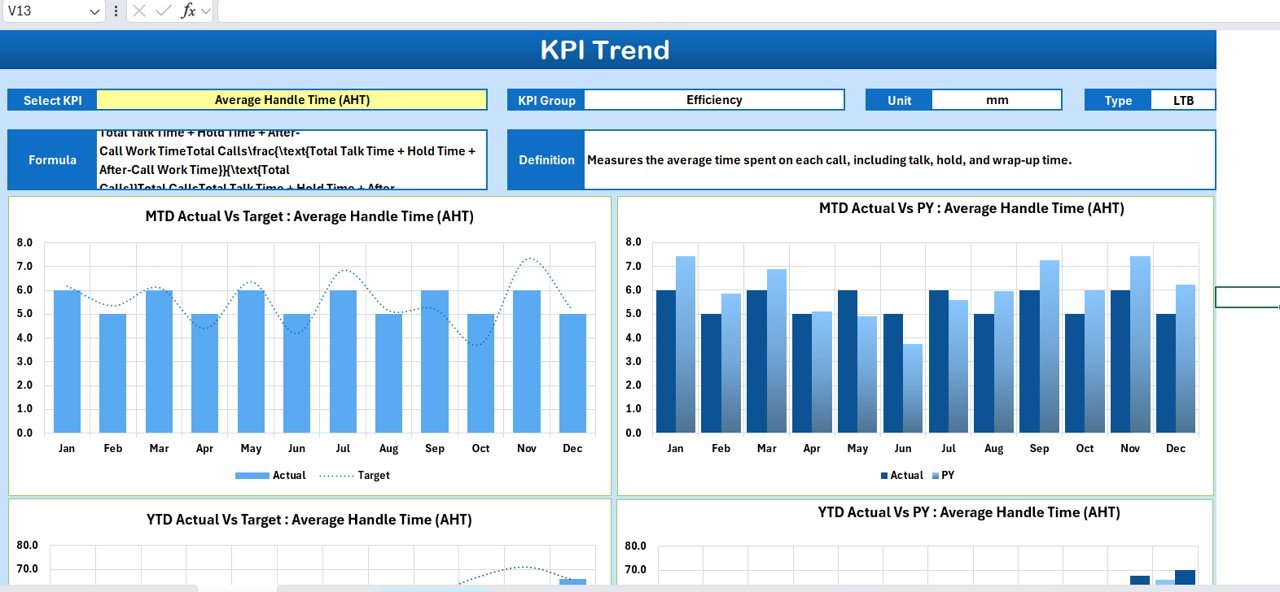
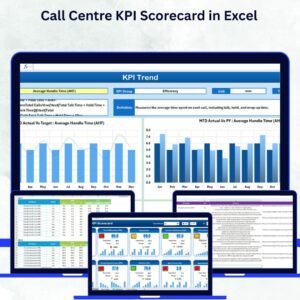
2️⃣ KPI Trend Sheet – Analyze performance patterns across months.
-
Pick any KPI from a dropdown and explore MTD, YTD, and Previous Year trends.
-
Dynamic charts make spotting trends effortless.
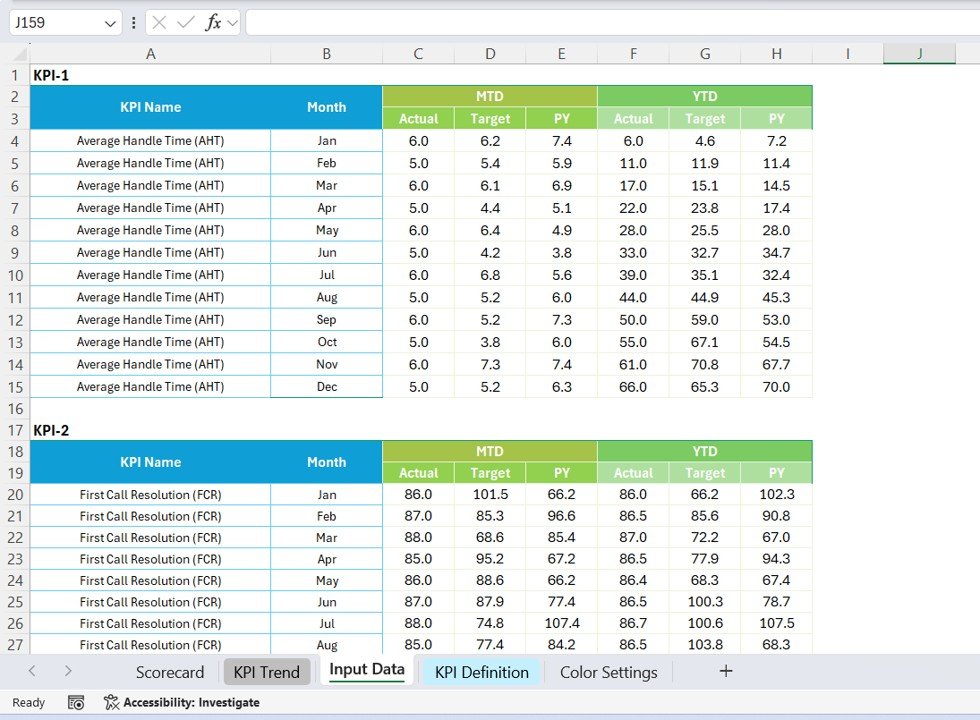
3️⃣ Input Data Sheet – Enter monthly data for Actual, Target, and Previous Year values.
-
Auto-updates all visuals for precise tracking.
-
Simplified design for easy data handling.
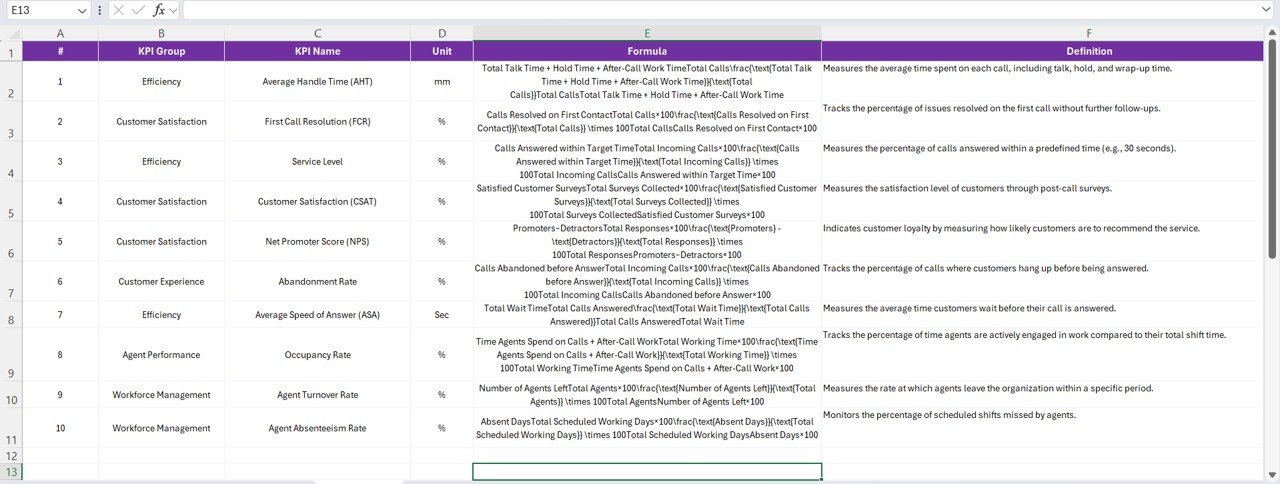
4️⃣ KPI Definition Sheet – Define your KPIs clearly.
-
Record KPI name, unit, type (LTB/UTB), formula, and definition.
-
Keeps team understanding consistent and transparent.
🧭 How to Use the Call Centre KPI Scorecard in Excel
Getting started is effortless — even for non-technical users.
🪄 Step 1: Open the downloaded Excel file and review the four tabs.
🪄 Step 2: Define KPIs in the KPI Definition Sheet with relevant formulas and units.
🪄 Step 3: Add monthly data in the Input Data Sheet — Actual, Target, and PY.
🪄 Step 4: Go to the Scorecard Sheet and select your preferred month or time period from the dropdown.
🪄 Step 5: Analyze KPI trends and identify areas of improvement using the KPI Trend Sheet.
Within minutes, your dashboard is ready to help you make smarter, data-driven decisions.
👥 Who Can Benefit from This Call Centre KPI Scorecard in Excel
🏢 Call Centre Managers: Monitor team performance and reduce inefficiencies.
🎧 Operations Supervisors: Track KPIs to improve service levels and response times.
🧑💼 HR and Training Teams: Identify skill gaps and align training with performance data.
💼 Executives and Directors: Get a 360° overview of performance for strategy development.
🚀 Small Businesses: Enjoy professional-grade insights without costly software.
No matter your industry — telecom, e-commerce, insurance, or customer support — this template helps you transform raw call data into meaningful, actionable insights.
Click here to read the Detailed Blog Post
Watch the step-by-step video tutorial:
Visit our YouTube channel to learn step-by-step video tutorials


Reviews
There are no reviews yet.