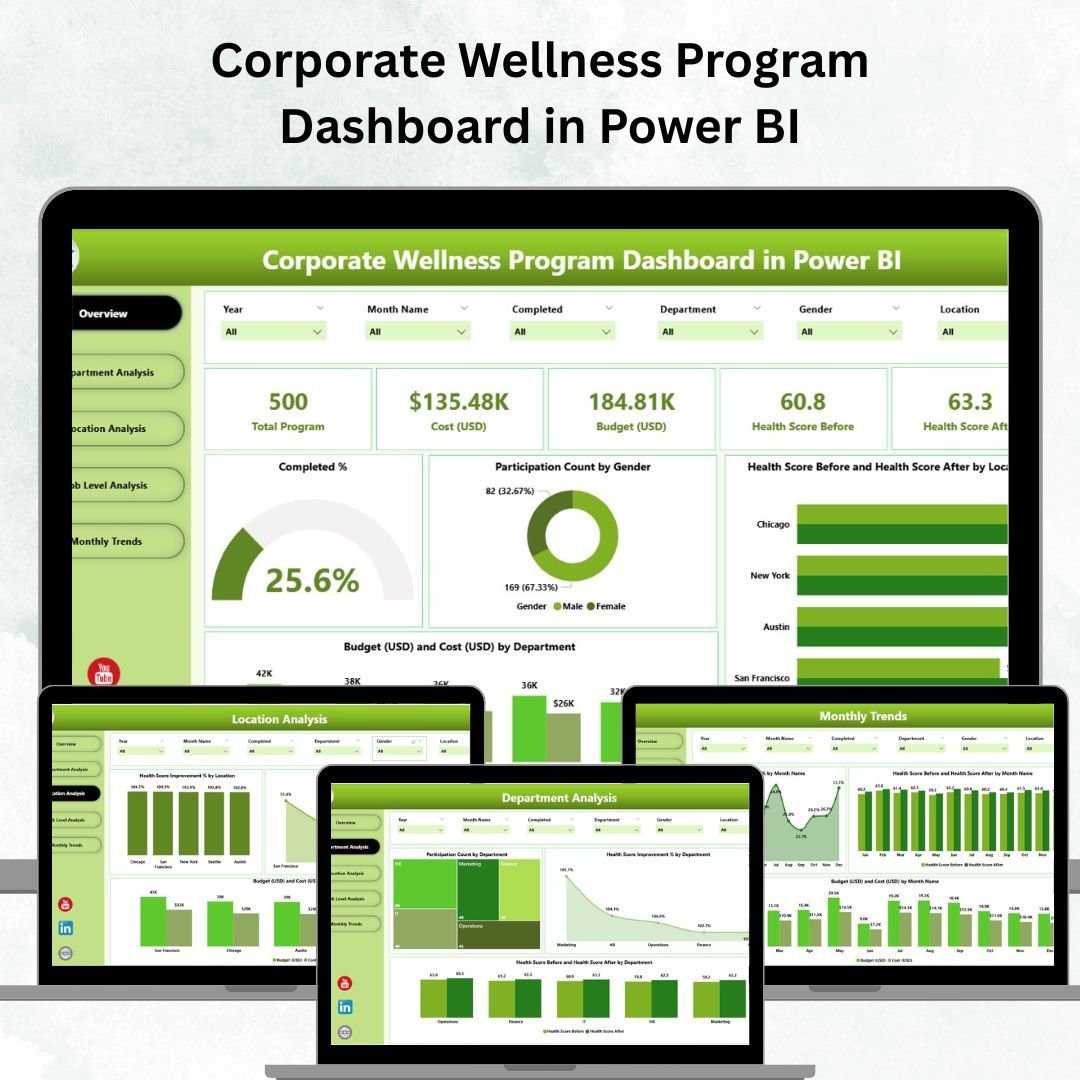
In a world where workplace stress, burnout, and absenteeism are rising, the Corporate Wellness Program Dashboard in Power BI offers a transformative way to track, analyze, and enhance employee well-being.
This ready-to-use Power BI dashboard empowers HR leaders, wellness managers, and executives to visualize participation rates, health score improvements, and program efficiency — all in one interactive, data-driven platform.
It’s not just a dashboard; it’s your organization’s health pulse monitor, designed to turn data into actionable wellness insights.
⚙️ Key Features of the Corporate Wellness Program Dashboard in Power BI
-
📊 Five Dynamic Pages — Overview, Department Analysis, Location Analysis, Job Level Analysis, and Monthly Trends.
-
💡 Real-Time Wellness Insights — Track participation %, completion rates, health score improvements, and budget vs cost data.
-
🧩 Interactive Slicers & Filters — Instantly filter by department, location, or job level to uncover trends.
-
💰 Budget vs Cost Visualization — Compare planned and actual program spending.
-
📈 Health Score Tracking — View “before vs after” health improvement metrics across departments and regions.
-
👥 Participation Analysis — Understand who’s engaging most — by gender, job level, or department.
-
🌍 Location-Based Comparisons — Analyze performance and participation across branches or countries.
-
⚡ Drill-Down Capability — Move from a big-picture overview to detailed departmental or role-level insights.
-
🔄 Automated Updates — Connects to Excel or HR systems for real-time data refresh.
-
🛠 Customizable Structure — Modify visuals, KPIs, and slicers easily to match your wellness strategy.
📂 What’s Inside the Corporate Wellness Program Dashboard
This dashboard template includes five well-structured analytical pages, each serving a unique purpose:
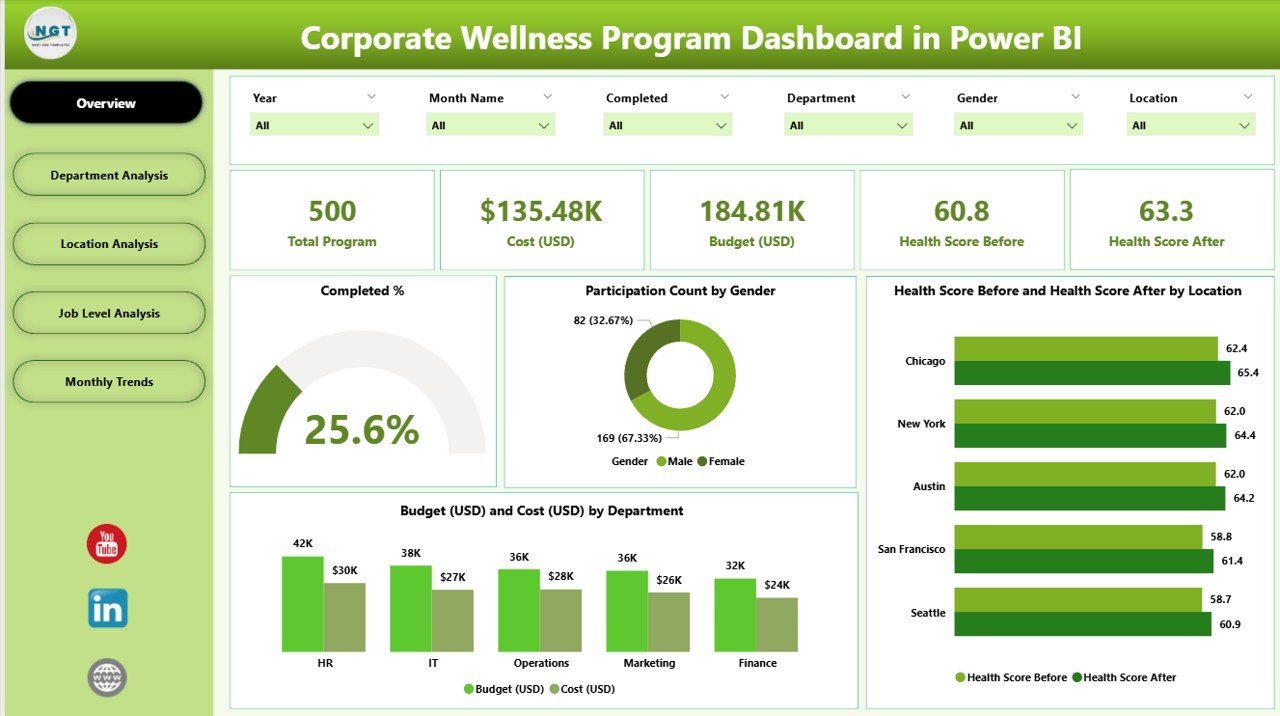
1️⃣ Overview Page
The central hub for leadership and HR teams.
-
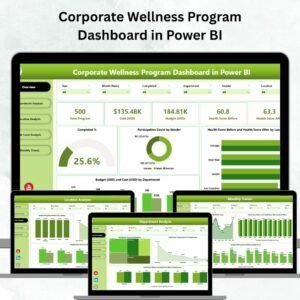
Displays key KPIs like Completion %, Participation Rate, Average Health Score, Total Budget, and Total Cost.
-
Charts include Completed %, Participation by Gender, Health Score Improvement by Location, and Budget vs Cost by Department.
-
Get a snapshot of company-wide wellness performance at a glance.
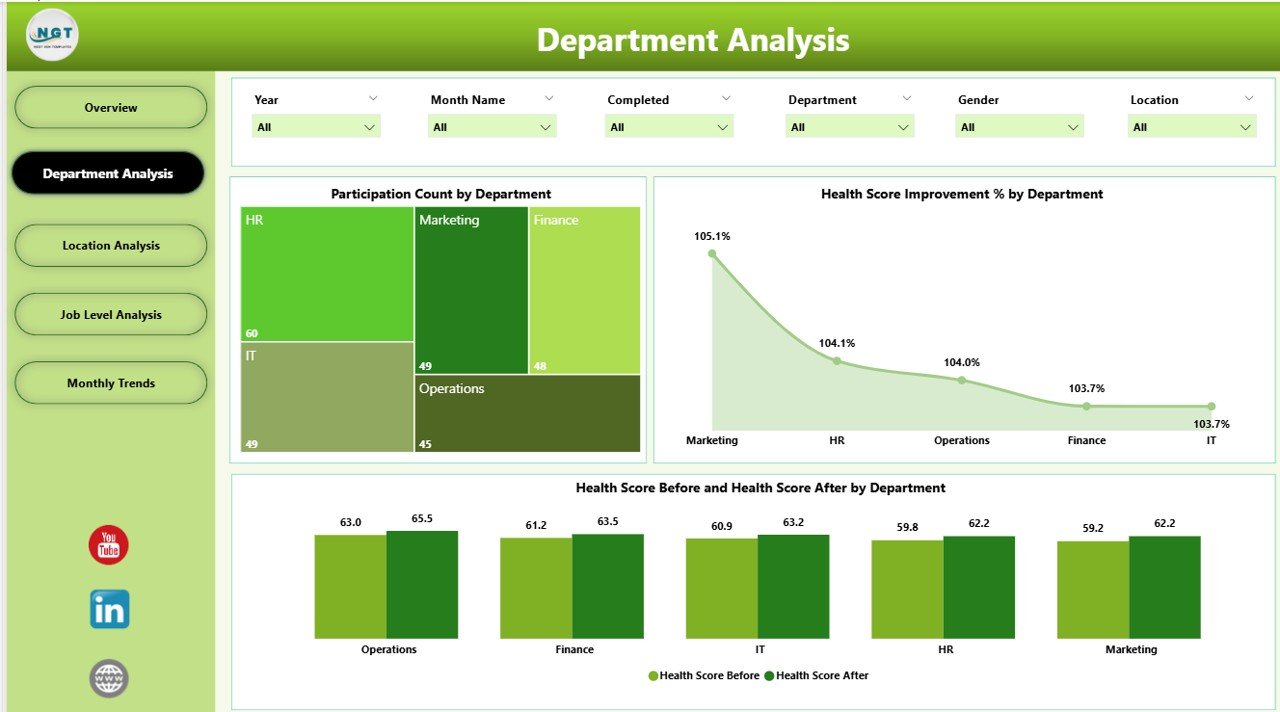
2️⃣ Department Analysis Page
Gain insights into how each department participates and benefits.
-
Charts include Participation Count, Health Score Improvement %, and Health Score Before vs After by Department.
-
Identify departments that need more motivation or support to improve engagement.
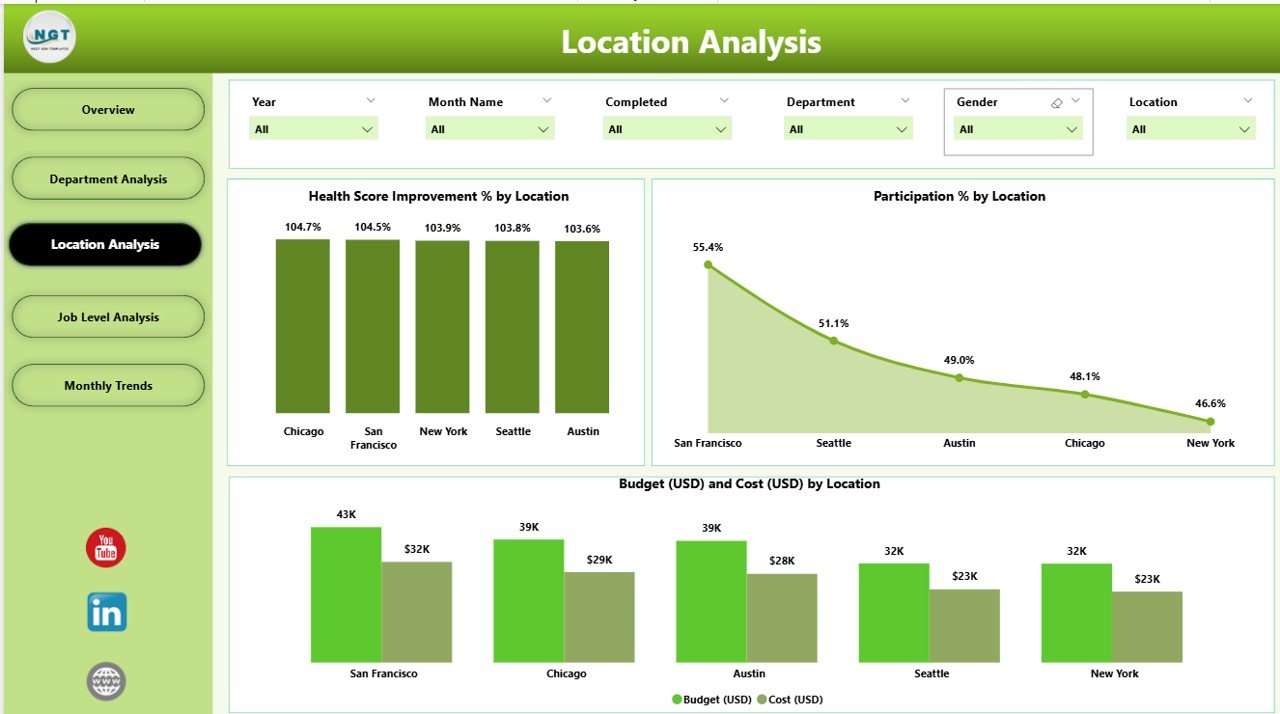
3️⃣ Location Analysis Page
Track how wellness varies across offices or regions.
-
Visuals display Health Score Improvement %, Participation %, and Budget vs Cost by Location.
-
Ideal for multi-branch organizations aiming for uniform wellness outcomes.
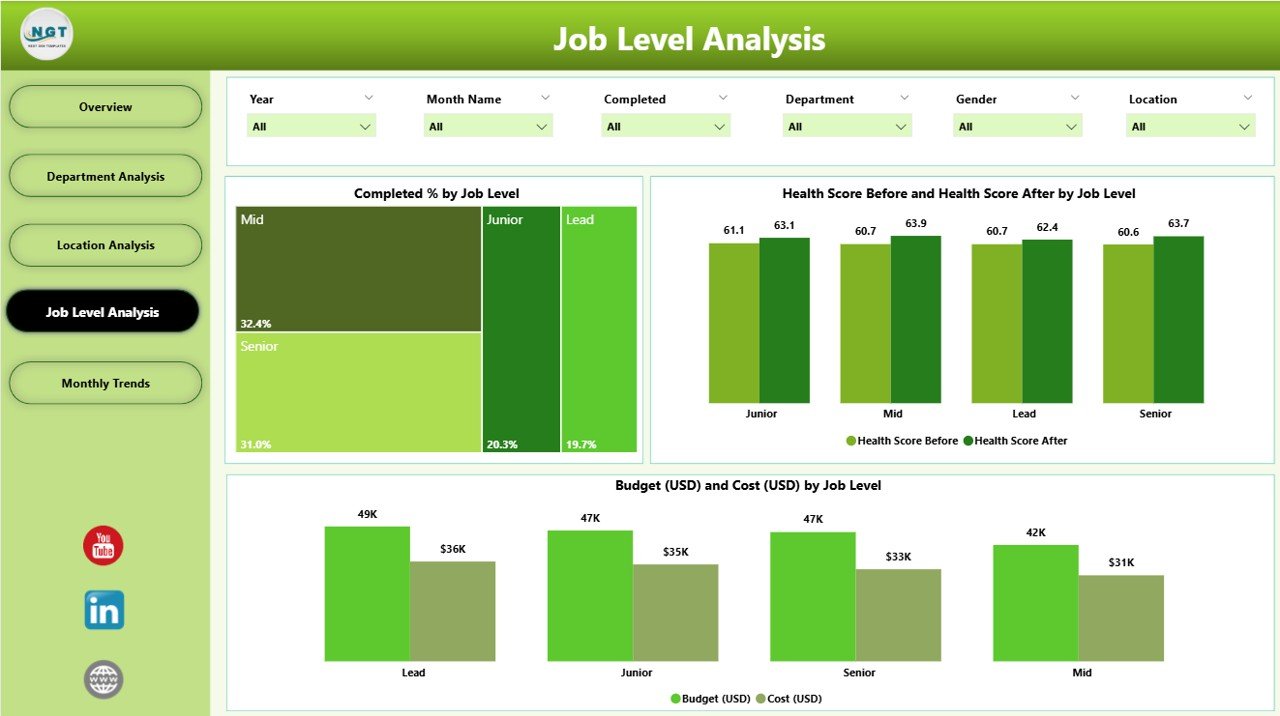
4️⃣ Job Level Analysis Page
Understand wellness engagement across job hierarchies.
-
Charts: Completed % by Job Level, Health Score Before vs After, and Budget vs Cost.
-
Perfect for identifying participation gaps between executives, managers, and staff.
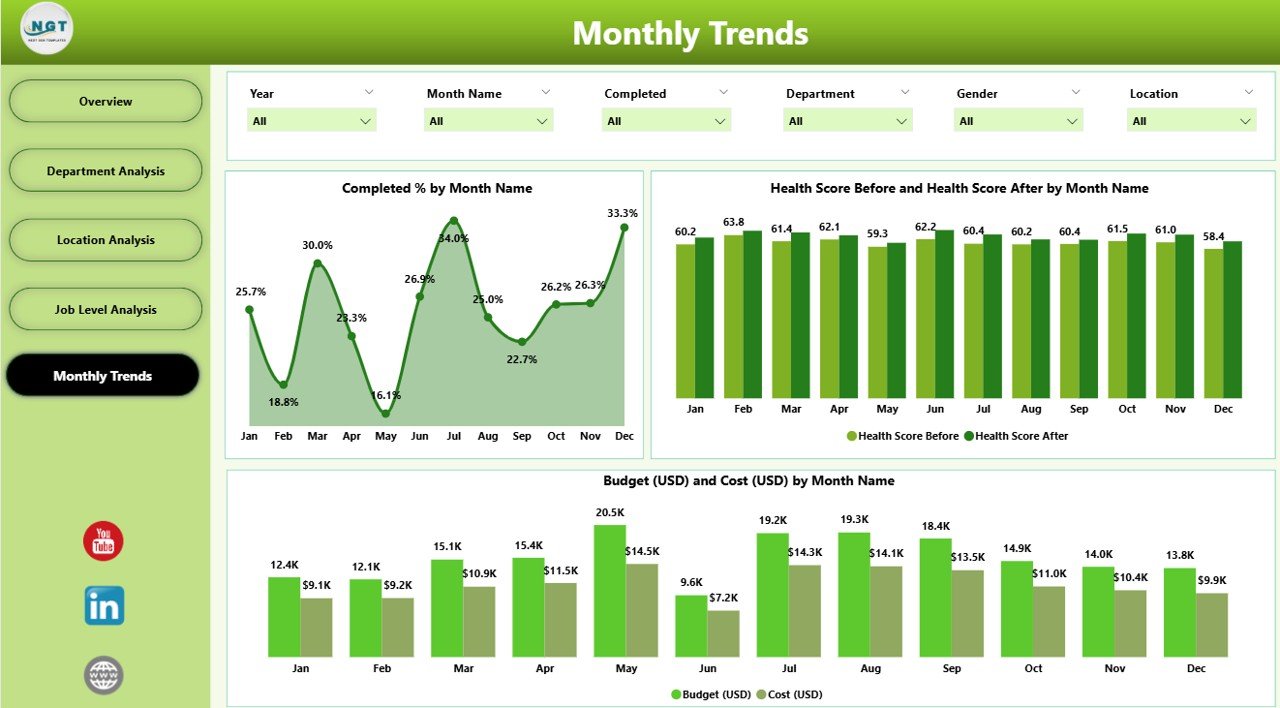
5️⃣ Monthly Trends Page
Discover time-based insights for strategic planning.
-
Charts include Completed % by Month, Health Score by Month, and Budget vs Cost Trends.
-
Detect seasonal dips, forecast program performance, and track consistency.
🧠 How to Use the Dashboard
-
Connect Data: Link your Excel or HR wellness data to the Power BI file.
-
Refresh & Update: Power BI automatically updates visuals with the latest records.
-
Analyze: Use slicers to view performance by department, location, or job level.
-
Drill Down: Click visuals for deeper insights on participation and health scores.
-
Share Results: Export visuals to PowerPoint, PDF, or share the dashboard securely via Power BI Service.
👥 Who Can Benefit from This Dashboard
-
🧑💼 HR Departments: Track participation, completion, and engagement metrics.
-
🧘♀️ Wellness Teams: Evaluate program impact and identify improvement areas.
-
💰 Finance Teams: Compare budget vs actual costs for ROI analysis.
-
👩💻 Executives: Monitor overall employee well-being for strategic planning.
-
🧑🔬 Health Consultants: Measure the success of wellness campaigns across different demographics.
Whether you manage a small office or a global workforce, this dashboard simplifies wellness tracking for every team.
🚀 Why Choose This Dashboard
✅ All-in-one visualization of employee well-being
✅ Real-time data monitoring
✅ Easy to customize and share
✅ Reduces reporting effort and manual analysis
✅ Drives data-backed wellness decisions
With this dashboard, your wellness program becomes more transparent, measurable, and impactful — ensuring that every initiative adds value to your people and your organization.
📖 Click here to read the Detailed blog post
👉 Visit our YouTube channel to learn step-by-step video tutorials


Reviews
There are no reviews yet.