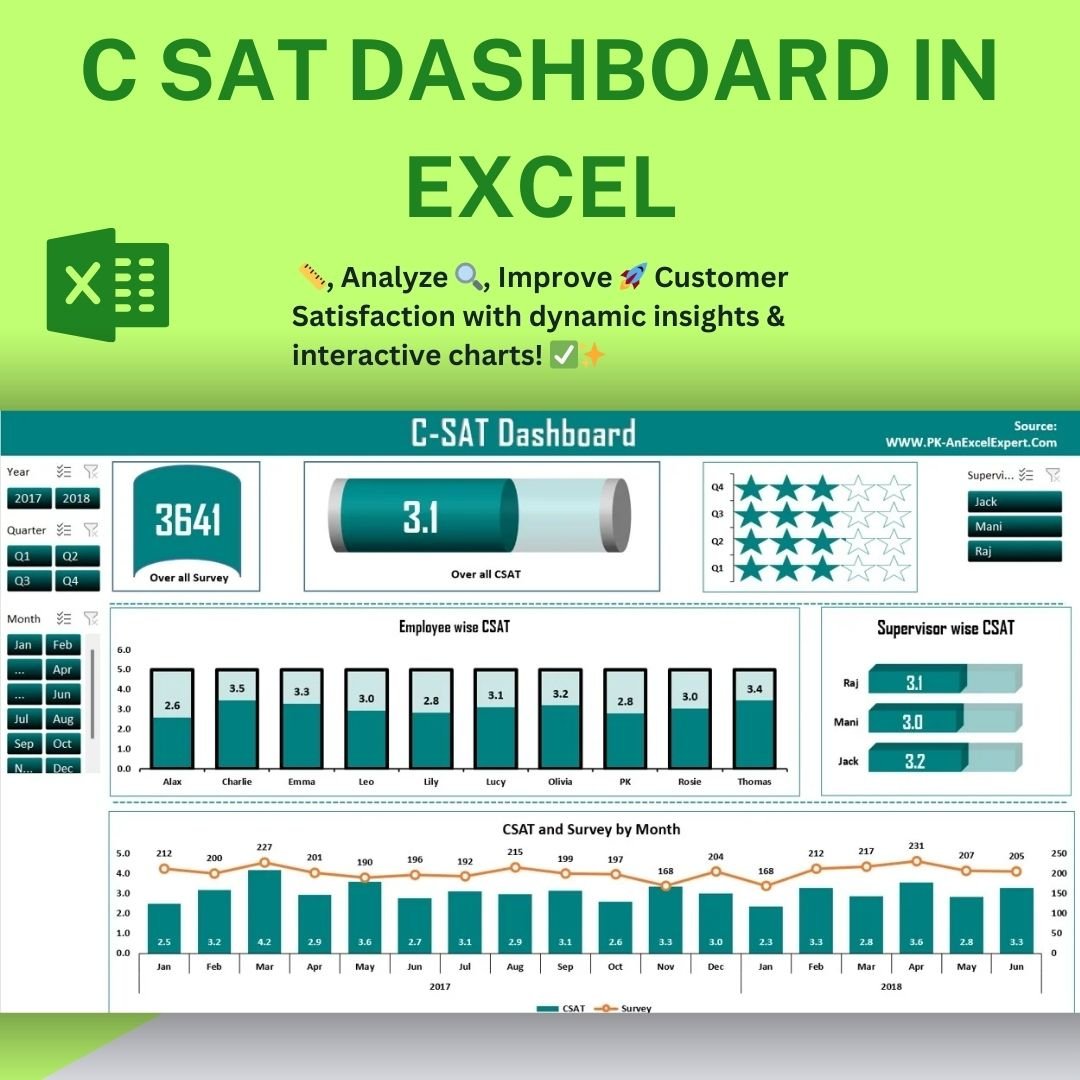
Understanding customer satisfaction is crucial for any business, and this C SAT Dashboard in Excel provides an automated, interactive, and data-driven solution for monitoring and analyzing Customer Satisfaction (CSAT) scores. Designed for organizations seeking deeper insights into employee-wise and supervisor-wise performance, this dashboard helps businesses track customer experience trends effectively.
This feature-rich Excel template offers real-time insights, visual storytelling, and an easy-to-use interface that allows users to analyze trends and measure performance at different organizational levels. Whether you’re tracking CSAT scores across years, quarters, or months, or need detailed insights on specific employees and supervisors, this dashboard simplifies data visualization.C SAT Dashboard in Excel
Key Features :C SAT Dashboard in Excel
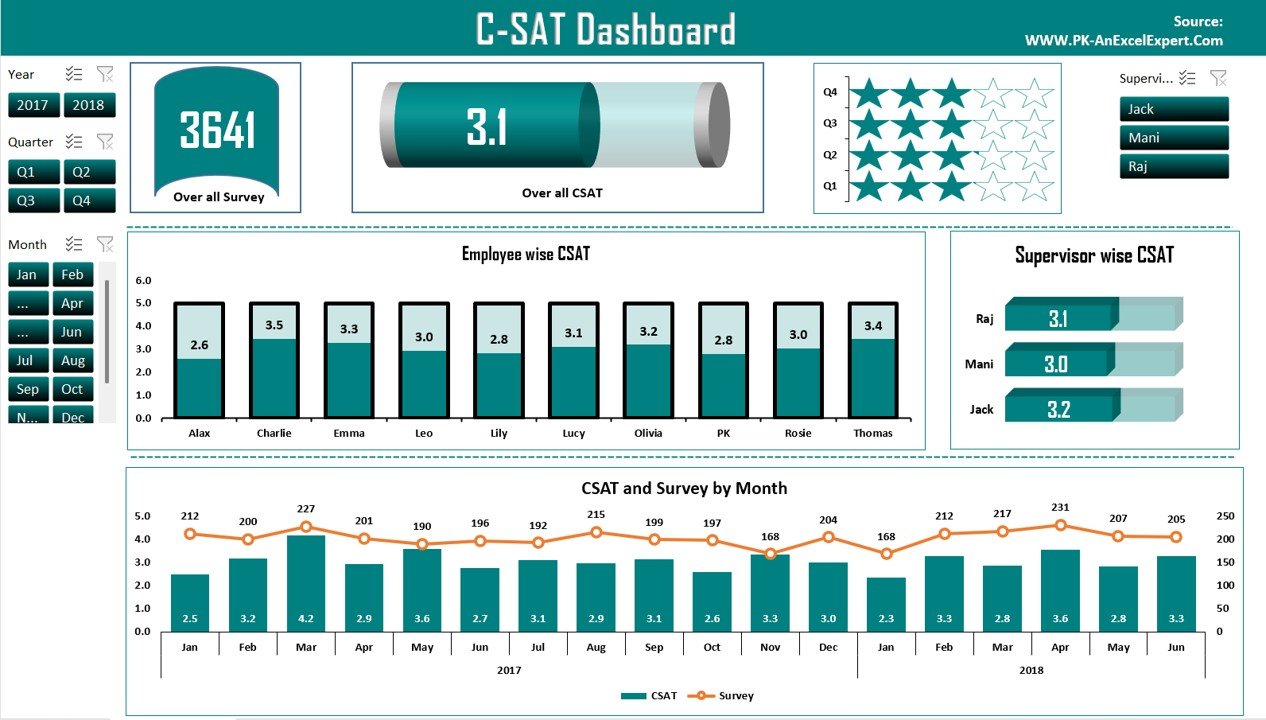
📊 Interactive Slicers for Advanced Filtering
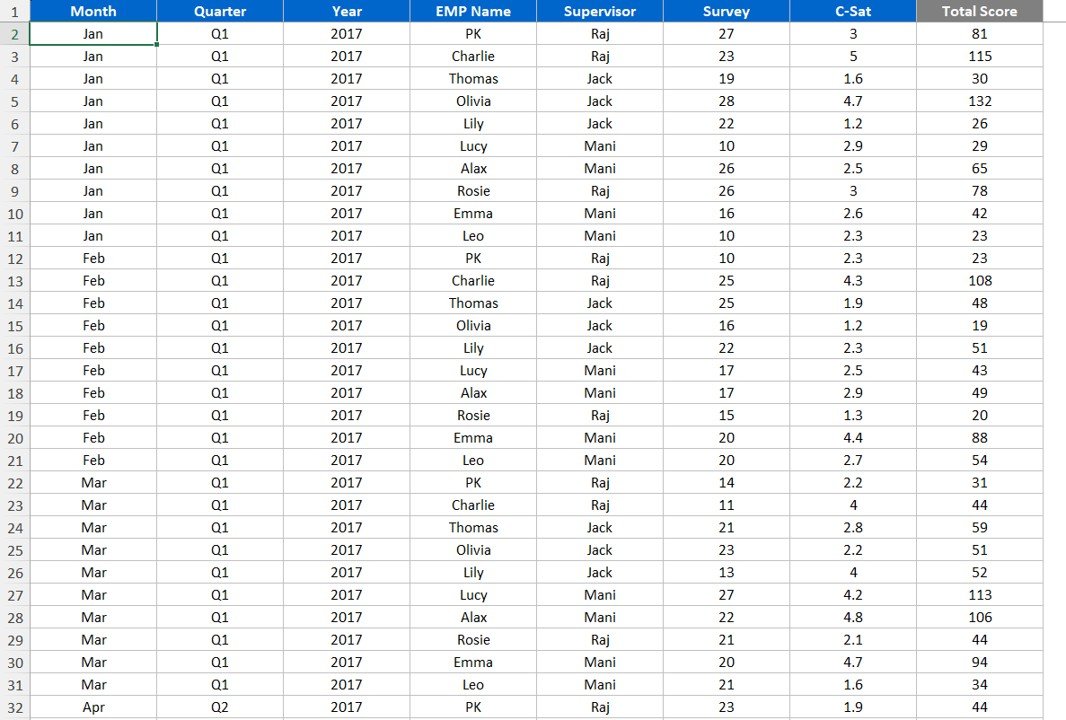
- Filter CSAT scores by Year, Quarter, Month, and Supervisor using dynamic slicers to gain customized insights.
- Quickly analyze trends and make data-backed decisions with one-click filtering.
📈 Segmented Data Visualization for Clear Insights
- Battery Chart: Displays overall CSAT performance with an easy-to-read visual gauge.
- Star Chart: Highlights CSAT scores across different quarters, providing a holistic view of the organization’s customer satisfaction levels.
- Filling Column Chart: Presents employee-wise CSAT ratings, helping businesses pinpoint top-performing employees.
📉 Dynamic Analysis Tools for Supervisor Performance
- 3D Bar Charts: Compare CSAT ratings among supervisors to identify strengths and areas for improvement.
- Combo Charts: Track monthly CSAT scores alongside the number of survey responses, enabling better correlation between customer engagement and satisfaction.
- Trend Analysis: Evaluate employee-wise and supervisor-wise performance metrics in one place.
🎨 Aesthetic and Functional Design
- Visually appealing and professionally designed dashboard layout.
- Simplifies complex data analysis while maintaining a clean and engaging presentation.
⚡ Customizable and Scalable
- The dashboard is fully adaptable, allowing businesses to modify and expand it as needed.
- Additional data fields, metrics, or visualization enhancements can be integrated effortlessly.
How This Dashboard Helps You
✅ Improves decision-making by providing detailed CSAT score analysis.
✅ Enhances employee and supervisor accountability with transparent data tracking.
✅ Identifies trends in customer satisfaction for proactive problem-solving.
✅ Boosts efficiency by automating survey data analysis in Excel.
This C-SAT Dashboard in Excel is perfect for customer service teams, HR managers, and business analysts looking to elevate customer satisfaction management with an easy-to-use, visually rich reporting system.
Click here to read the detailed blog post C SAT Dashboard in Excel
Watch the step-by-step video tutorial:
Also check our Project Management Dashboard in Excel


Reviews
There are no reviews yet.