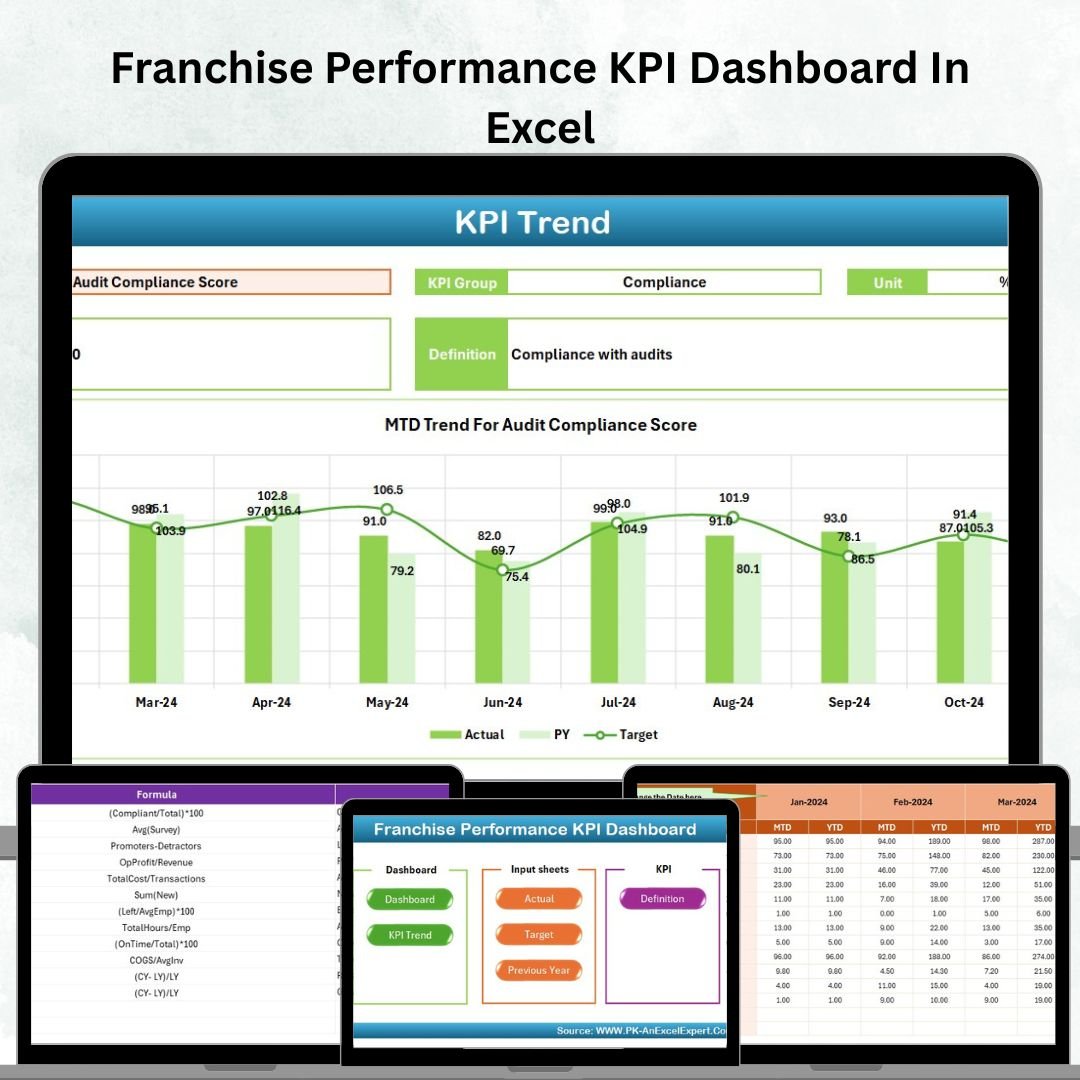

Managing a franchise network isn’t easy. With multiple outlets, varying locations, and different teams, keeping track of performance can quickly turn into chaos. That’s why we created the Franchise Performance KPI Dashboard in Excel – your all-in-one tool to monitor, measure, and master franchise performance with just a few clicks. Franchise Performance KPI Dashboard In Excel
This ready-to-use Excel dashboard simplifies how you manage KPIs across outlets. Instead of juggling scattered reports or relying on guesswork, you get a centralized system with real-time data insights. Whether you’re tracking sales growth, outlet performance, or year-on-year results, this dashboard puts everything at your fingertips in a clean, visual format.
With interactive charts, variance analysis, and automated calculations, you can instantly see where each branch stands against targets, last year’s performance, or overall growth goals. That means faster decision-making, improved accountability, and consistent results across your entire franchise network.Franchise Performance KPI Dashboard In Excel
✨ Key Features of the Franchise Performance KPI Dashboard
-
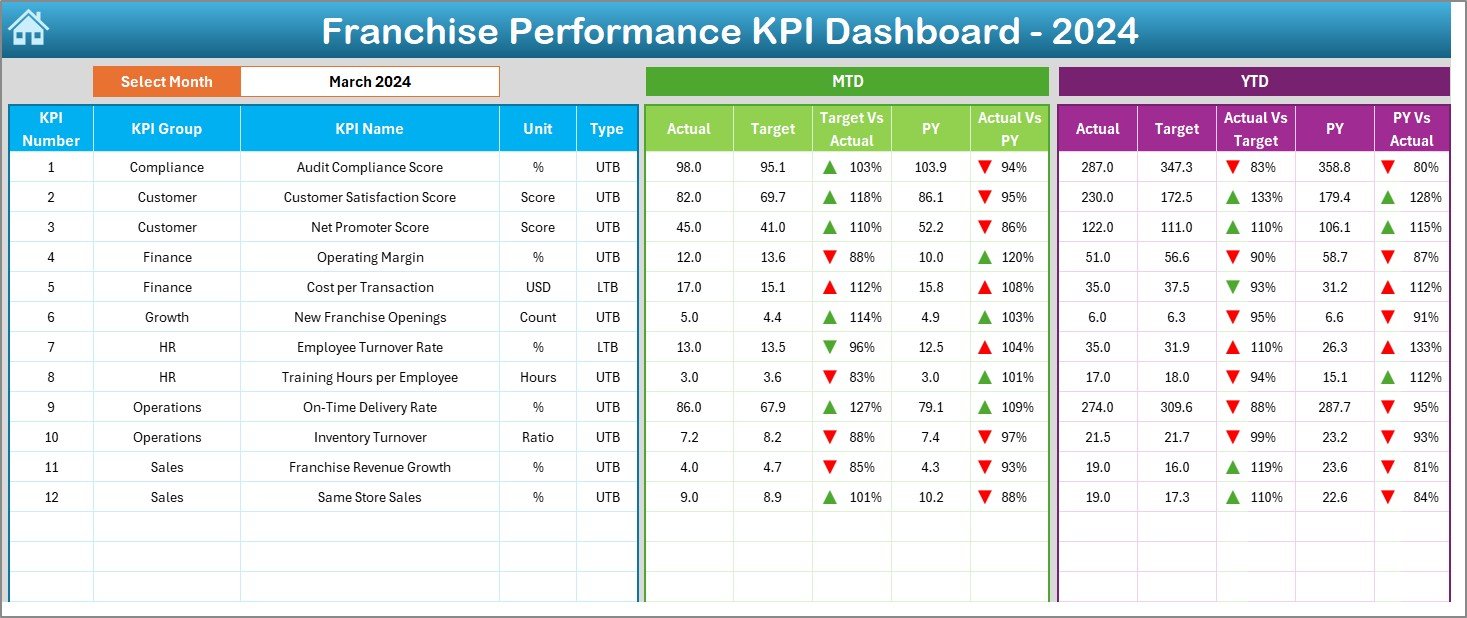
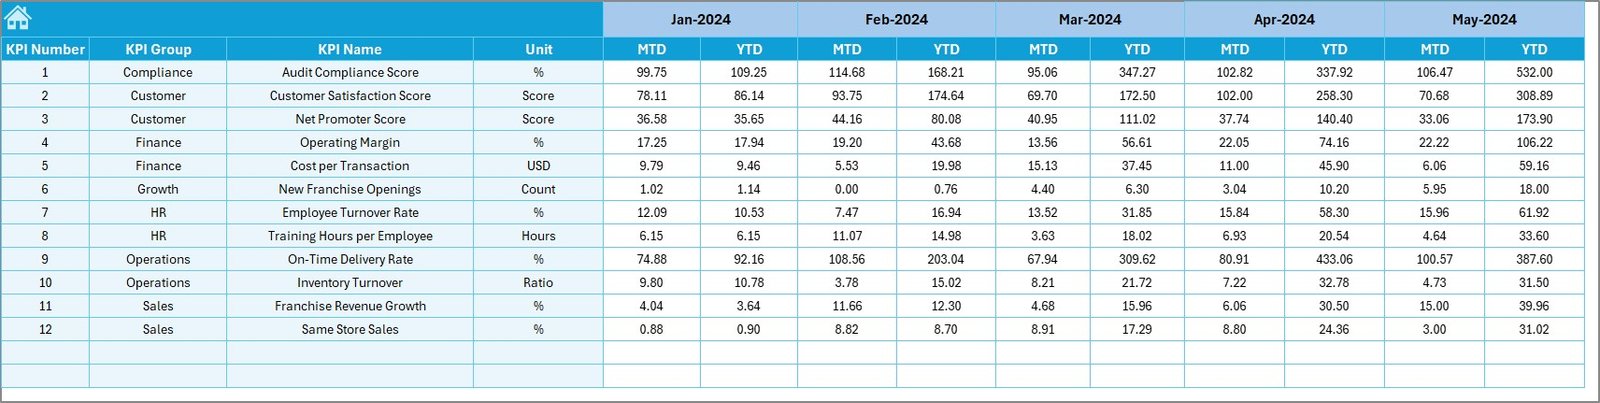
📊 Dashboard Sheet – Central hub to view MTD, YTD, and Previous Year data side by side.
-
🎯 Target vs Actual – Instantly see how outlets are performing against set goals.
-
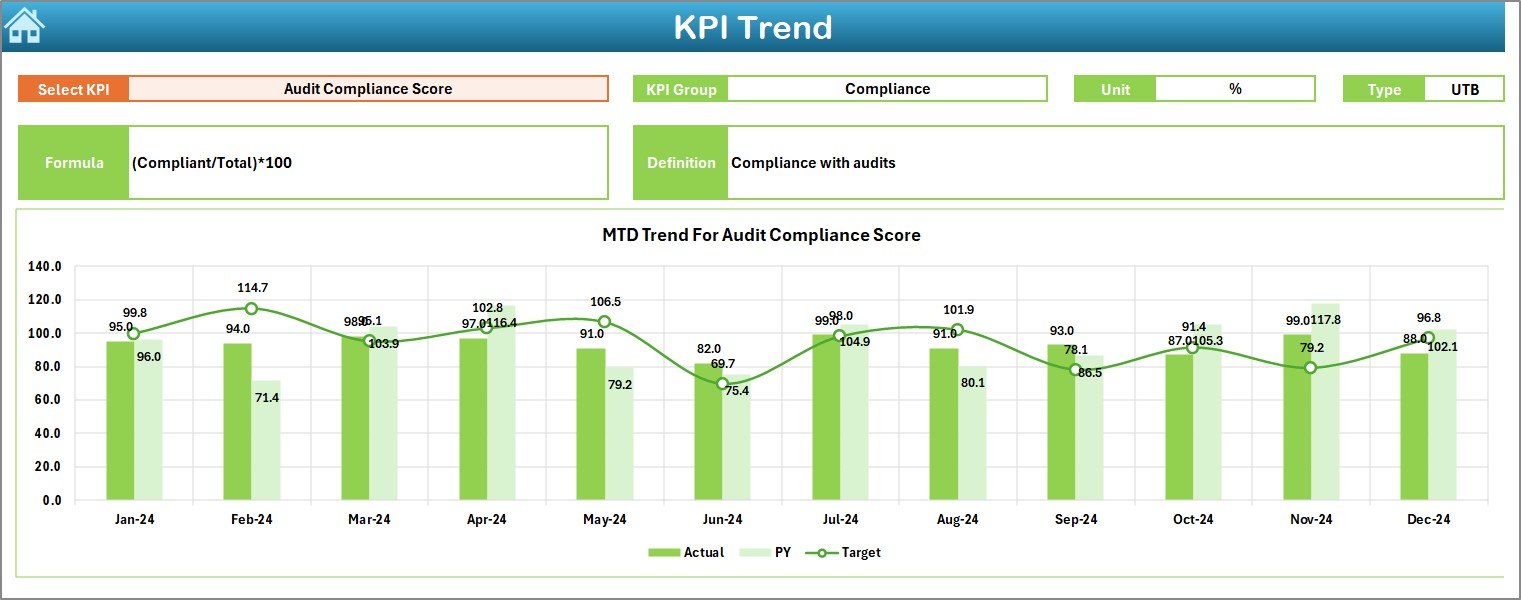
📈 KPI Trend Analysis – Select KPIs and track their trends with clear visuals.
-
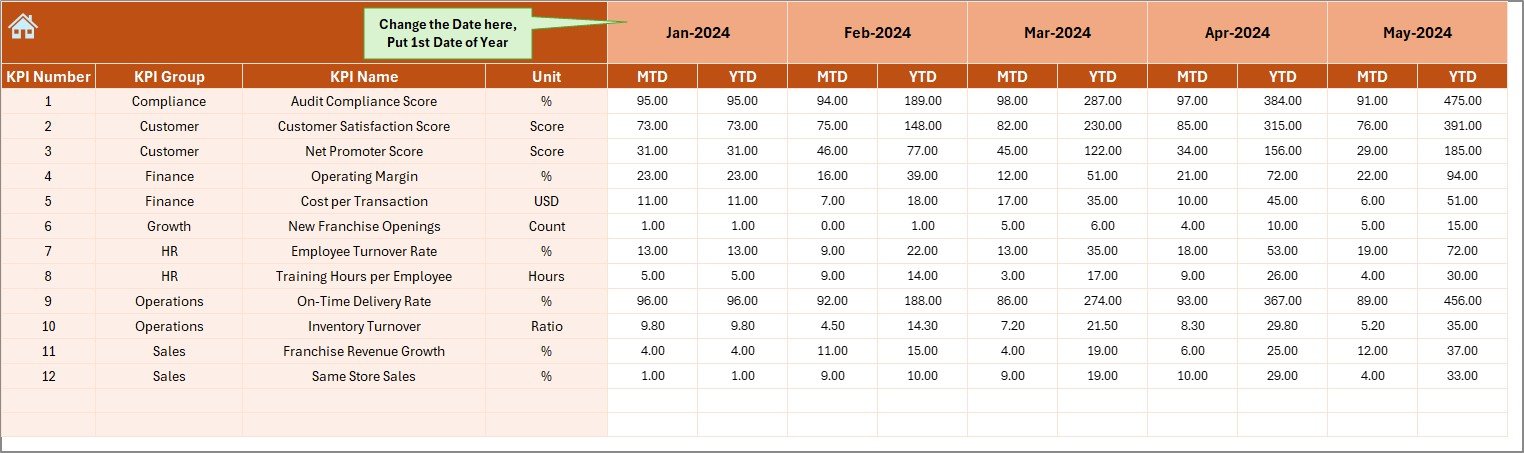
🗂️ Data Input Sheets – Simple entry system for actuals, targets, and previous year comparisons.
-
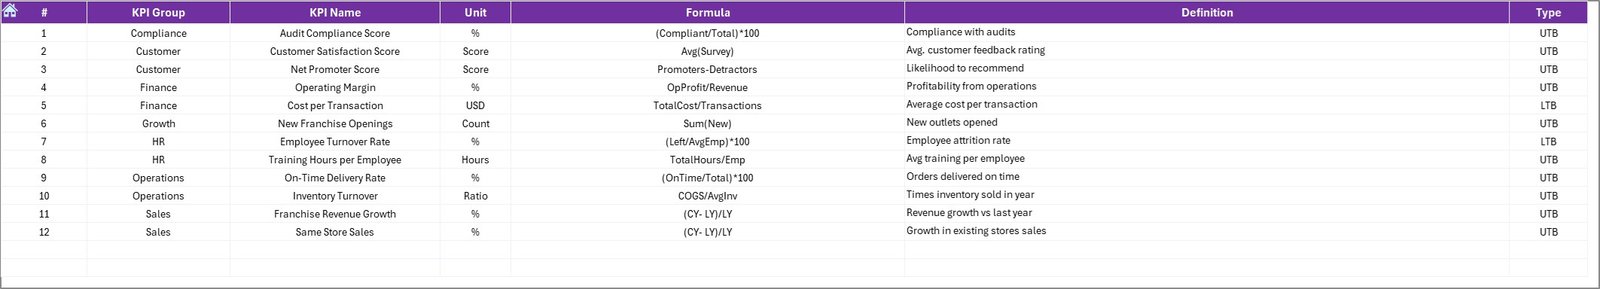
🧾 KPI Definition Sheet – Complete reference guide with Group, Unit, Formula, and Definition.
-
📌 Conditional Formatting – Up/down arrows and alerts for quick performance insights.Franchise Performance KPI Dashboard In Excel
-
🏷️ Home Sheet Navigation – One-click buttons to jump between sections.
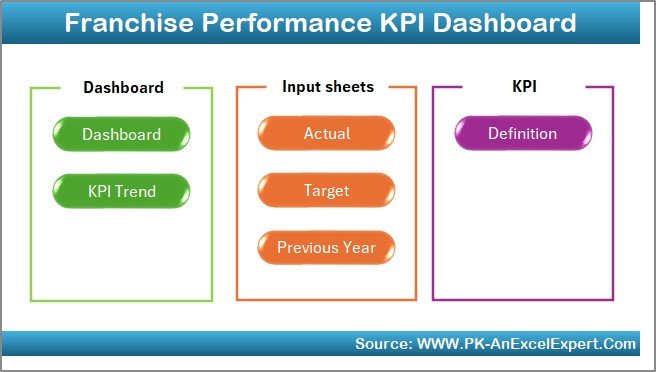
📂 What’s Inside the Franchise Performance KPI Dashboard
When you download this Excel dashboard, you’ll get access to:
-
🏠 Home Sheet – A quick index with six navigation buttons for easy access.
-
📊 Dashboard Sheet – MTD, YTD, and PY insights with variance analysis.
-
📉 KPI Trend Sheet – Deep-dive into specific KPIs with charts and comparisons.
-
📝 Actual Numbers Input Sheet – Enter real-time performance data.
-
🎯 Target Sheet – Store monthly and yearly goals for comparison.Franchise Performance KPI Dashboard In Excel
-
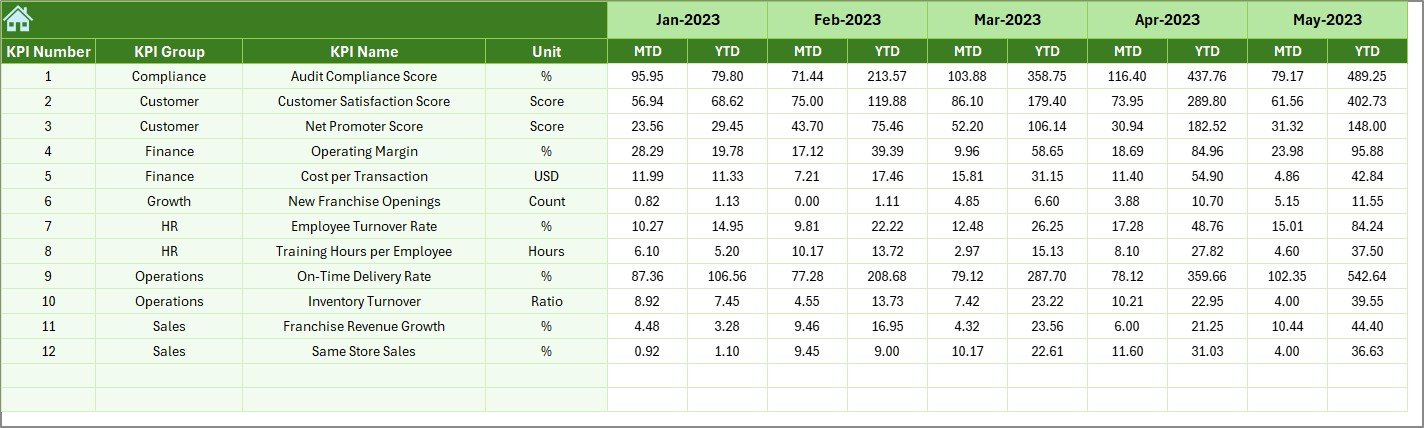
📆 Previous Year Numbers Sheet – Evaluate growth or decline year-on-year.
-
📖 KPI Definition Sheet – A detailed glossary for all tracked KPIs.
🛠️ How to Use the Franchise Performance KPI Dashboard
-
Enter Data – Input MTD and YTD numbers in the Actual Numbers sheet.
-
Set Targets – Record monthly and yearly goals in the Target sheet.
-
Update PY Data – Add last year’s numbers for accurate comparisons.
-
Analyze KPIs – Use slicers and drop-down menus to explore trends.
-
Review Variances – Spot red flags quickly using conditional formatting.
-
Take Action – Use insights to make better business decisions.
No advanced Excel skills are required. The dashboard is beginner-friendly and works right out of the box.
👥 Who Can Benefit from This Franchise Performance KPI Dashboard?
-
🍔 Restaurant & Food Franchise Owners – Track sales, service quality, and outlet performance.
-
🏫 Education Franchises – Monitor enrollments, fees, and retention rates.
-
🏥 Healthcare Franchises – Track patient volumes, service quality, and profitability.
-
🛍️ Retail Chains – Manage sales, customer experience, and employee efficiency.
-
🌍 Global Franchise Networks – Standardize reporting and maintain consistency across countries.
Whether you run a small local chain or a global brand, this dashboard ensures that every outlet contributes to your growth story.
Click here to read the Detailed blog post
Watch the step-by-step video tutorial:
Visit our YouTube channel to learn step-by-step video tutorials


Reviews
There are no reviews yet.