Running a retail store is no easy task. Between sales, customer service, inventory, staffing, and daily operations, it’s challenging to keep track of performance without a structured system. That’s exactly where the Store Operations KPI Dashboard in Excel comes in — a powerful, affordable, and easy-to-use tool that transforms raw store data into clear insights 📊.
This Excel-based dashboard is designed for retailers who want to track results, make data-driven decisions, and boost profitability without relying on expensive software. With automated updates, interactive visuals, and structured KPI tracking, you’ll always know where your store stands.
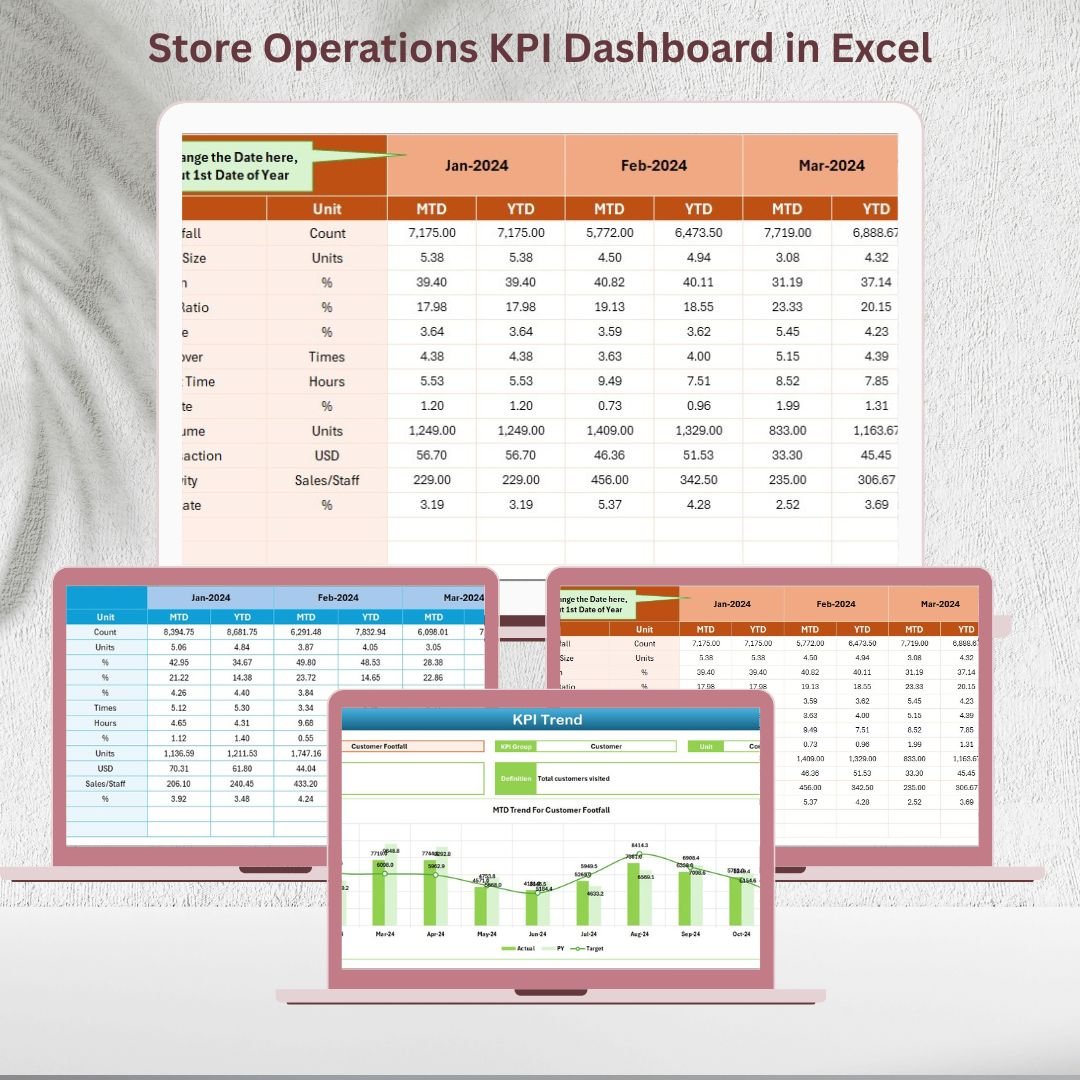
🔑 Key Features of the Store Operations KPI Dashboard in Excel
✨ 7 Dedicated Sheets for Organized Data – From KPI definitions to actual inputs, targets, and previous year data.
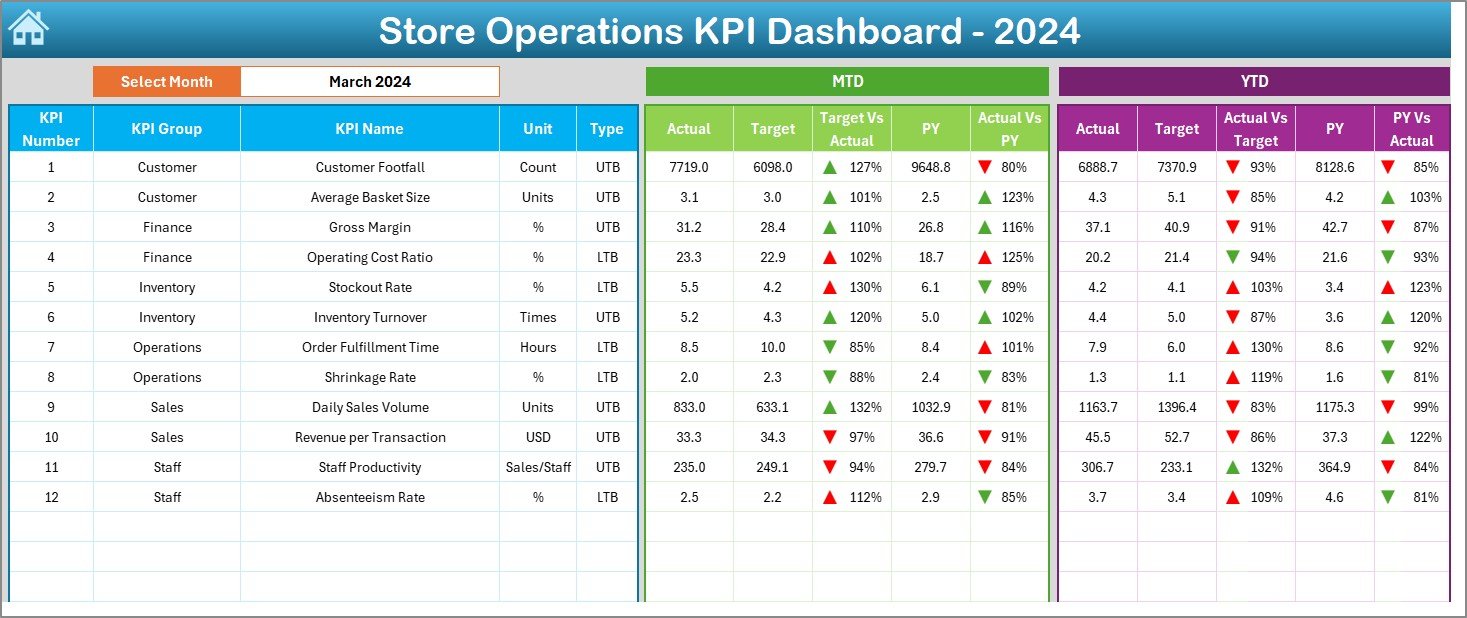
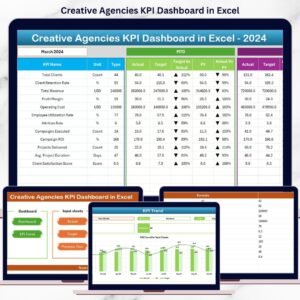
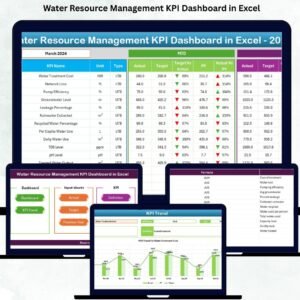
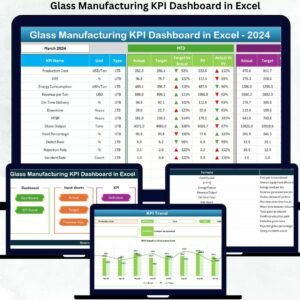
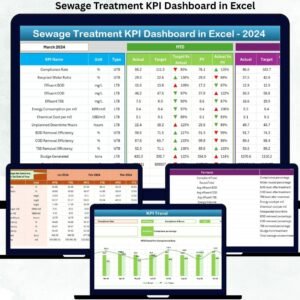
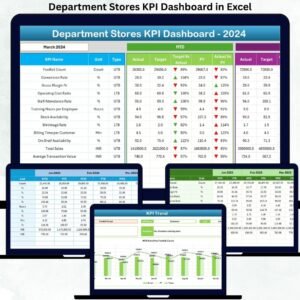
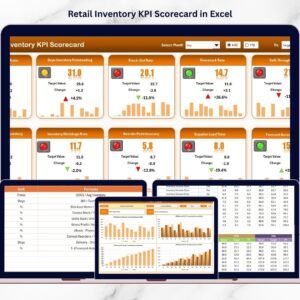
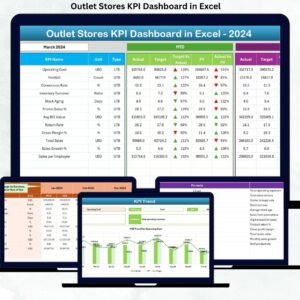
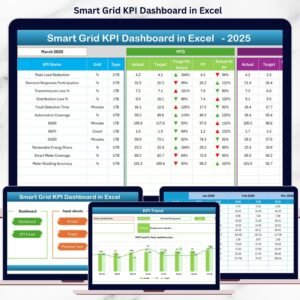
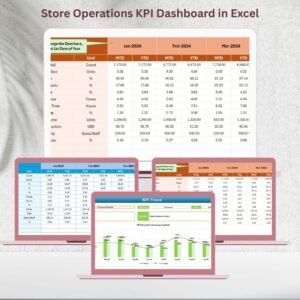
✨ Interactive Dashboard Sheet – Select any month and instantly see MTD (Month-to-Date) and YTD (Year-to-Date) comparisons with conditional formatting arrows.
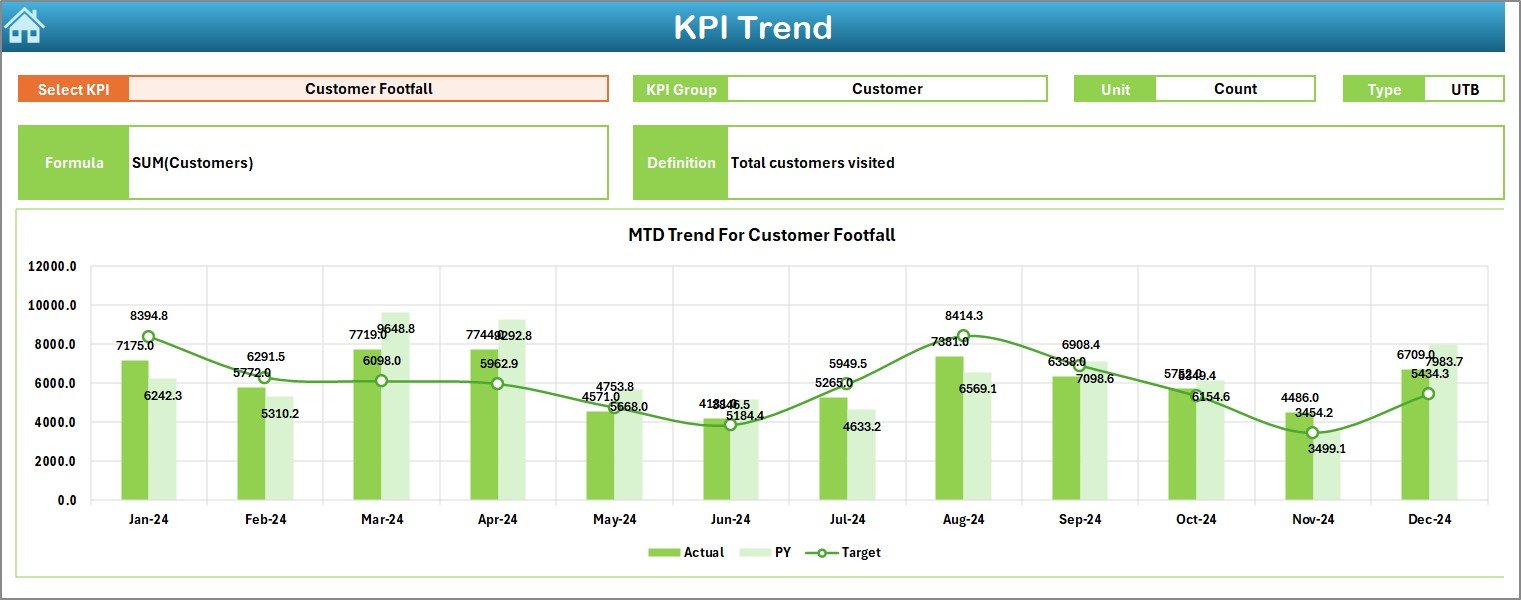
✨ KPI Trend Analysis – Drill down into individual KPIs to see formulas, definitions, and trend charts for smarter analysis.
✨ Automatic Comparisons – Quickly measure current performance vs targets and previous year benchmarks.
✨ User-Friendly Navigation – Home sheet buttons let you jump directly to different tabs.
✨ Customizable for Any Store – Add or modify KPIs based on your specific business needs.
✨ Cost-Effective & Scalable – Get professional insights without expensive BI tools.
📂 What’s Inside the Store Operations KPI Dashboard in Excel
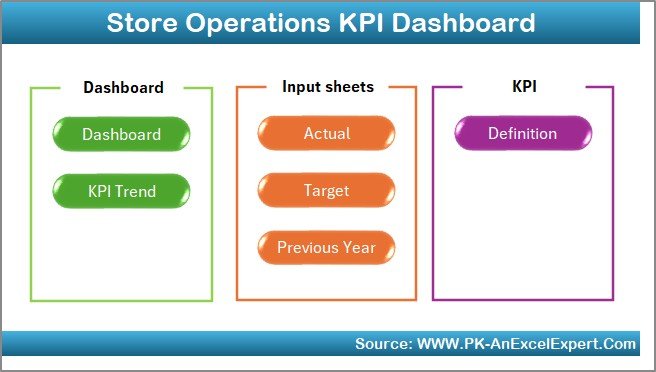
When you download this template, you’ll find:
-
Home Sheet 🏠 – Quick navigation hub with clickable buttons.
-
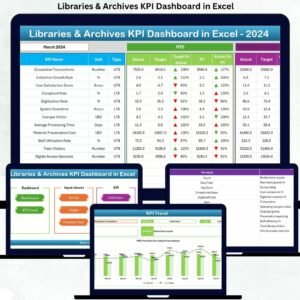
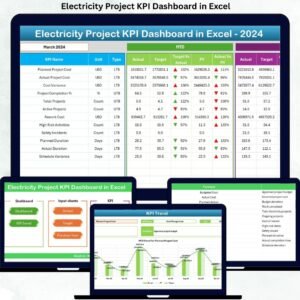
Dashboard Sheet 📊 – Main page showing MTD, YTD, Actual vs Target, and YoY comparisons.
-
KPI Trend Sheet 📈 – Drill-down charts and KPI-specific analysis.
-
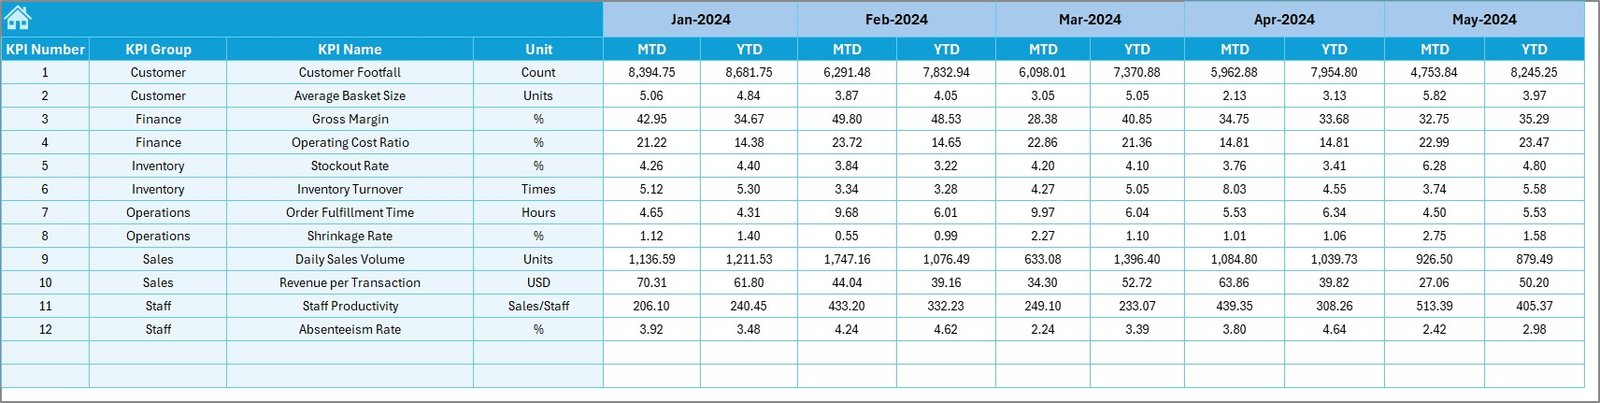
Actual Numbers Input Sheet ✍ – Enter monthly performance data.
-
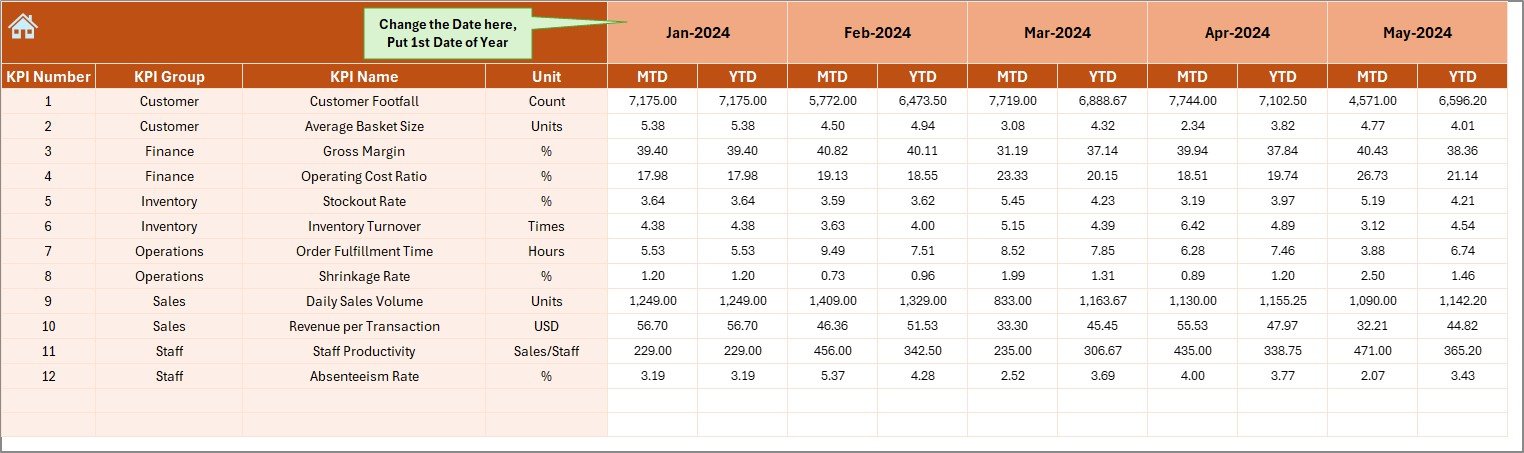
Target Sheet 🎯 – Set and track monthly/yearly targets.
-
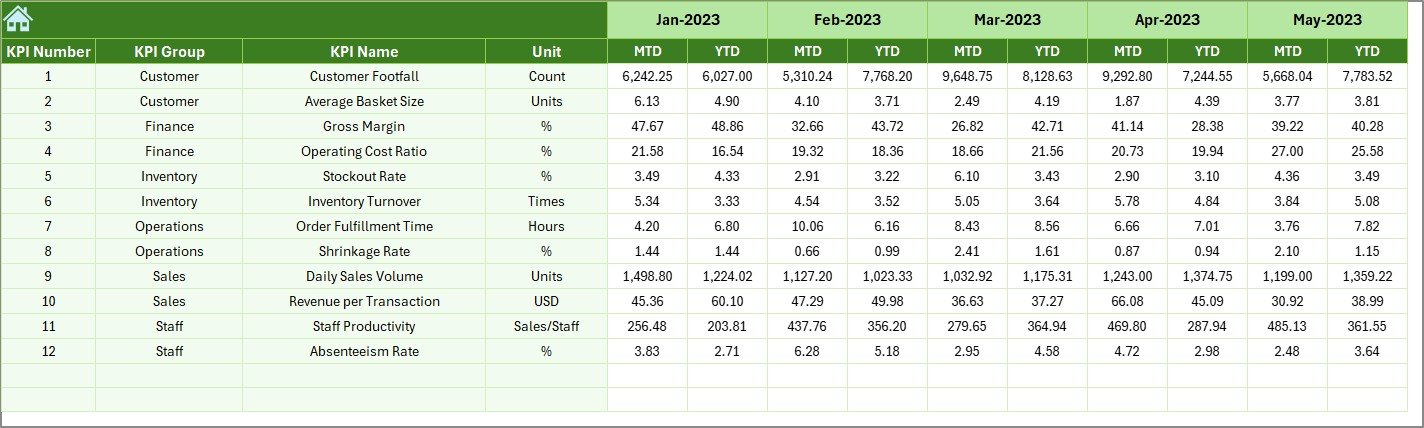
Previous Year Numbers Sheet 🔄 – Compare performance against last year.
-
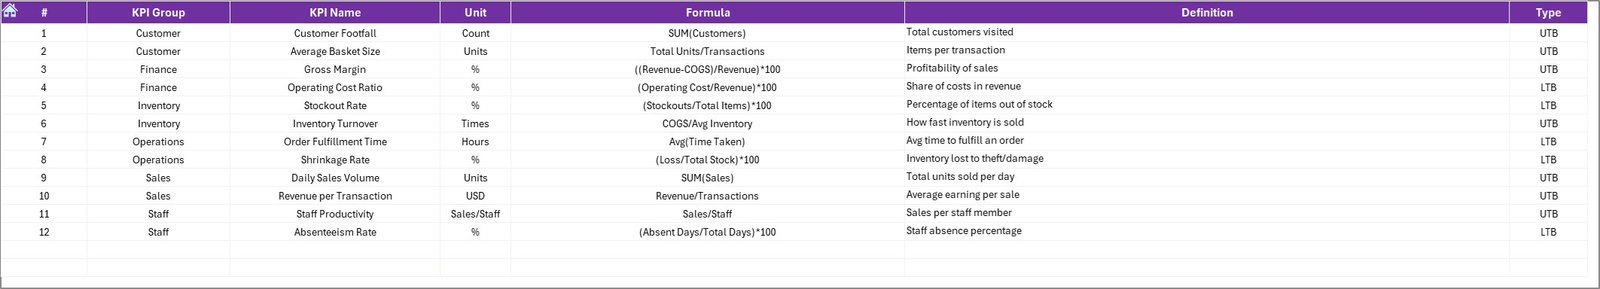
KPI Definition Sheet 📑 – A structured list of KPI names, formulas, and units.
This structure ensures that all store performance data is centralized, easy to update, and simple to interpret.
🛠 How to Use the Store Operations KPI Dashboard in Excel
-
Define Your KPIs – Use the KPI Definition Sheet to clearly set measurement units, formulas, and types (UTB or LTB).
-
Set Monthly Targets – Enter realistic goals in the Target Sheet.
-
Add Previous Year Data – For benchmarking and YoY comparisons.
-
Input Actual Numbers – Update your store’s real performance figures every month.
-
Navigate the Dashboard – Use the drop-down menu to select the month, and the dashboard updates automatically.
-
Analyze KPI Trends – Drill down into detailed KPI trends to see what’s improving and what needs attention.
-
Make Informed Decisions – Identify strengths, weaknesses, and opportunities to maximize profitability.
No complex coding, no advanced BI setup — just plug in your numbers and Excel does the rest!
👥 Who Can Benefit from This Dashboard?
✔️ Retail Store Managers – Track day-to-day performance with clarity.
✔️ Regional Heads – Compare multiple branches and analyze growth trends.
✔️ Business Owners – Gain full visibility into store operations without extra software costs.
✔️ Customer Service Leaders – Measure satisfaction and conversion rates.
✔️ Finance & Operations Teams – Monitor expenses, labor costs, and shrinkage percentages.
✔️ E-commerce Managers – Adapt KPIs like footfall to website traffic for online stores.
Whether you manage one store or multiple branches, this dashboard equips you with actionable insights for smarter retail management.
Click here to read the Detailed blog post
Watch the step-by-step video tutorial:
Visit our YouTube channel to learn step-by-step video tutorials.


Reviews
There are no reviews yet.