

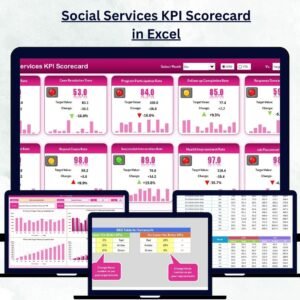
In today’s fast-paced business environment, innovation and transformation are no longer optional—they’re critical for survival. Companies that measure, monitor, and adapt their innovation strategies stay ahead of the competition, while those that don’t risk falling behind. Innovation & Transformation KPI Dashboard in Excel the challenge? Tracking innovation efforts and transformation progress in a structured, data-driven way.
✨ That’s where the Innovation & Transformation KPI Dashboard in Excel comes in. This ready-to-use performance management tool helps leaders, managers, and project teams monitor progress, track KPIs, and evaluate success with ease. Built in Excel, it combines structured data entry, automated calculations, and dynamic visuals into one streamlined file.
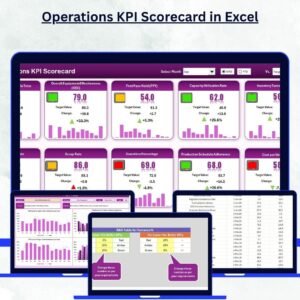
✅ Key Features of the Innovation & Transformation KPI Dashboard
-
📊 Centralized Dashboard – All KPIs in one easy-to-navigate platform.
-
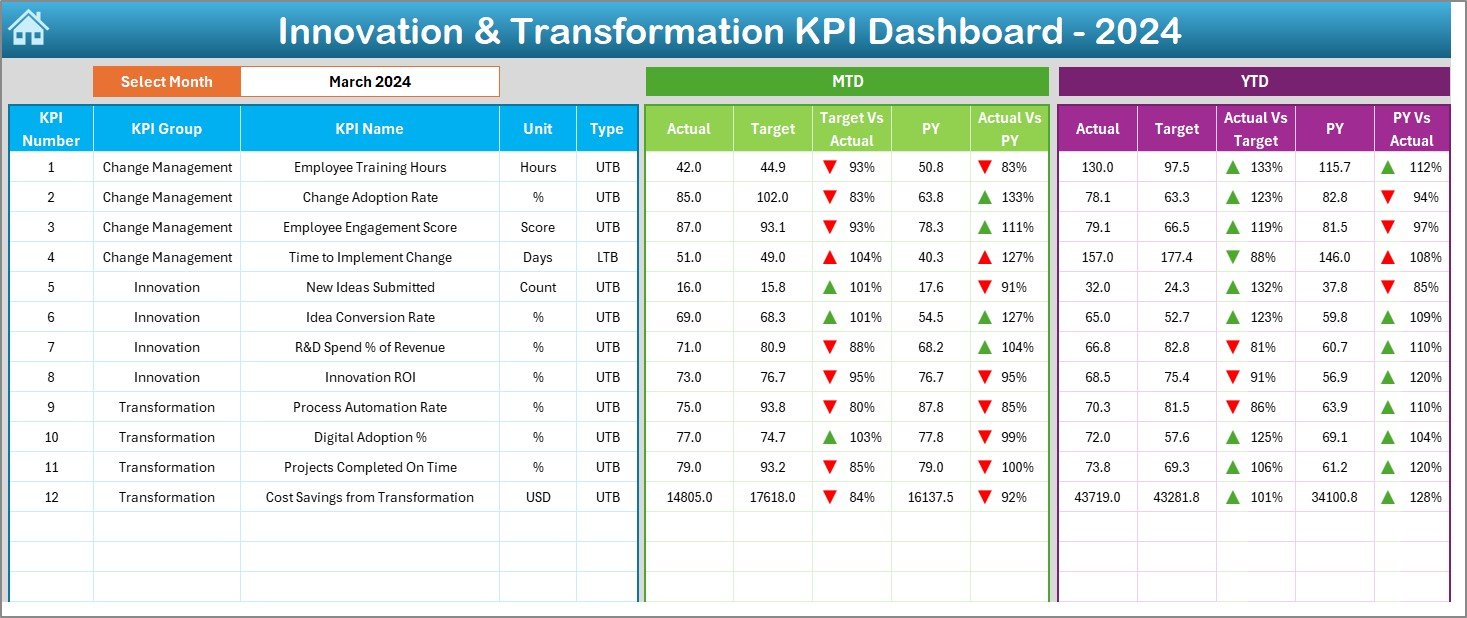
🎯 MTD & YTD Analysis – Track Month-to-Date and Year-to-Date performance.
-
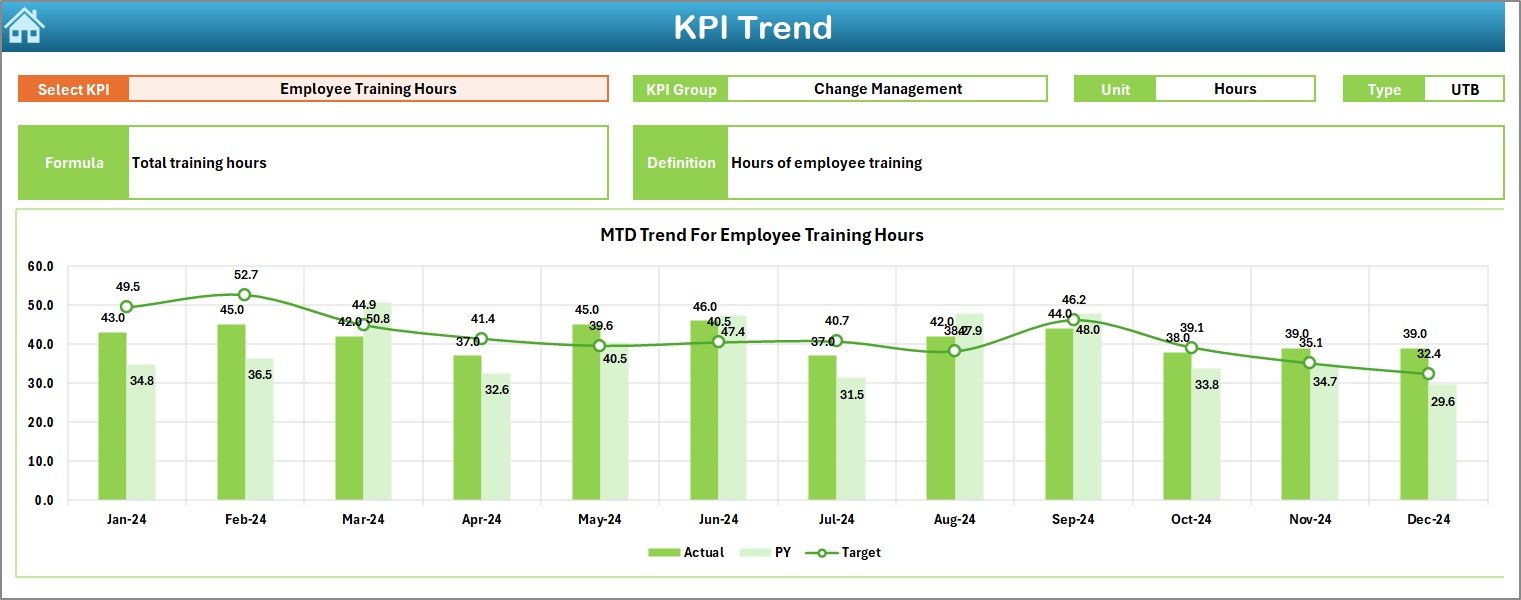
📈 Dynamic KPI Trends – Visualize performance with charts and arrows.
-
🔄 Drop-Down Controls – Switch between KPIs or months in a few clicks.
-
🕒 Automated Calculations – Save time with prebuilt formulas.
-
📂 Structured Data Sheets – Separate tabs for Actuals, Targets, Previous Year, and Definitions.
-
🛠 Customizable KPIs – Add, edit, or modify KPIs to fit your business needs.
-
💡 User-Friendly Design – No advanced Excel skills required.
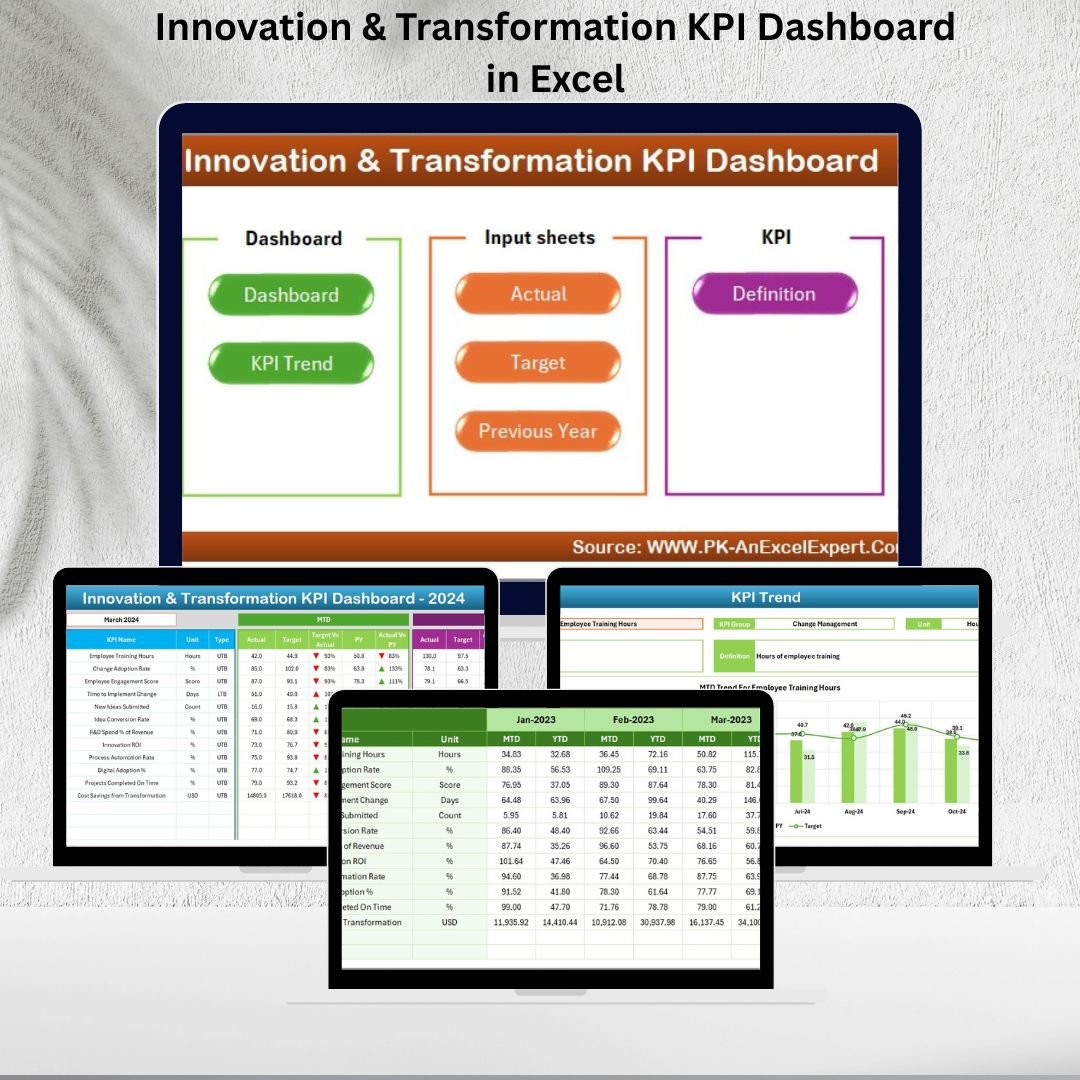
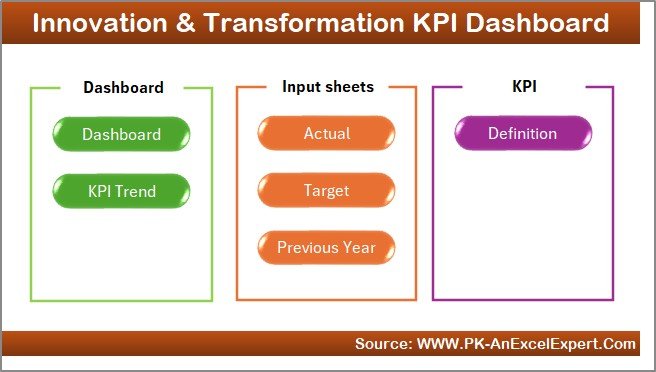
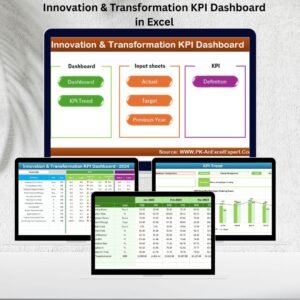
📂 What’s Inside the Dashboard
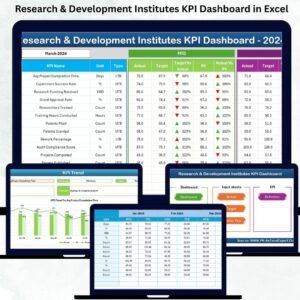
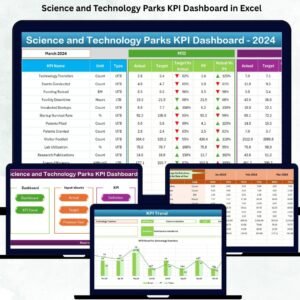
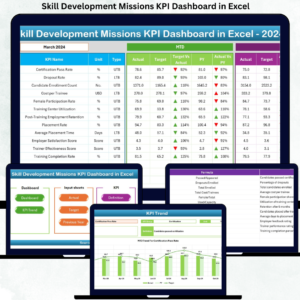
The template includes seven professionally designed worksheets:
-
🏠 Home Sheet – An index page with six navigation buttons for quick access.
-
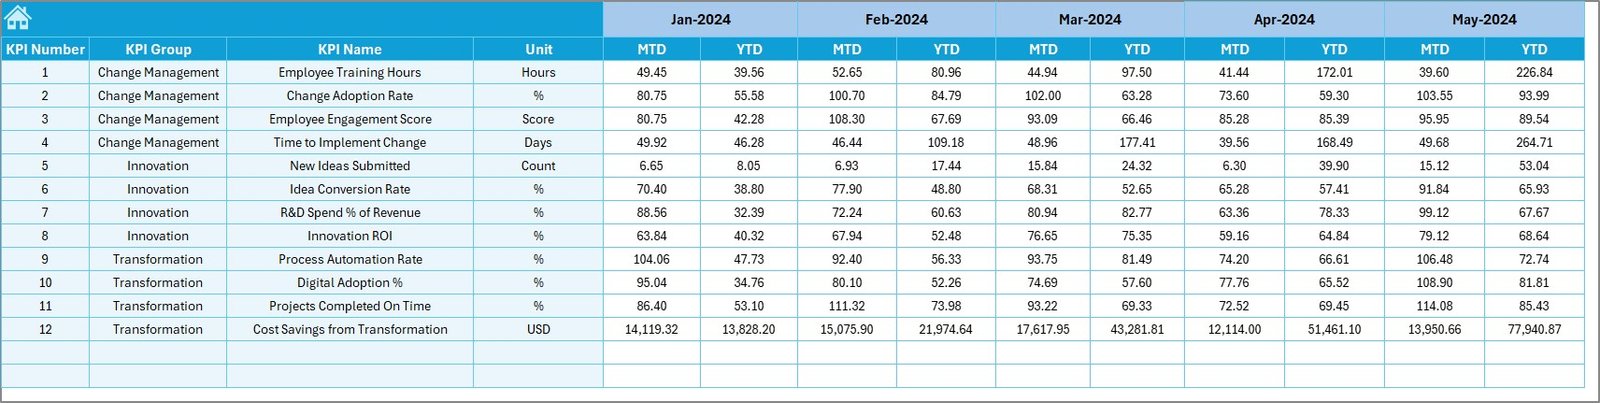
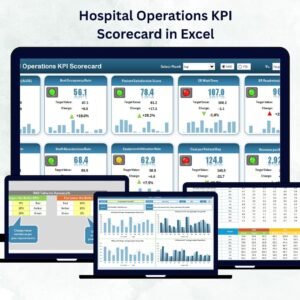
📊 Dashboard Tab – Displays MTD & YTD data with Actual vs Target vs Previous Year comparisons.
-
📈 KPI Trend Sheet – Select KPIs from a drop-down and analyze detailed trends.
-
✍ Actual Numbers Input – Enter monthly performance data.
-
🎯 Target Sheet – Record both MTD and YTD targets.
-
📅 Previous Year Numbers – Keep historical data for benchmarking.
-
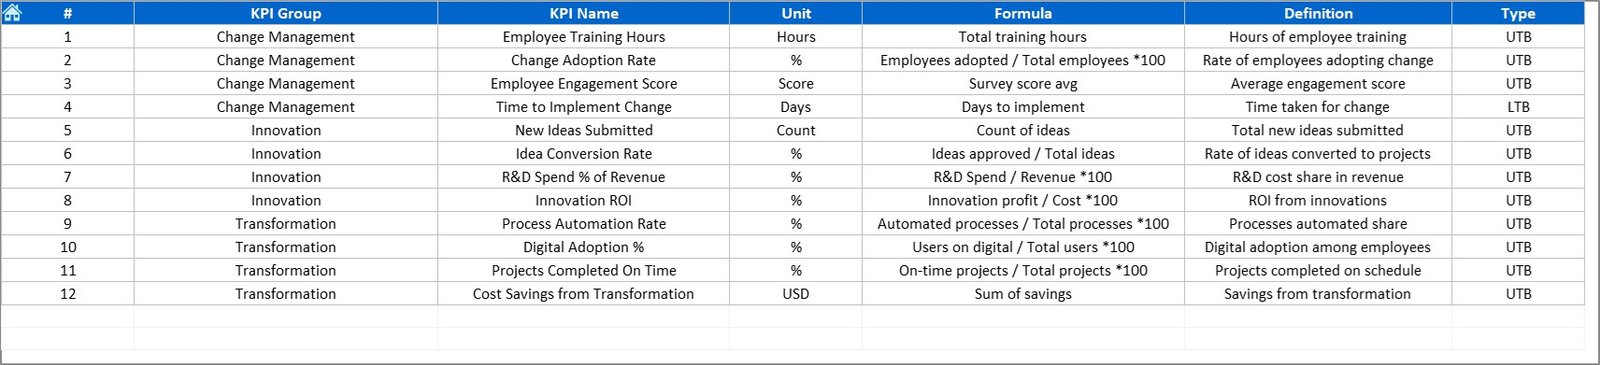
📖 KPI Definition Sheet – Acts as a reference library with KPI details, formulas, and units.
🚀 How to Use the Innovation & Transformation KPI Dashboard
-
Define KPIs – Set up KPI names, units, and formulas in the Definition Sheet.
-
Enter Actuals – Input monthly and yearly values into the Actual Numbers sheet.
-
Set Targets – Add performance benchmarks in the Target Sheet.
-
Review Dashboard – Select a month to instantly see updated KPIs.
-
Analyze Trends – Use the KPI Trend tab for deeper insights.
-
Take Action – Identify gaps with red arrows, celebrate wins with green ones.
💡 Everything is prebuilt—you just enter data, and the dashboard does the rest.
👥 Who Can Benefit from This Dashboard?
-
🏢 Corporate Strategy Teams – Track progress on transformation projects.
-
💡 Innovation Leaders – Measure outcomes of product launches or R&D efforts.
-
👥 HR Departments – Monitor organizational and cultural change adoption.
-
💰 Finance Teams – Align transformation costs with budgets and expected ROI.
-
📊 Project Managers – Track innovation projects across regions or business units.
-
🌍 SMEs & Enterprises – From startups to global firms, this dashboard scales with your needs.
📖 Click here to read the Detailed blog post
Visit our YouTube channel to learn step-by-step video tutorials 👉 PKAnExcelExpert YouTube Channel


Reviews
There are no reviews yet.