
Organizing corporate events requires precision, accountability, and real-time insights. From conferences and trade shows to training sessions and team-building activities, every event involves multiple moving parts — costs, attendance, logistics, and feedback. Tracking all of this manually can be overwhelming and prone to errors.
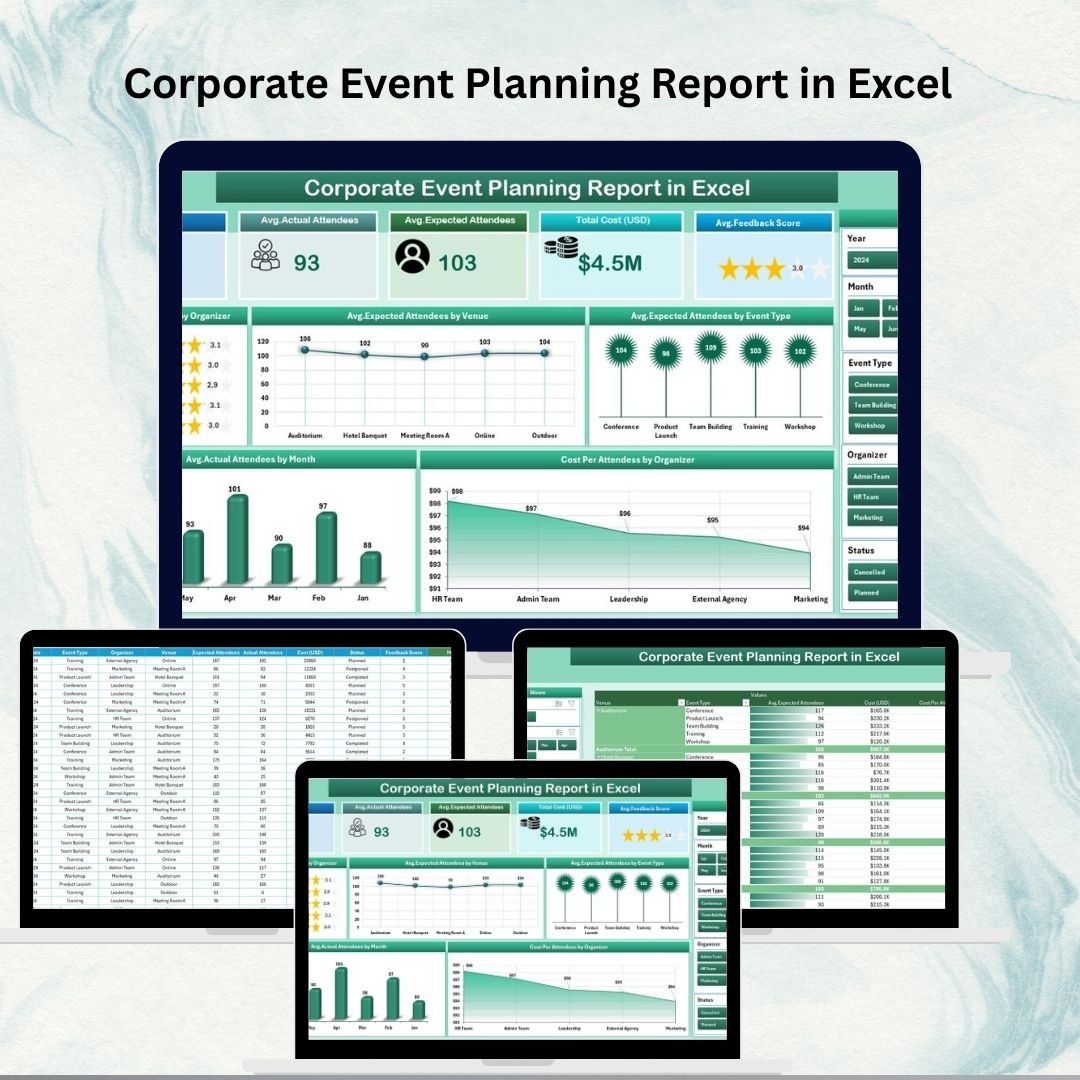
That’s why we designed the Corporate Event Planning Report in Excel — a ready-to-use reporting system that centralizes event data, automates calculations, and delivers powerful visual insights. With built-in dashboards, slicers, and KPIs, this Excel-based tool helps businesses plan smarter, measure performance, and optimize resources for every event.
🔑 Key Features of the Corporate Event Planning Report

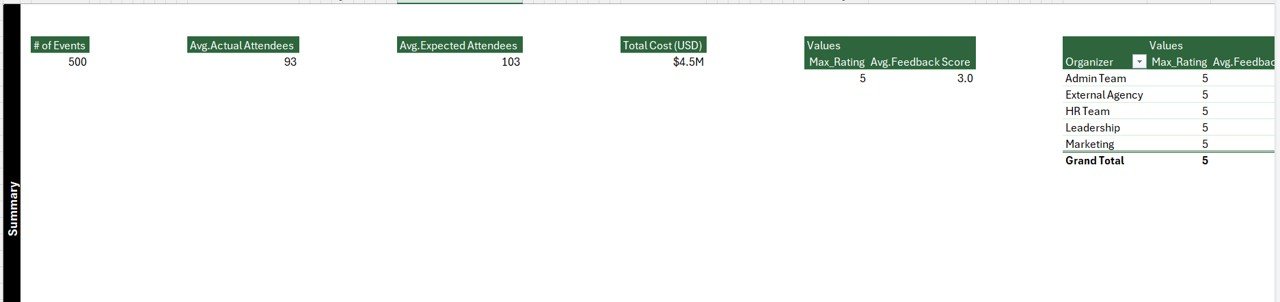
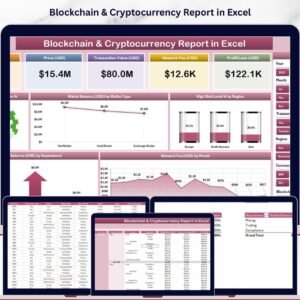
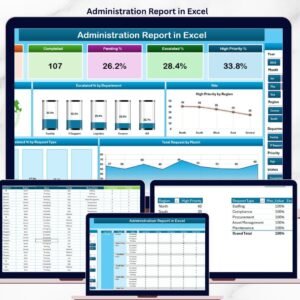
✨ Interactive Dashboard (Summary Page) – Get at-a-glance KPIs such as total events, costs, attendance, feedback score, and organizer count.
✨ Smart Slicers – Filter results by organizer, venue, event type, or month.
✨ Visual Performance Tracking – Charts for feedback scores, expected vs. actual attendance, and cost per attendee.
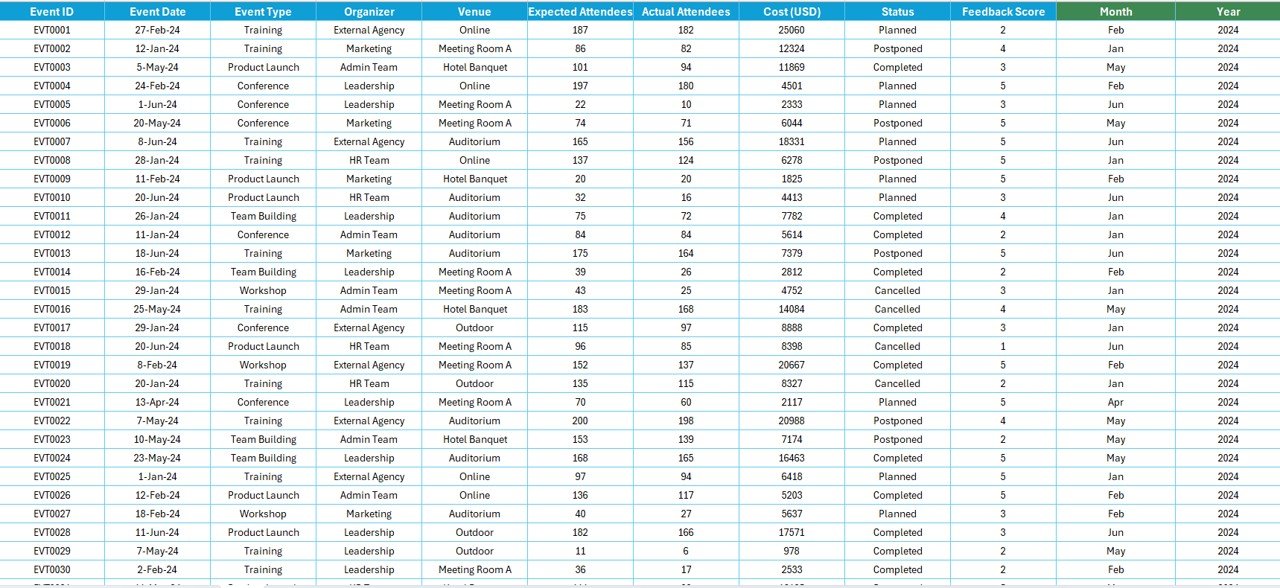
✨ Detailed Report Page – Tabular view of event details including dates, costs, attendance, and feedback.
✨ Centralized Data Sheet – Manage all records (event type, organizer, costs, attendees, and more) in one structured table.
✨ Support Sheet – Dropdown lists for organizers, venues, and event types ensure clean and consistent inputs.
✨ Beginner-Friendly – No advanced Excel skills required. Works out of the box with simple updates.
✨ Scalable – Suitable for small meetings as well as large-scale conferences.
📦 What’s Inside the Corporate Event Planning Report
When you download this Excel template, you’ll get:
1️⃣ Summary Dashboard – KPI cards + slicers + charts for instant insights.
2️⃣ Report Page – Event-by-event data in a structured, filterable table.
3️⃣ Data Sheet – Backbone of the report where all raw event data is stored.
4️⃣ Support Sheet – Reference values for organizers, venues, and categories.
This combination ensures accuracy, time savings, and actionable insights for any corporate event.
🛠️ How to Use the Report
✔️ Step 1 – Input Data: Enter event details (date, type, venue, organizer, costs, expected vs. actual attendees, feedback) in the Data Sheet.
✔️ Step 2 – Analyze Summary: Review key KPIs, charts, and slicers on the Summary Page.
✔️ Step 3 – Drill Down: Use the Report Page for detailed event-by-event data.
✔️ Step 4 – Track Costs & Attendance: Compare costs per attendee, feedback scores, and monthly attendance trends.
✔️ Step 5 – Share Insights: Export visuals into presentations or share the Excel file directly with stakeholders.
It’s a plug-and-play solution — no coding or advanced Excel needed.
👥 Who Can Benefit from This Tool
📊 Event Planners – Manage logistics and measure outcomes efficiently.
👩💼 HR Teams – Track internal employee events, workshops, and trainings.
📈 Marketing Departments – Evaluate promotional events, seminars, and client meetings.
💰 Finance Teams – Monitor event-related costs and calculate ROI.
👔 Senior Management – Gain high-level insights for decision-making.
Whether you’re running a small internal workshop or a large corporate conference, this report ensures you stay on top of performance.
With the Corporate Event Planning Report in Excel, you can:
✅ Centralize all event data in one file.
✅ Automate reporting with pre-built KPIs and charts.
✅ Save time compared to manual tracking.
✅ Optimize budgets with cost-per-attendee analysis.
✅ Improve event quality using attendee feedback insights.
Click here to read the Detailed blog post
Visit our YouTube channel to learn step-by-step video tutorials 👉 Youtube.com/@PKAnExcelExpert


Reviews
There are no reviews yet.