In today’s highly regulated business environment, meeting legal and regulatory requirements is no longer optional—it’s a strategic priority. Missing deadlines or failing to meet compliance standards can result in hefty fines, reputational harm, and operational disruptions. That’s why modern organizations need real-time compliance tracking tools that go beyond spreadsheets and static reports.
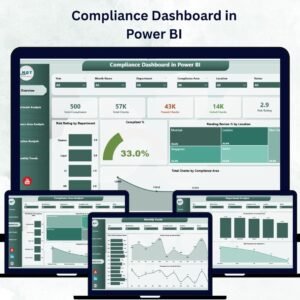
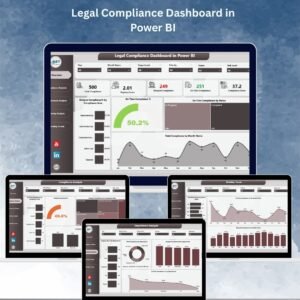
The Legal Compliance Dashboard in Power BI is a ready-to-use, fully interactive solution that transforms your compliance data into actionable insights. By consolidating metrics from multiple sources into visually rich, filterable reports, it empowers compliance officers, department heads, and executives to spot risks early, monitor performance, and take corrective action before it’s too late.
✨ Key Features of the Legal Compliance Dashboard
✅ Five Dedicated Pages – Overview, Compliance Analysis, Department Analysis, Priority Analysis, and Monthly Trends.
✅ Six Interactive Slicers – Filter data instantly by compliance area, department, priority, month, and more.
✅ Real-Time Metrics – Track total compliance count, delayed percentage, on-time percentage, and compliance score.
✅ Drill-Down Capabilities – Move from high-level summaries to detailed departmental or priority-based insights.
✅ Visual Indicators – Bar and line charts, KPI cards, and percentage breakdowns for quick interpretation.
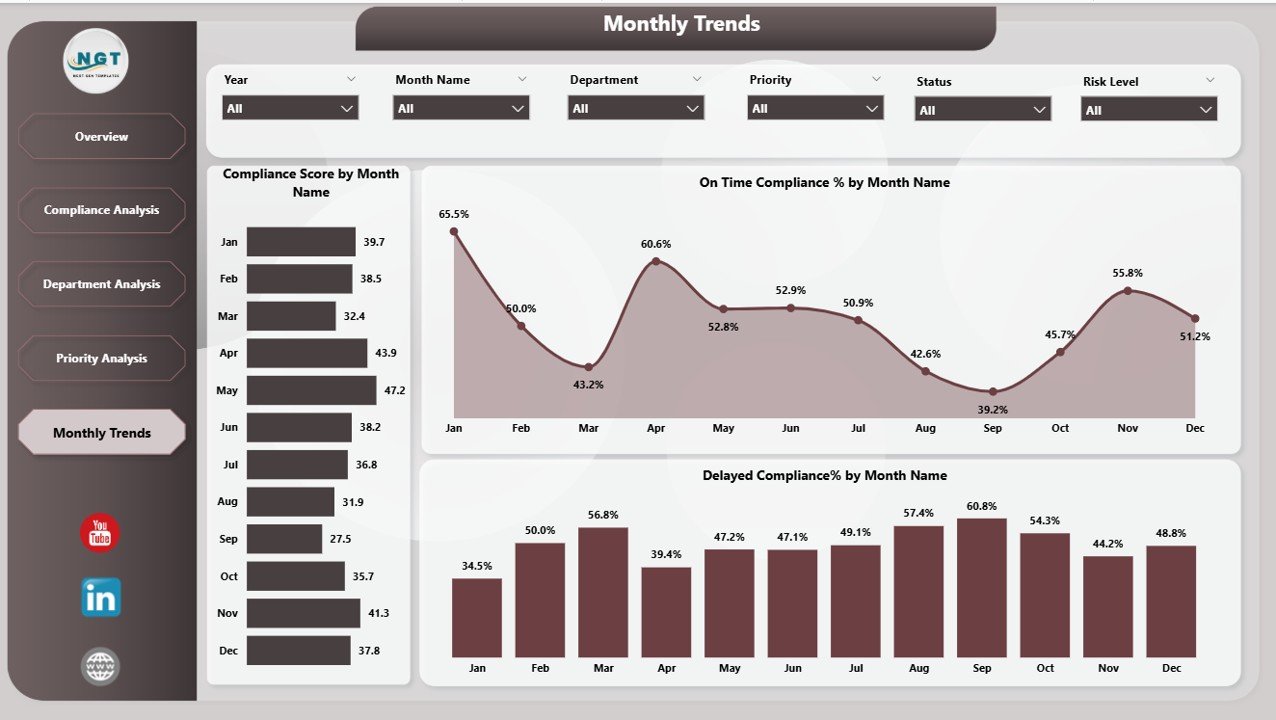
✅ Trend Analysis – Detect recurring compliance issues and seasonal performance patterns.
✅ Excel & Data Source Integration – Connect to existing compliance records for seamless updates.
📂 What’s Inside the Legal Compliance Dashboard
The dashboard is organized into five comprehensive pages:
-
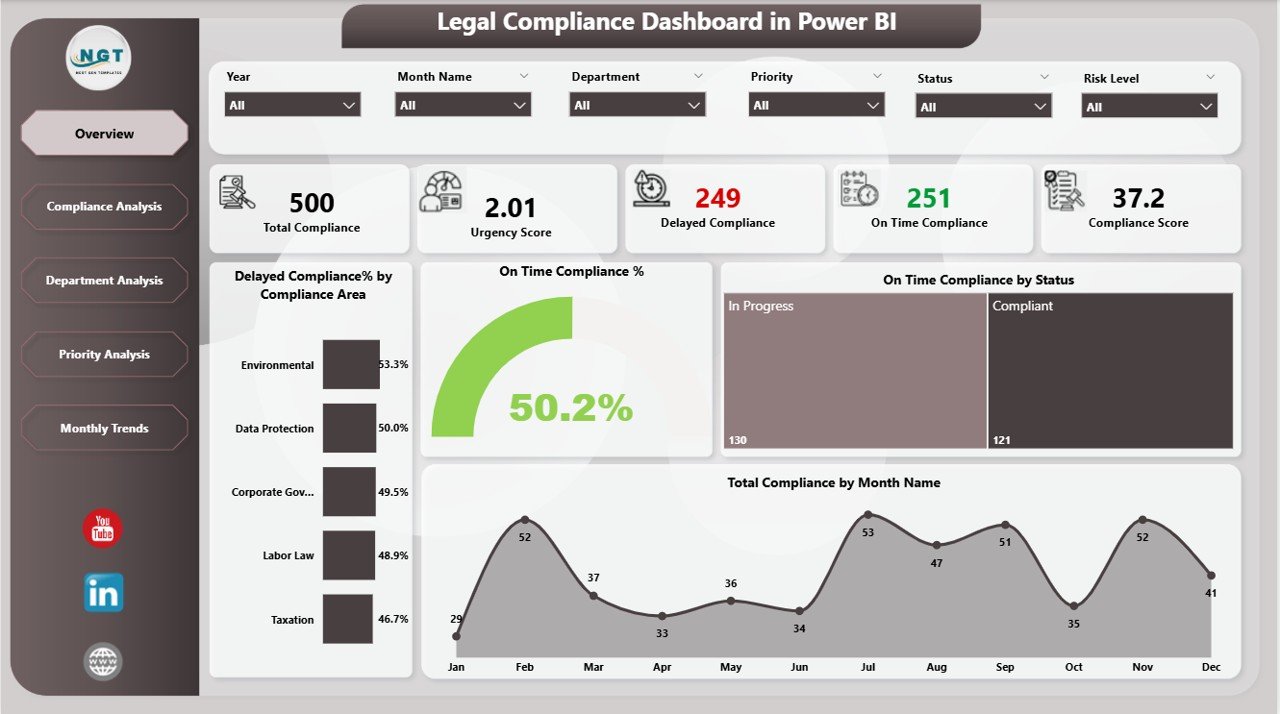
Overview Page – A high-level snapshot with summary cards and charts for delayed/on-time compliance and monthly totals.
-
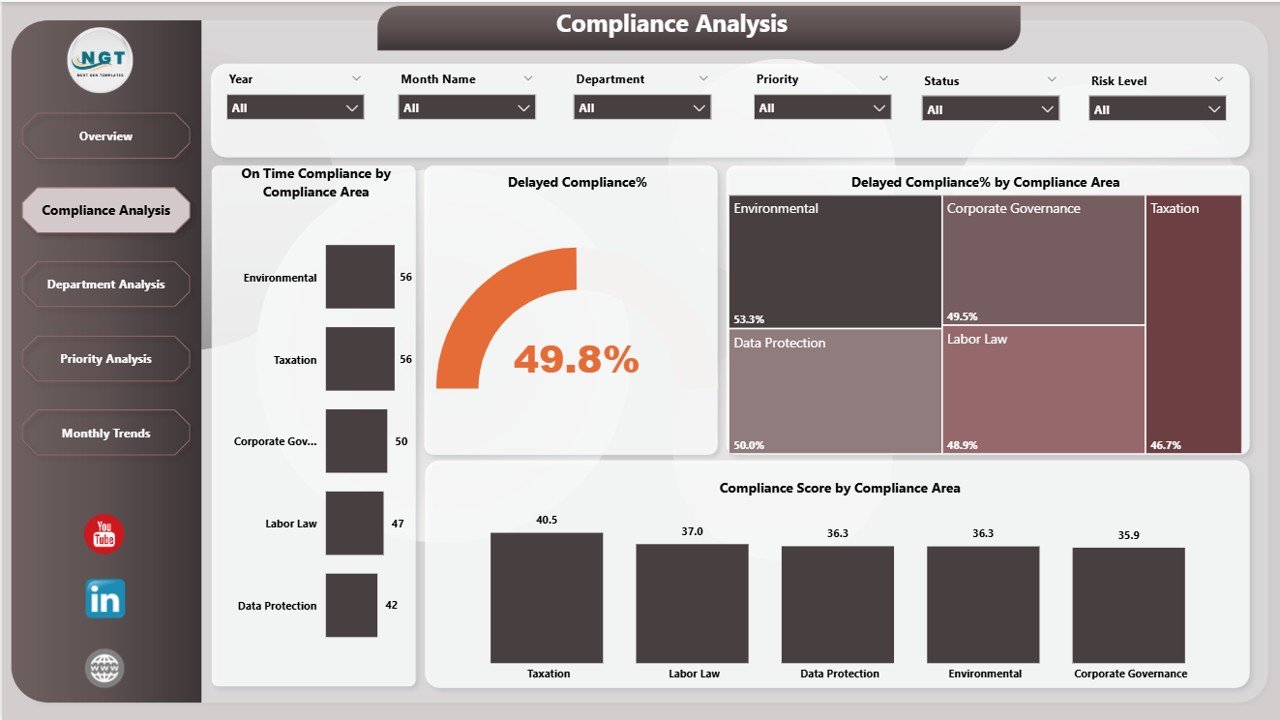
Compliance Analysis Page – Breaks down performance by compliance area to identify high-risk categories.
-
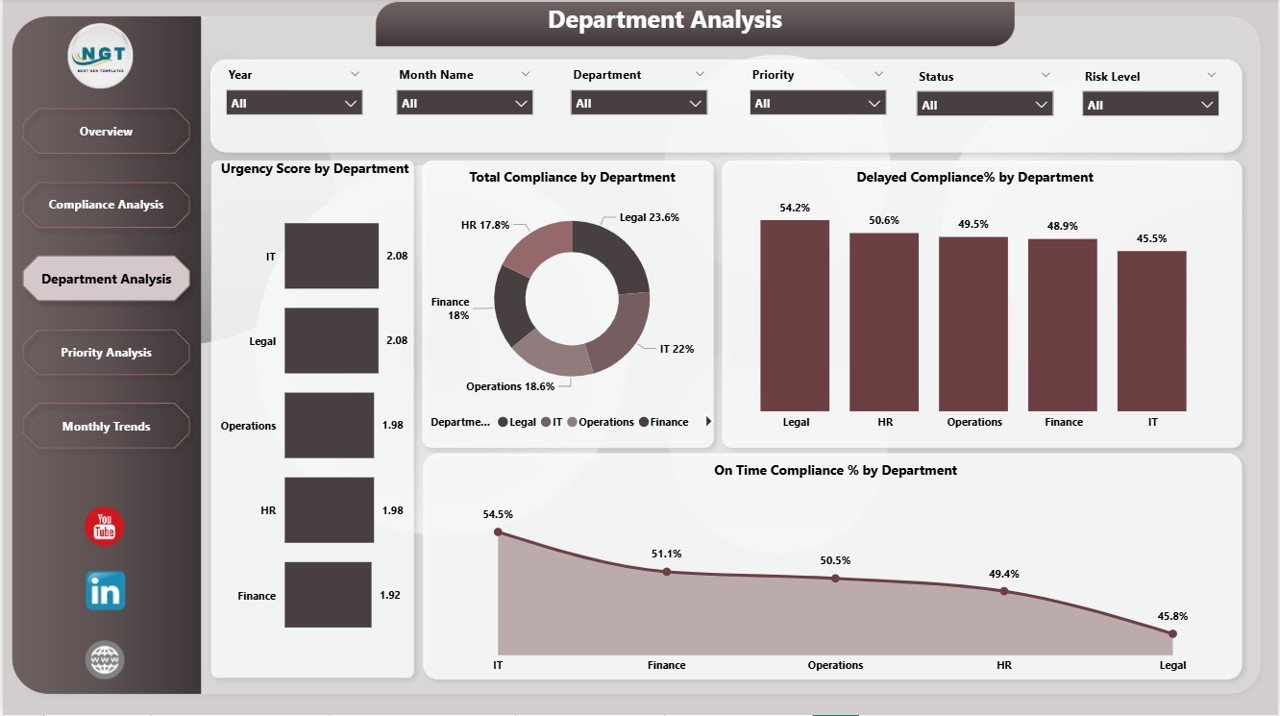
Department Analysis Page – Department-level compliance KPIs to help managers monitor and improve their teams’ performance.
-
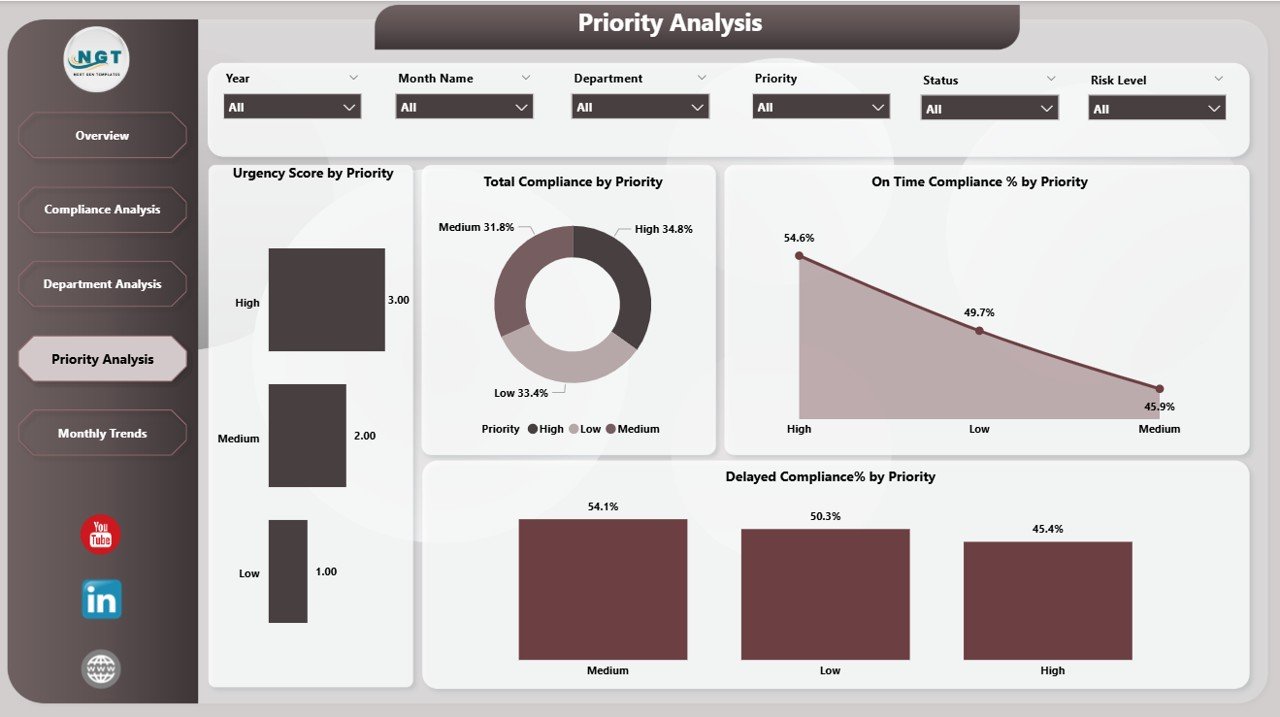
Priority Analysis Page – Shows whether high-priority compliance tasks are addressed on time.
-
Monthly Trends Page – Tracks compliance performance over time to identify patterns and forecast risks.
Each page includes six slicers for deep filtering, making it easy to zero in on specific areas, departments, or time periods.
🛠 How to Use the Legal Compliance Dashboard
-
Connect Your Data – Link Excel files or databases containing compliance records.
-
Refresh in Power BI – Load the latest data for up-to-date performance tracking.
-
Apply Filters – Use slicers to focus on specific departments, compliance areas, or priority levels.
-
Drill Down – Move from overall summaries to detailed charts for deeper analysis.
-
Monitor Trends – Review Monthly Trends to catch recurring compliance issues early.
-
Take Action – Share insights with stakeholders and implement corrective measures.
🎯 Who Can Benefit from This Dashboard
🏢 Corporate Legal Departments – Track contract renewals and regulatory filings.
🏥 Healthcare Organizations – Ensure compliance with patient safety and privacy laws.
🏦 Financial Institutions – Monitor reporting obligations and audit readiness.
🏭 Manufacturing Companies – Oversee safety, environmental, and operational compliance.
🏛 Government Agencies – Manage adherence to public policies and legal mandates.
🚀 Why This Dashboard is Essential
-
Centralized Monitoring – All compliance metrics in one place.
-
Faster Decision-Making – Real-time visibility into performance.
-
Targeted Insights – Departmental and priority-based breakdowns.
-
Proactive Risk Management – Identify and address compliance issues before deadlines are missed.
-
Regulatory Transparency – Share clear, visual reports with auditors and management.




Reviews
There are no reviews yet.