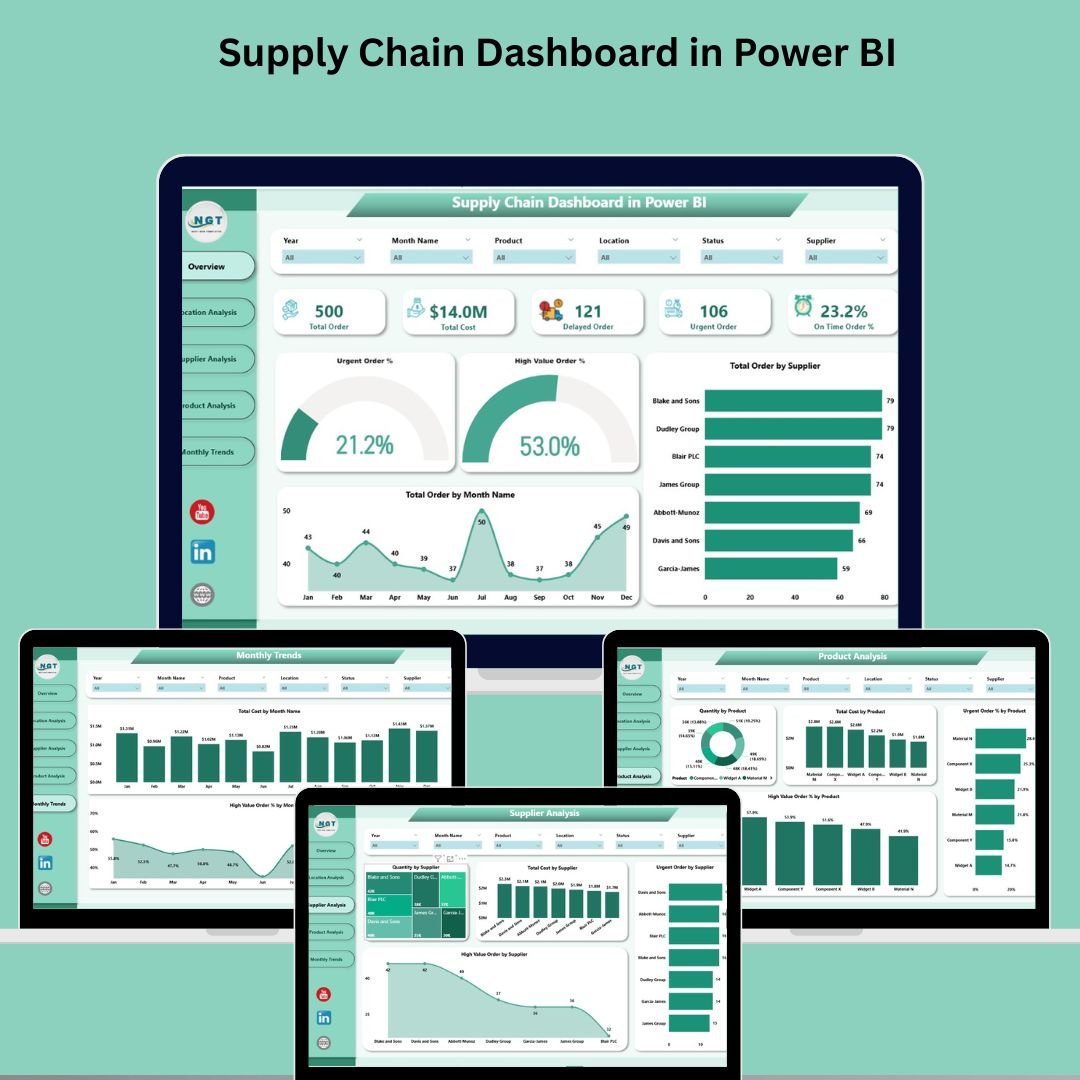
📊 5 Powerful Dashboard Pages
Navigate Supply Chain Dashboard in Power BI through Overview, Location Analysis, Supplier Analysis, Product Analysis, and Monthly Trends—each equipped with dynamic slicers and visuals.
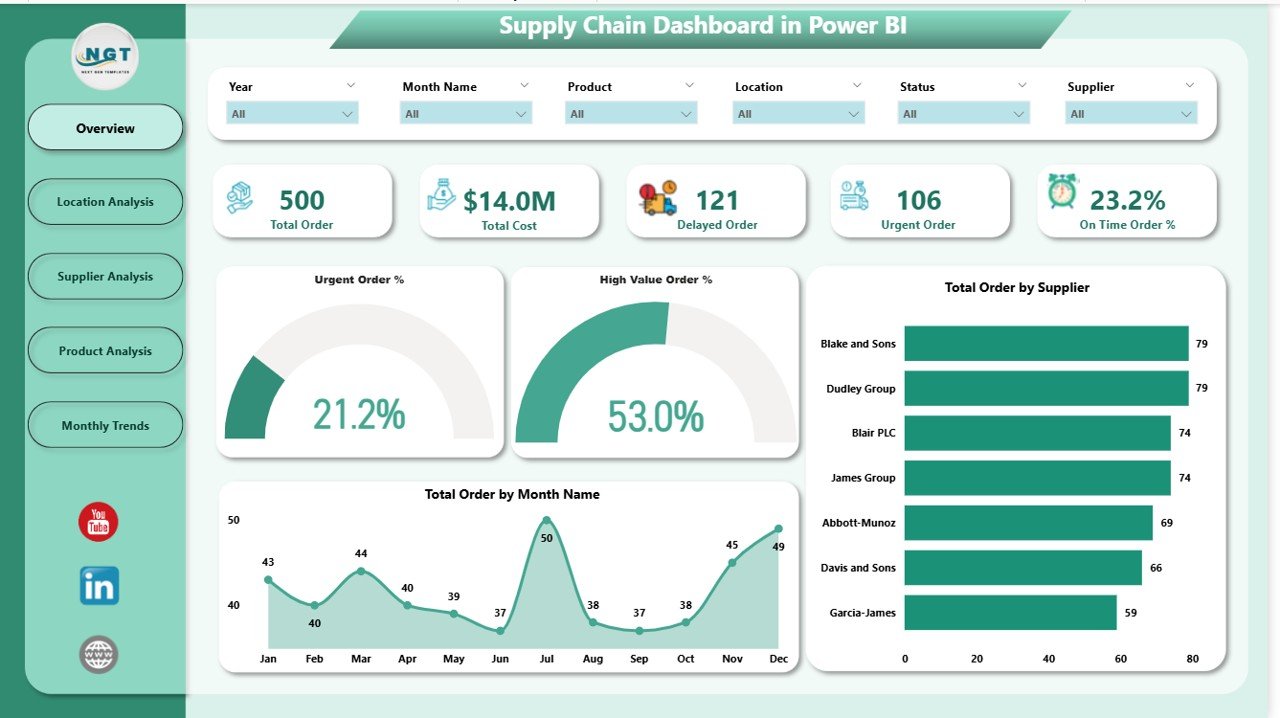
📌 Smart KPI Cards
Stay on top of critical supply chain metrics:
-
🚨 Urgent Orders (%)
-
💰 High-Value Orders (%)
-
📋 Total Orders
-
🏢 Total Suppliers
-
📦 Total Products
📈 Interactive Charts for Deep Analysis
Every page contains pivot-powered visuals:
-
Total Orders by Supplier/Month
-
Cost Distribution by Location
-
High-Value Order % by Product
-
Urgent Orders by Supplier
These allow stakeholders to drill down into the metrics that matter most.
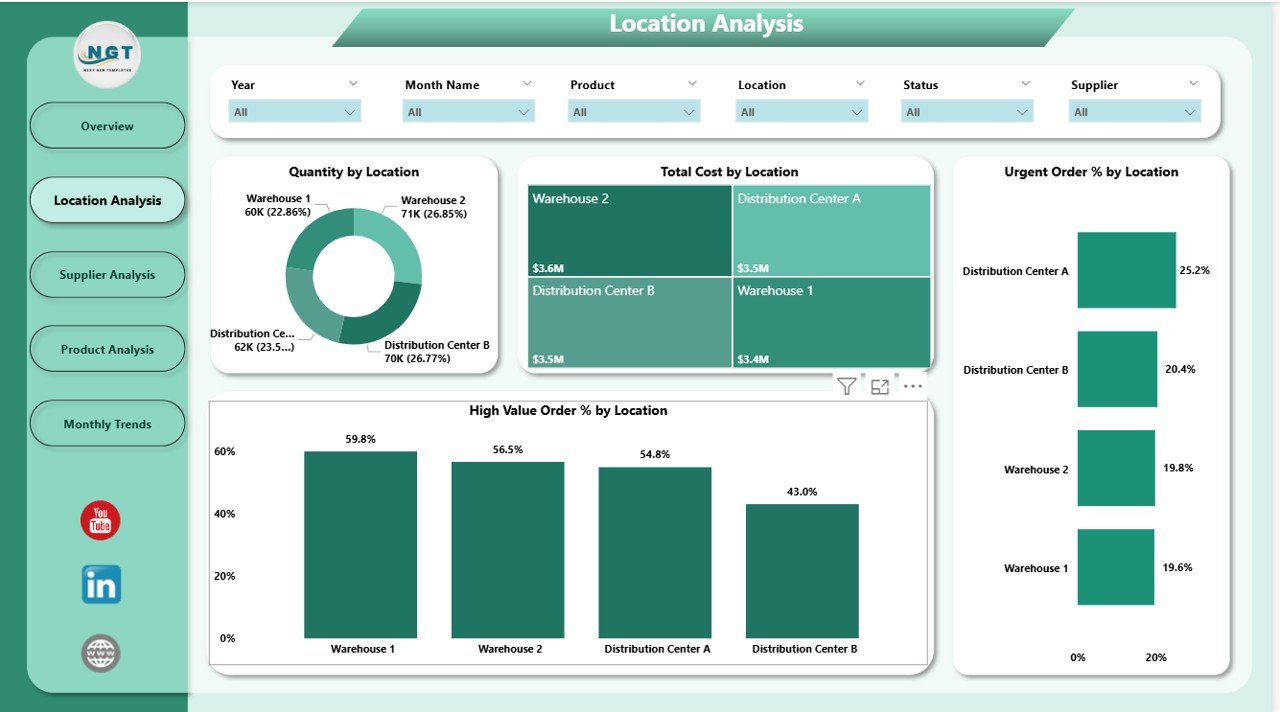
📍 Location-Wise Performance Tracking
Identify which regions or warehouses are most efficient, costly, or require attention using insightful visuals like:
-
Total Quantity & Cost by Location
-
Urgent/High-Value Order Percentages
-
Stock Movement by Region
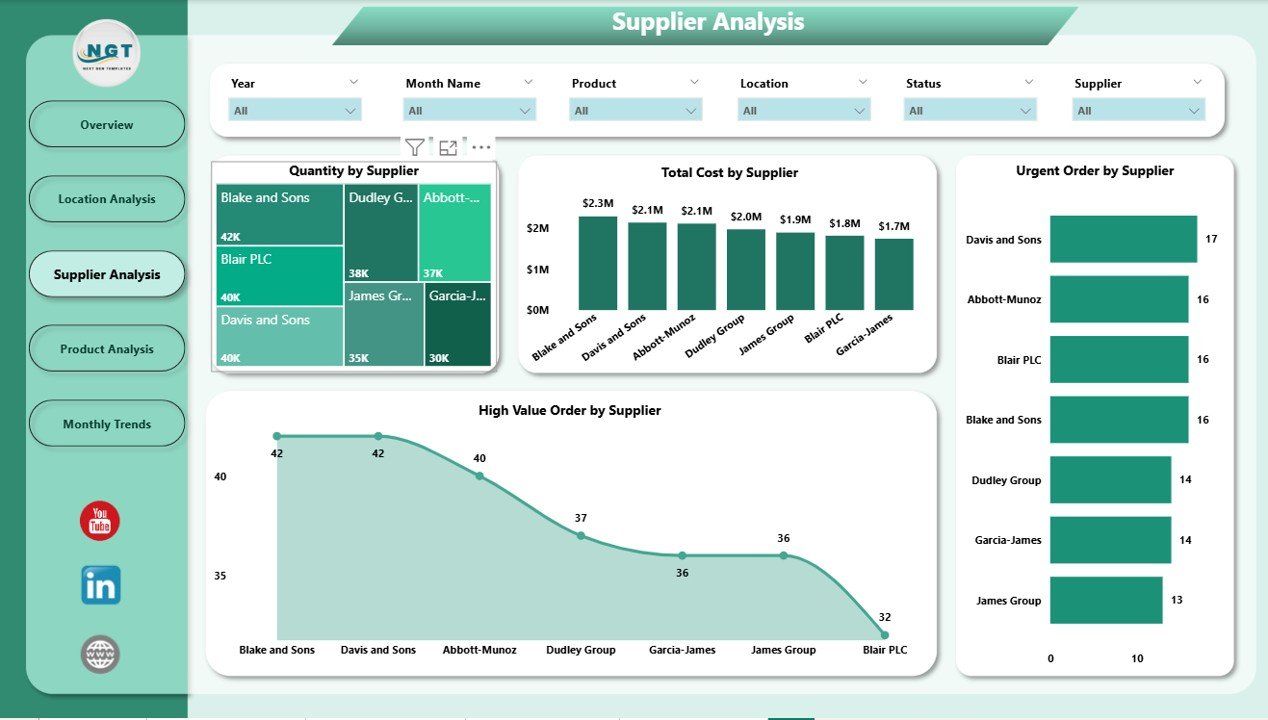
🧾 Supplier Evaluation Made Easy
Evaluate vendor performance in a click—filter by supplier to view quantity supplied, cost impact, urgency rates, and high-value orders.
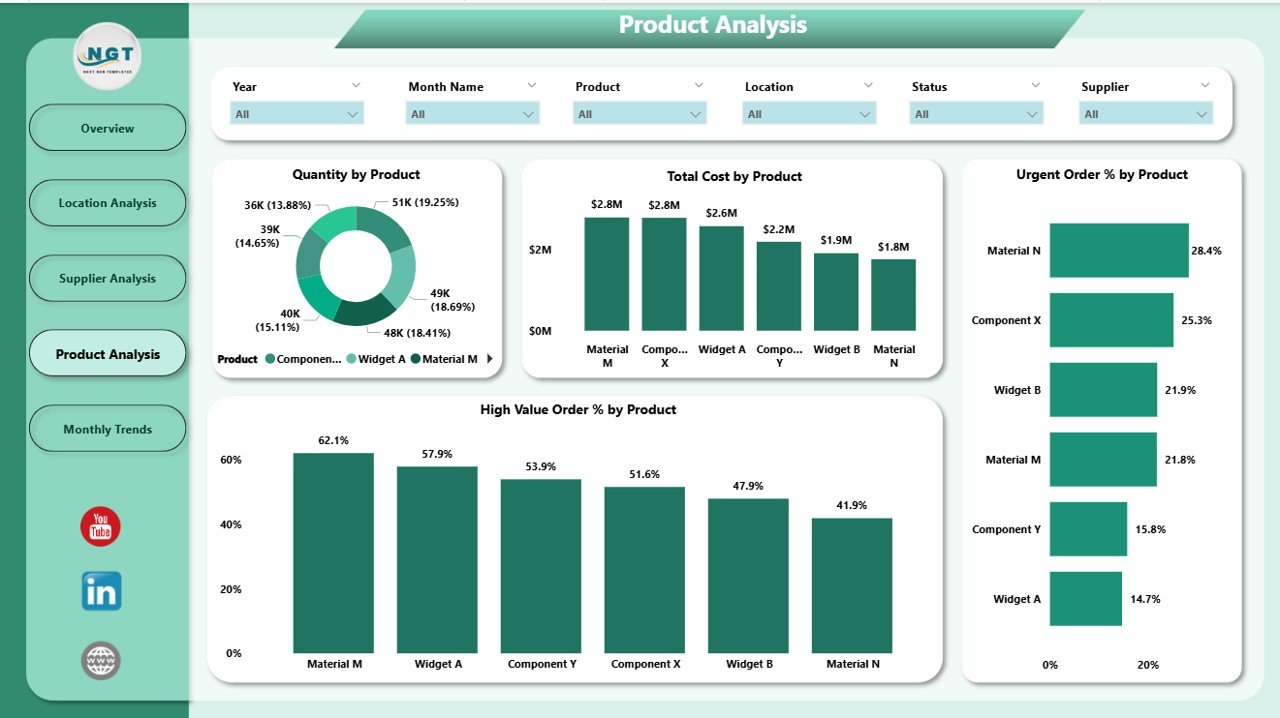
🛒 Product-Level Analytics
View SKU performance at a glance—know which products drive the most volume, urgency, or cost using:
-
Quantity by Product
-
Cost by Product
-
Urgent Order % by SKU
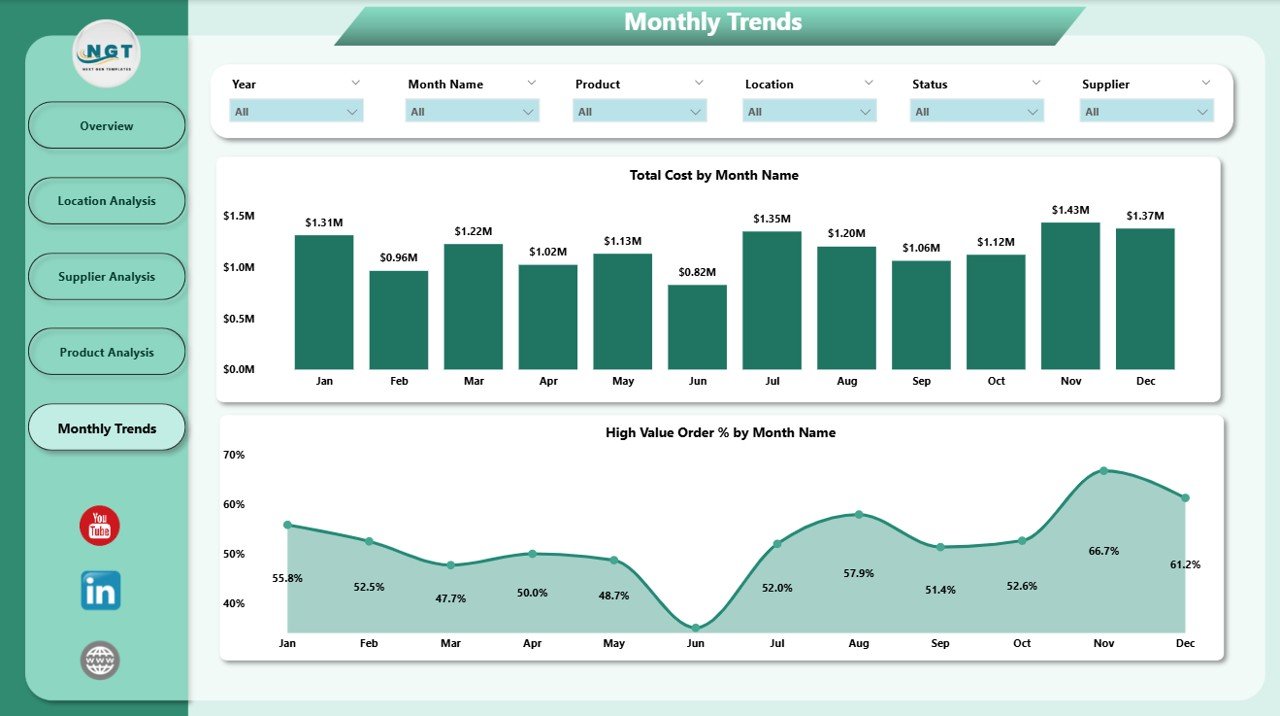
📆 Time-Based Insights
Spot patterns and seasonality in supply chain metrics across months to aid better forecasting and procurement planning.
📂 What’s Inside the Supply Chain Dashboard in Power BI
✅ Power BI (.pbix) File – Prebuilt and fully functional dashboard
✅ Excel Data Source – Sample structured file included
✅ 5 Analytical Pages:
-
Overview Page – Command center with KPIs and global filters
-
Location Analysis Page – Distribution and region-based metrics
-
Supplier Analysis Page – Vendor performance insights
-
Product Analysis Page – SKU-level breakdown
-
Monthly Trends Page – Time-based order and cost analytics
✅ Interactive Slicers – Filter by supplier, product, category, region, and month
✅ No Coding Required – 100% drag-and-drop Power BI logic
✅ Customizable – Modify visuals, KPIs, or calculations to fit your needs
✅ Mobile-Friendly Design – Works on desktop, tablets, and mobile
⚙️ How to Use the Supply Chain Dashboard in Power BI
📁 Step 1: Load the Excel Data File
Update the sample file with your real supply chain records (Date, Product, Supplier, Location, Quantity, Cost, Order Type).
🔗 Step 2: Open in Power BI Desktop
Connect the data using “Get Data,” and refresh the visuals automatically.
🧠 Step 3: Use Slicers for Targeted Views
Filter the visuals by product, month, supplier, or region to get actionable insights.
📊 Step 4: Explore Each Dashboard Page
Use page tabs or index buttons to switch between KPI dashboards for different operational angles.
📤 Step 5: Share with Your Team
Publish the dashboard to Power BI Service or export pages as PDF reports for presentations.
👥 Who Can Benefit from This Dashboard
🚚 Logistics & Warehouse Managers – Monitor order flow, urgency, and cost by location
💼 Procurement Teams – Evaluate supplier performance and cost-effectiveness
📦 Inventory & Product Teams – Track SKU demand and urgent order hotspots
📊 Executives & CFOs – Review cost trends and supplier relationships in real time
🛍️ Retail, Manufacturing & E-commerce – All industries needing inventory and supplier visibility
Whether you’re running a factory or managing multiple vendors across cities, this tool simplifies supply chain monitoring like never before.
🔗 Click here to read the Detailed blog post
🎥 Visit our YouTube channel to learn step-by-step video tutorials
Watch the step-by-step video tutorial:


Reviews
There are no reviews yet.