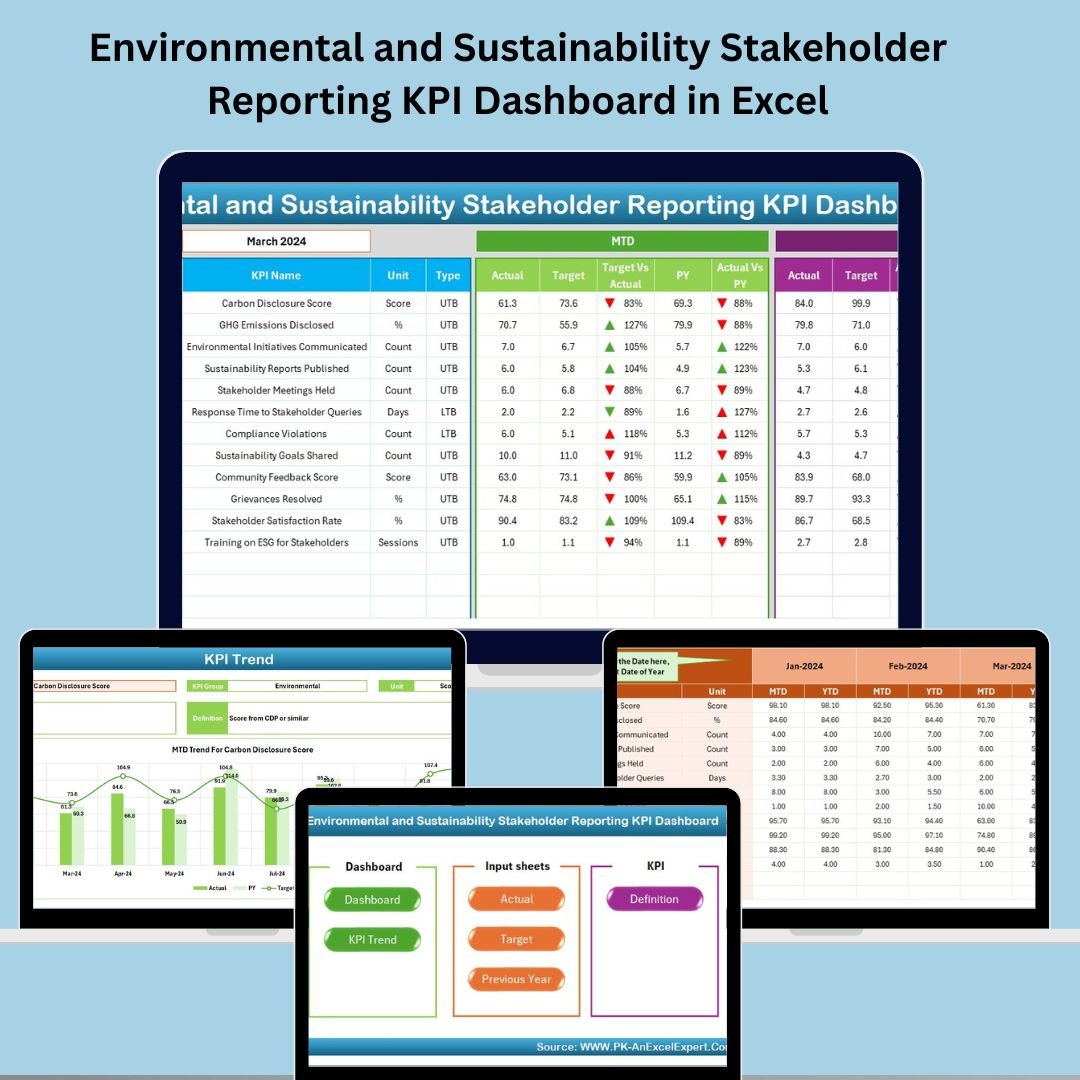
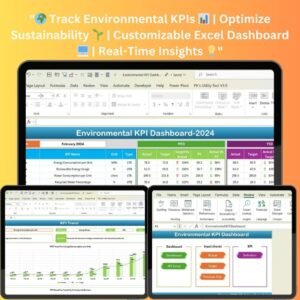
In an era where sustainability reporting is not just expected but essential, organizations must go beyond basic spreadsheets to communicate environmental performance. Introducing the Environmental and Sustainability Stakeholder Reporting KPI Dashboard in Excel—your all-in-one solution to track, analyze, and present your environmental and sustainability KPIs with transparency, precision, and impact. 📊🌱
Whether you’re reporting to regulators, investors, customers, or internal teams, this Excel-based dashboard is designed to simplify stakeholder reporting, improve ESG alignment, and ensure consistent, data-driven communication—all without requiring any coding or external software.
💡 Key Features of Environmental and Sustainability Stakeholder Reporting KPI Dashboard in Excel
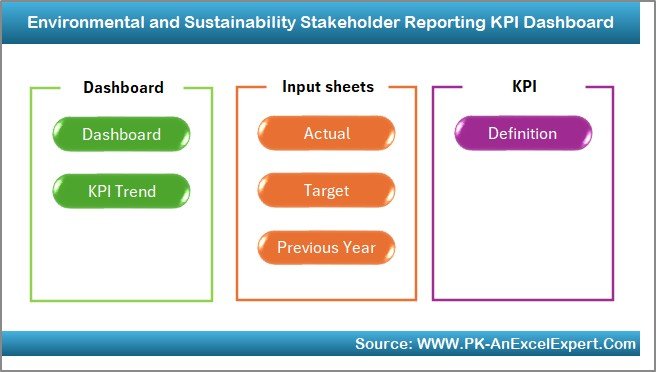
🗂️ 7 Powerful Worksheet Tabs
Includes Home, Dashboard, KPI Trend, Actual Input, Target, Previous Year, and KPI Definition sheets—each built with a specific purpose to streamline your sustainability tracking.
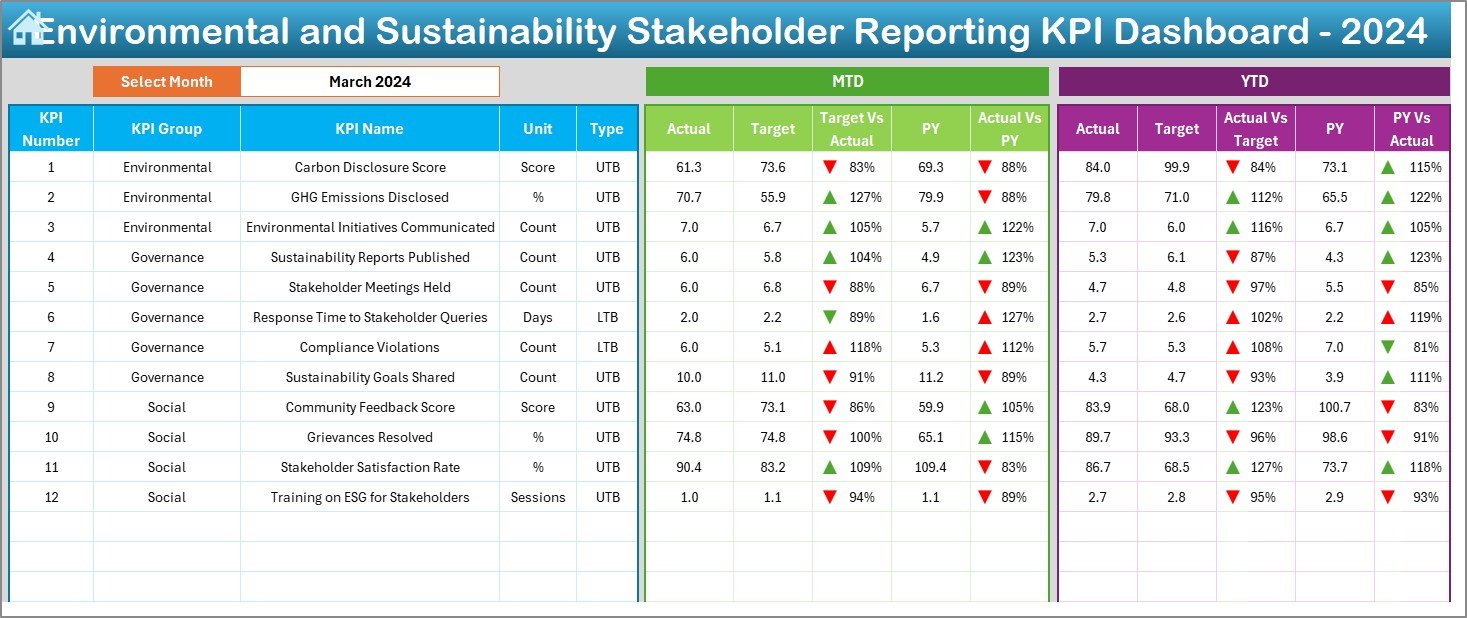
📊 Dynamic Dashboard with MTD/YTD Insights
Easily select any month to view updated Month-to-Date and Year-to-Date data. Conditional formatting with arrows provides instant performance signals against targets and previous year values.
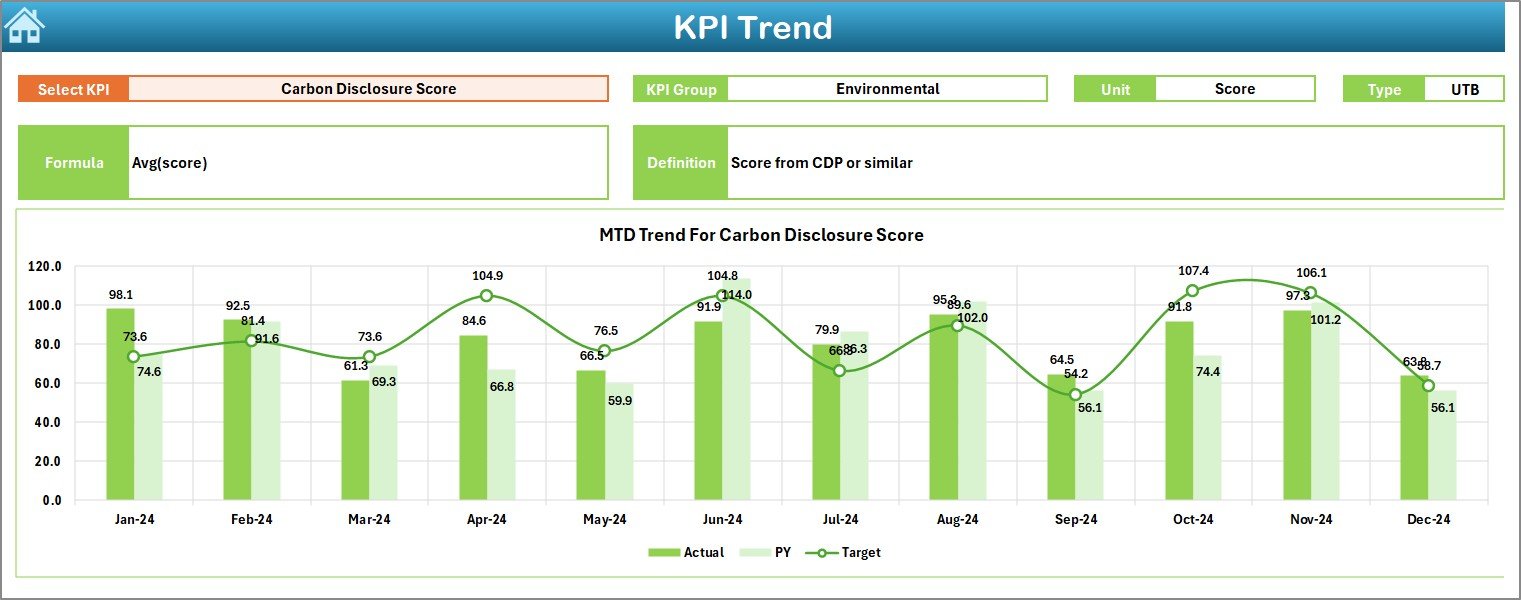
📈 KPI Trend Charts
Visualize your sustainability journey with historical charts that compare actual, target, and previous year data—both for MTD and YTD.
📘 KPI Glossary for Consistency
Use the KPI Definition sheet to define your metrics clearly—ensuring everyone across your organization interprets your KPIs the same way.
📝 Excel-Based Data Entry
Input monthly performance data into structured sheets. Control your fiscal year from one setting (cell E1), and the entire dashboard updates accordingly.
🧭 Easy Navigation
Jump to any section from the Home sheet with just one click. Built-in buttons make moving between sheets smooth and intuitive.
📦 What’s Inside the Environmental Stakeholder KPI Dashboard?
🏠 Home Sheet
Central navigation panel with buttons to all sheets. Add your branding or notes for quick reference.
📊 Dashboard Sheet
Real-time performance summary with:
-
MTD and YTD Actuals, Targets, and Previous Year data
-
Target vs Actual % and YoY comparisons
-
Up/down arrows to visually represent success or concern areas
📈 KPI Trend Sheet
Choose any KPI from a dropdown and view line or combo charts comparing current year, last year, and targets.
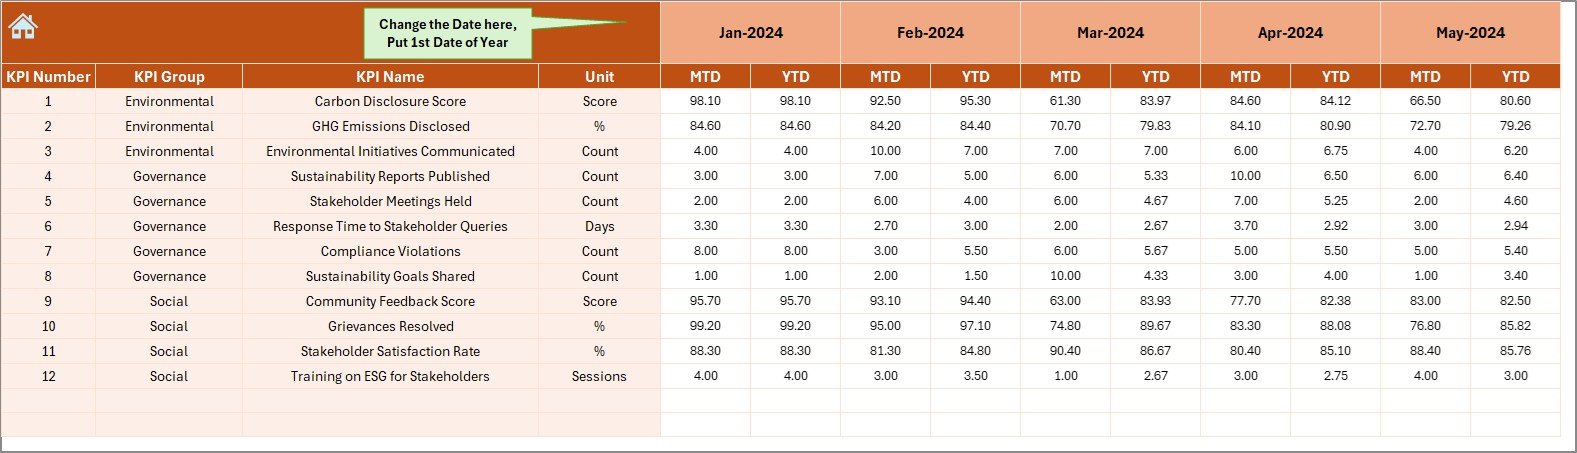
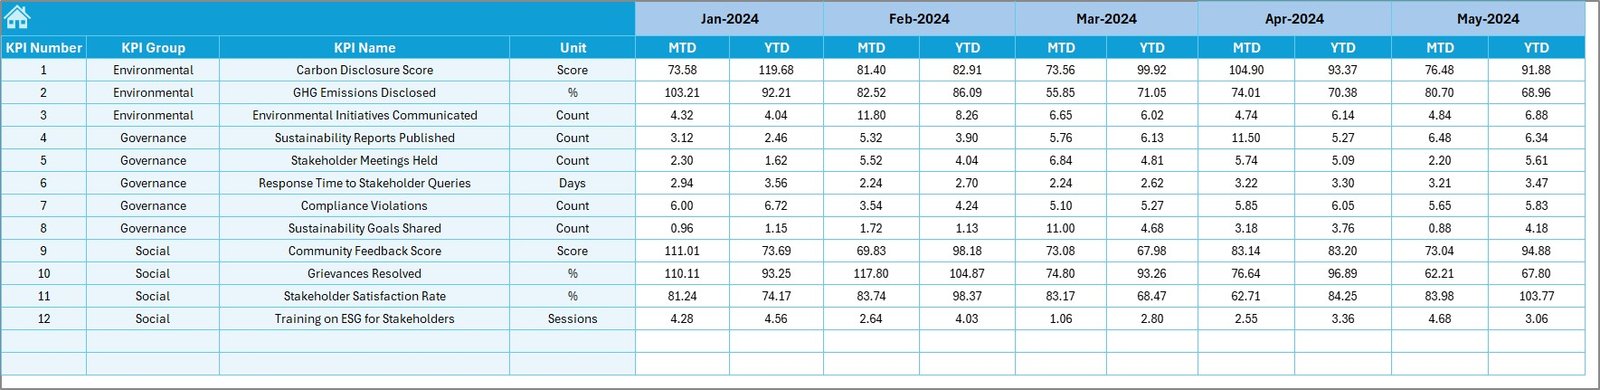
🧾 Actual Numbers Input
Monthly data entry sheet where you feed MTD and YTD values per KPI.
🎯 Target Sheet
Set MTD and YTD targets for each KPI by month—ensures goal alignment across your sustainability roadmap.
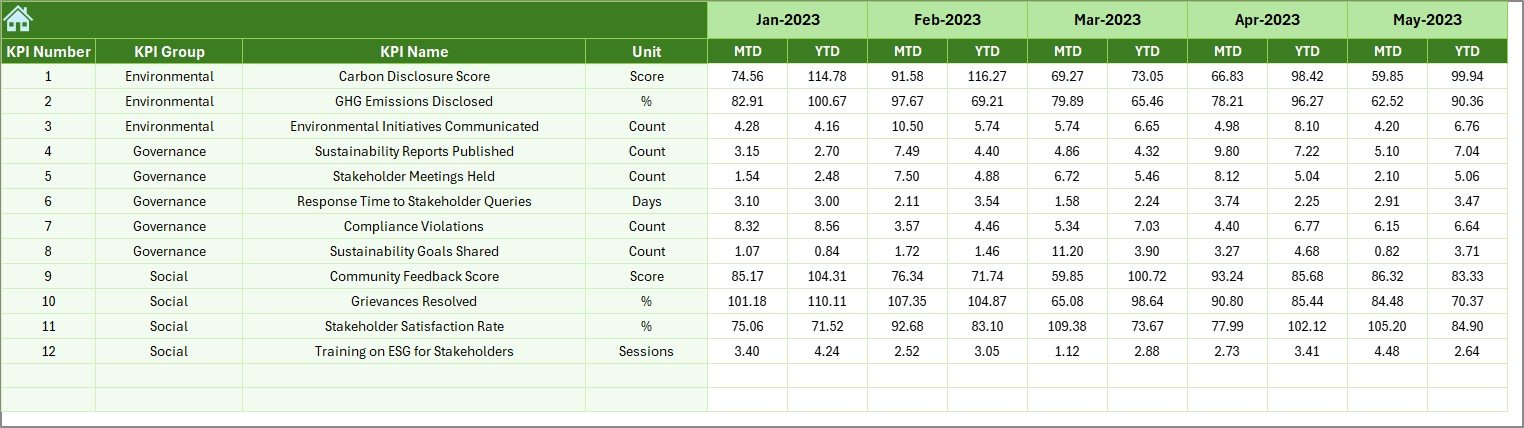
📆 Previous Year Sheet
Track historical numbers for YoY comparisons and performance benchmarking.
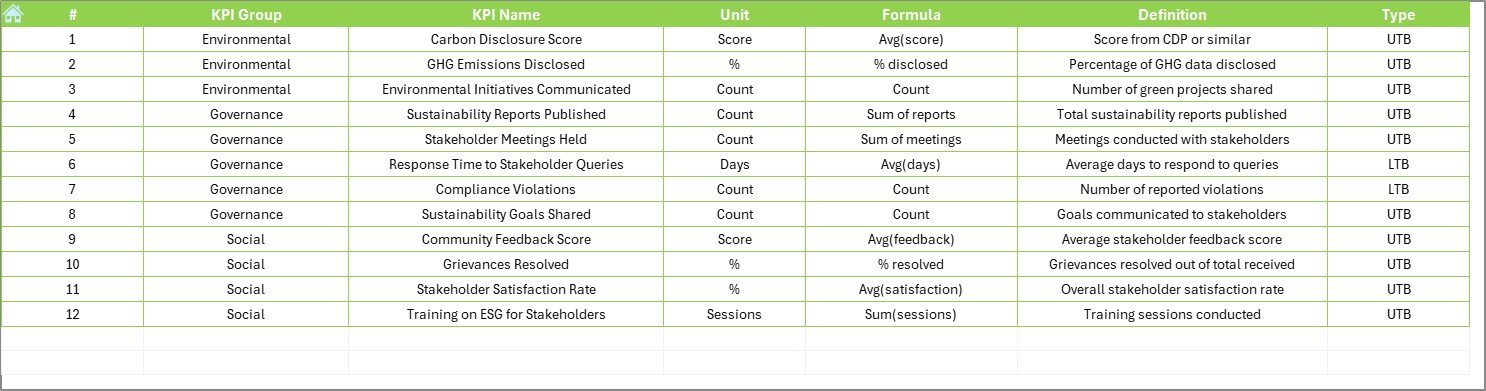
📘 KPI Definition Sheet
Define KPI Name, Group, Unit, Formula, Type (LTB/UTB), and short description. Build transparency and standardization.
🛠️ How to Use the Stakeholder Reporting KPI Dashboard
-
Set KPI Definitions – Start by filling out the KPI Definition Sheet to standardize your metrics.
-
Enter Historical & Target Data – Use the Previous Year and Target sheets to set the foundation for comparisons.
-
Input Monthly Actuals – Feed new MTD/YTD values into the Actual Input sheet each month.
-
Monitor & Present – Select the reporting month on the Dashboard and share the auto-updated results.
-
Analyze Trends – Use the KPI Trend Sheet for deeper analysis on individual metric movement over time.
The dashboard is plug-and-play. No need for formulas or complex setups—just enter your data and review the output!
👥 Who Can Benefit from This Dashboard?
🏭 Sustainability & ESG Teams – Track and report environmental progress
📈 Analysts & Data Managers – Monitor trends, targets, and past performance
💼 Executives & Boards – Get real-time insights for strategic decisions
🏢 Compliance Managers – Align with ISO 14001, GRI, SDGs, ESG standards
🛒 Retail & Manufacturing – Report on waste, emissions, and sourcing
🏥 Healthcare & Education – Track campus or facility-level sustainability metrics
Built to support all sectors and scalable for small teams or enterprise use.
🔗 Click here to read the Detailed blog post
📺 Visit our YouTube channel to learn step-by-step video tutorials


Reviews
There are no reviews yet.