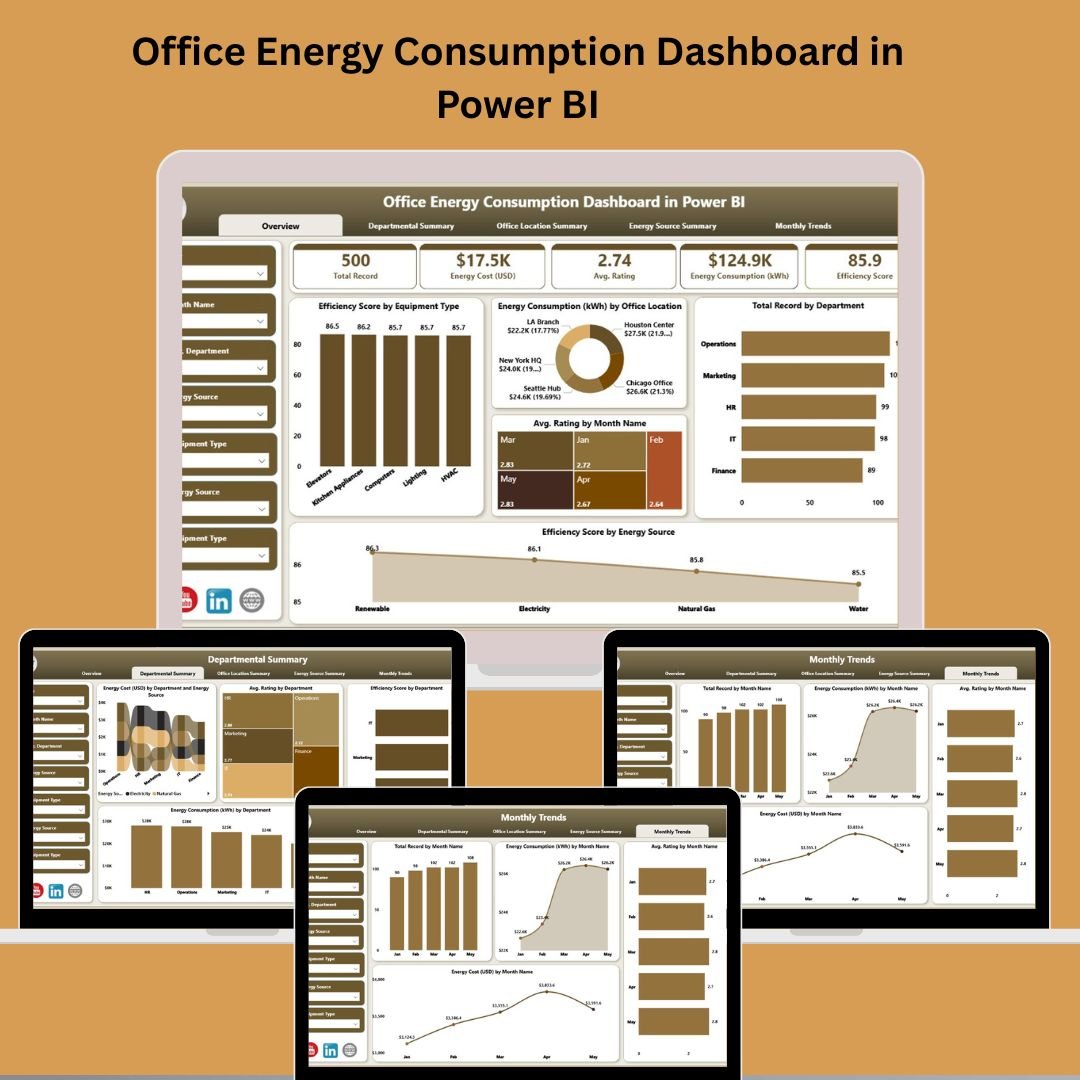
The Office Energy Consumption Dashboard in Power BI is your go-to solution for visualizing and managing energy usage across departments, locations, and sources. With increasing attention on operational efficiency and green initiatives, this dashboard empowers facility managers, sustainability officers, and data analysts with actionable insights into office energy patterns.
🔍 Key Features of Office Energy Consumption Dashboard
📊 Real-Time Energy Insights
The dashboard is fully interactive, pulling live data from Excel, allowing you to filter and view energy performance by department, source, or location.
🌍 5 Insightful Pages
Get detailed breakdowns on:
- ✨ Overview
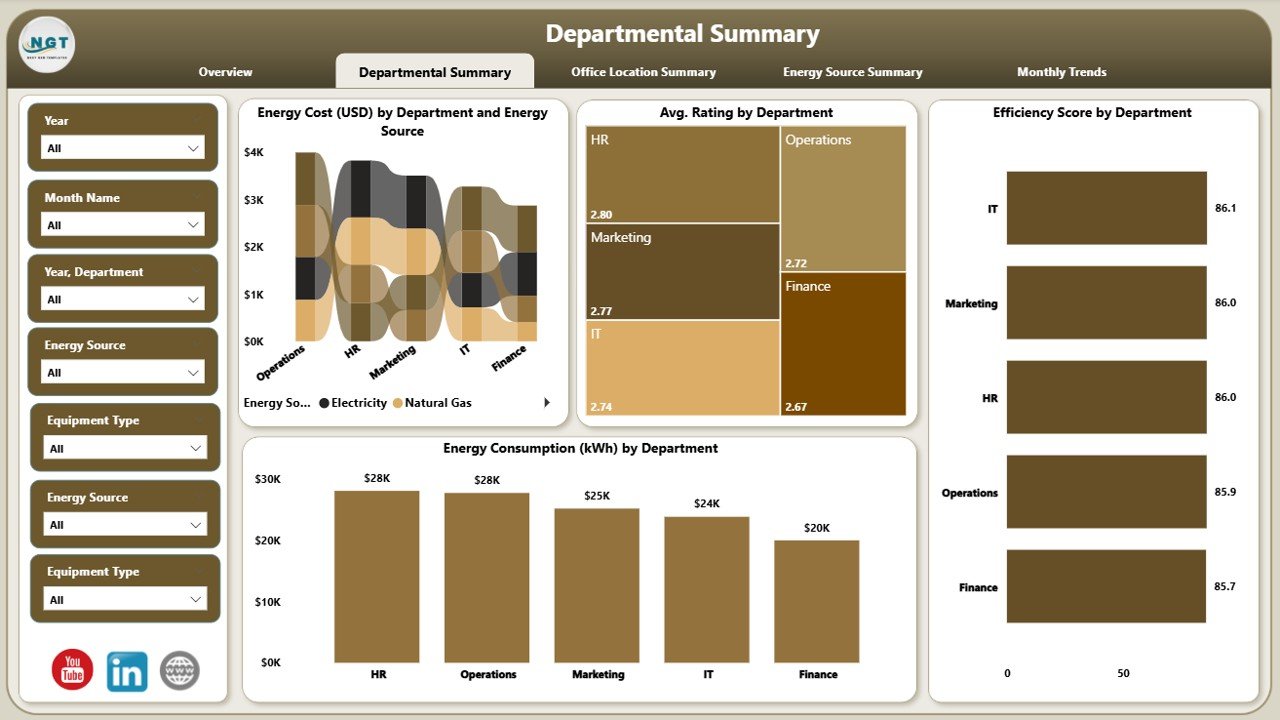
- 💼 Departmental Summary
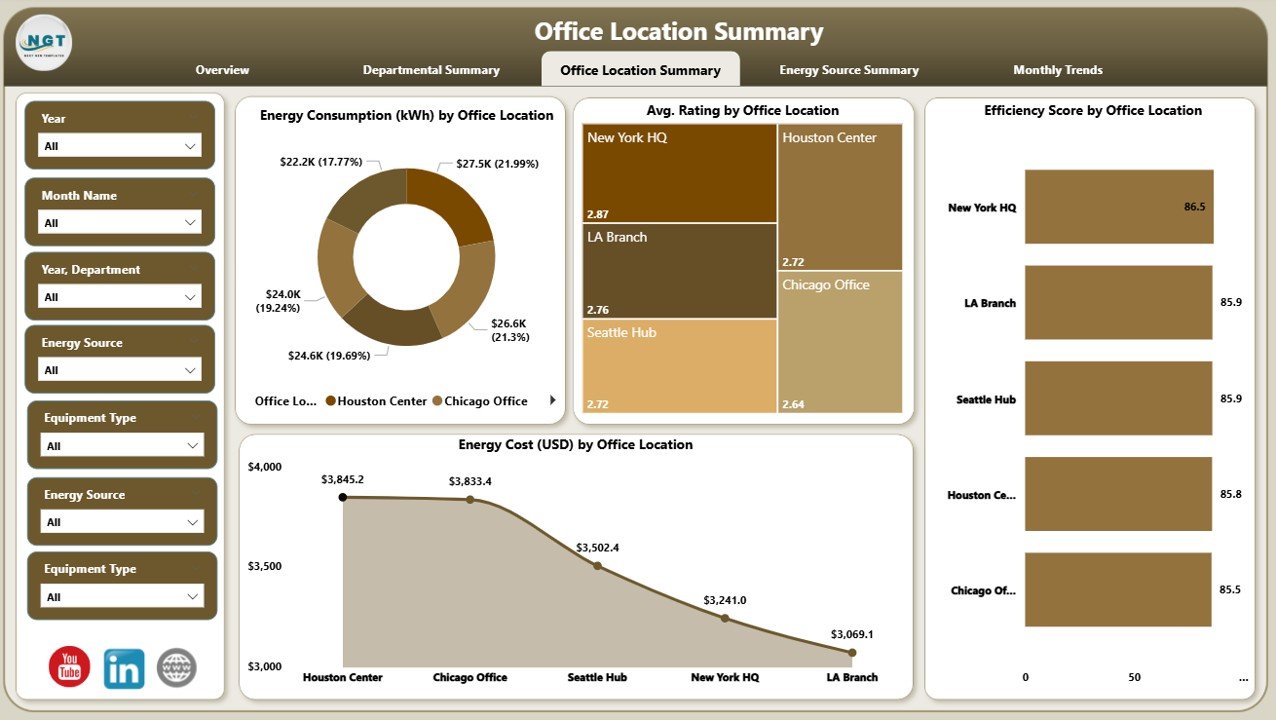
- 🚪 Office Location Summary
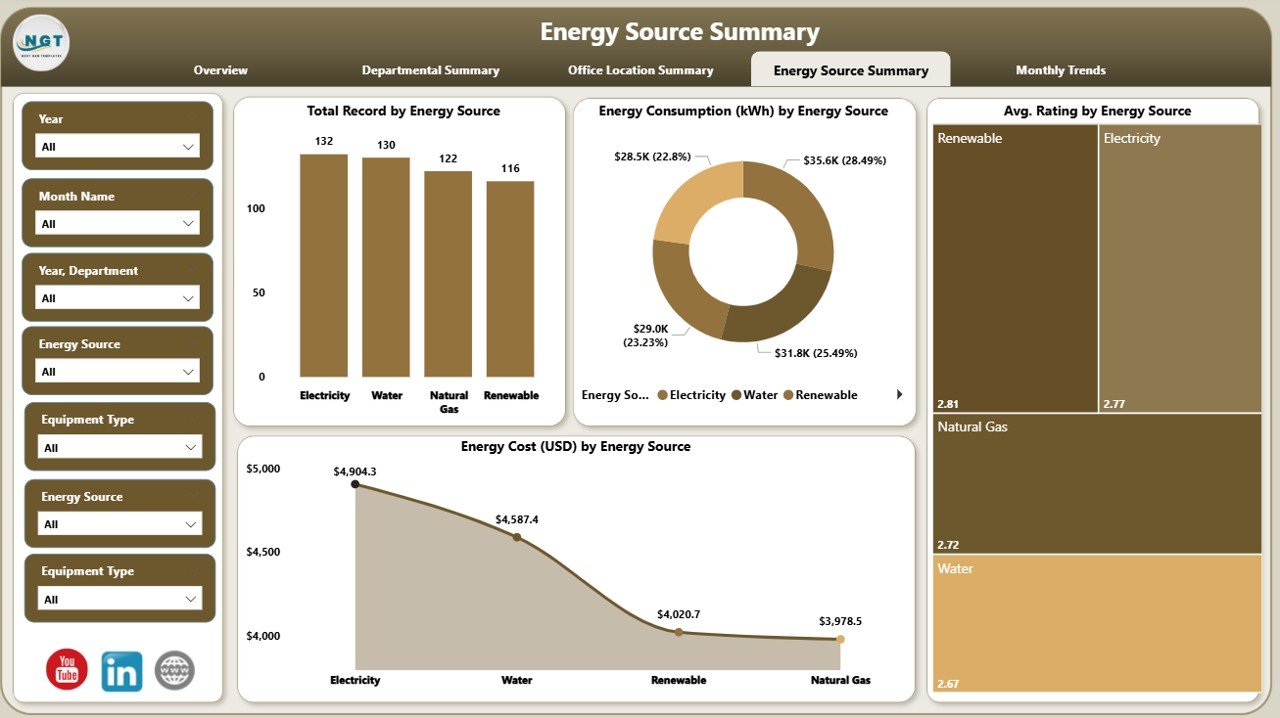
- ⚡ Energy Source Summary
- 📅 Monthly Trends
🔍 Filter with Ease
Every page comes with 7 slicers to let you customize the view. Whether you’re comparing energy cost, efficiency scores, or usage patterns—you get it all at your fingertips.
📈 Visual KPIs
Use visually rich cards and charts to track:
- Energy Consumption (kWh)
- Energy Cost (USD)
- Average Ratings
- Efficiency Scores
📂 What’s Inside the Office Energy Dashboard
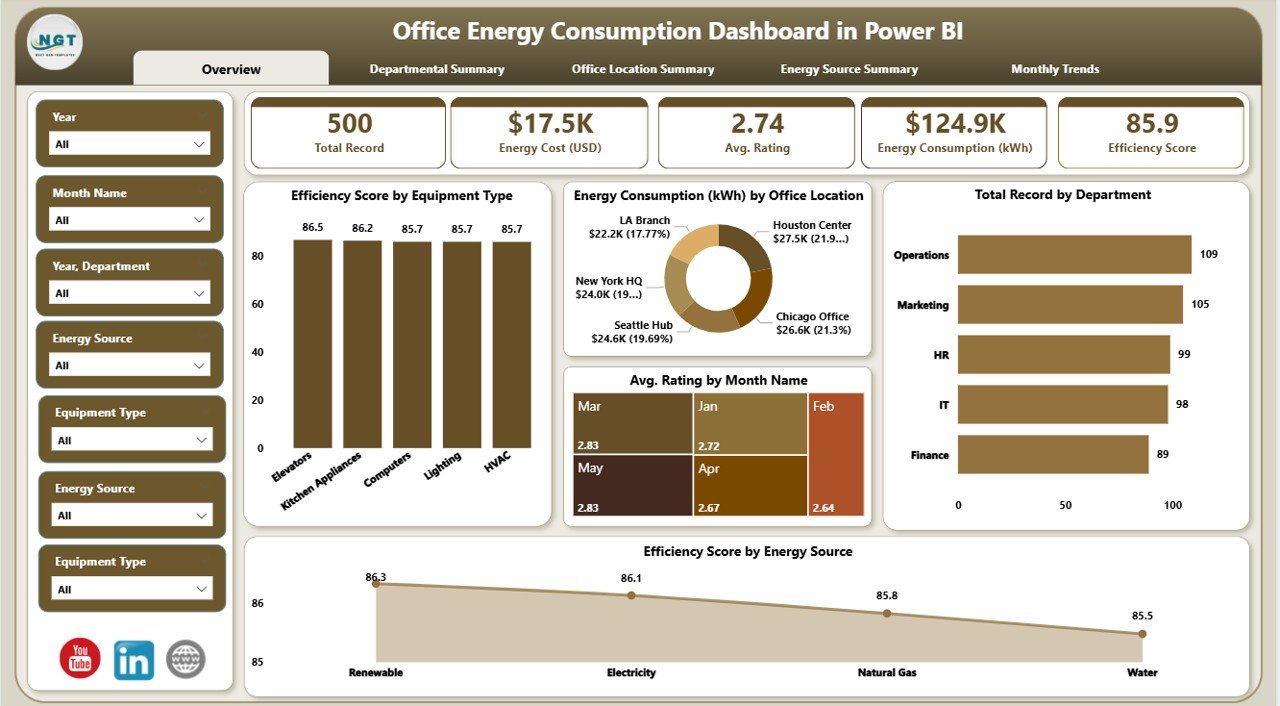
📅 Overview Page
- View energy usage metrics with 5 key performance cards
- Filter by location, department, month, and more
💼 Departmental Summary
- Charts show cost, consumption, source, and rating by department
- Efficiency score ranks departmental performance
🚪 Office Location Summary
- Analyze which office sites are most and least efficient
- Target areas for energy-saving initiatives
⚡ Energy Source Summary
- Visualize how different energy sources are utilized
- Identify high-cost or inefficient energy types
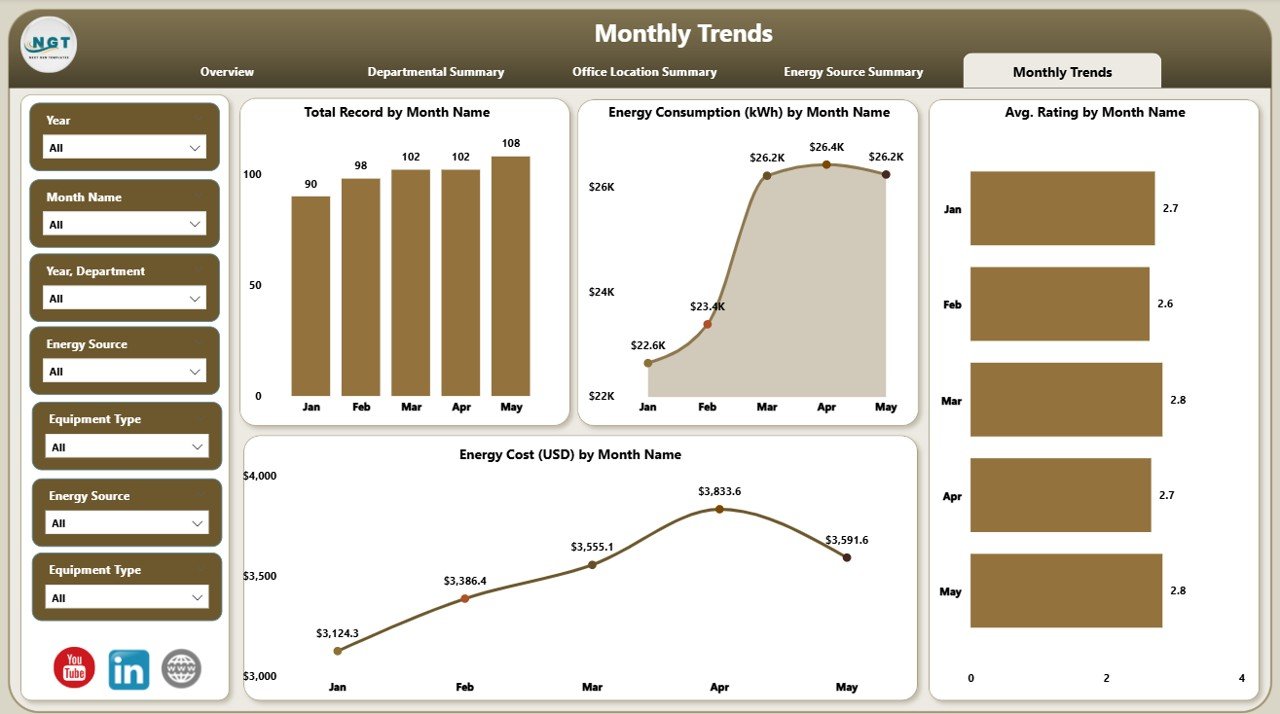
📊 Monthly Trends
- Monitor energy consumption and cost trends over time
- Plan monthly or seasonal savings initiatives
📖 How to Use the Product
- 🔹 Connect your Excel energy data
- 🔹 Open the Power BI dashboard
- 🔹 Use slicers to explore data by month, department, location
- 🔹 Interpret visuals and take action
- 🔹 Share insights with your leadership team
No complex setup. Just plug, play, and optimize.
💼 Who Can Benefit from This Product?
- 💳 Facility Managers: Track costs and control budgets
- 🌿 Sustainability Teams: Measure carbon footprint
- 🧱 Operations Heads: Pinpoint inefficiencies
- 🤖 IT Departments: Monitor energy use in server rooms
- 📈 Data Analysts: Extract performance trends
Whether you’re a small business or a large enterprise, if energy matters to you, this dashboard delivers.


Reviews
There are no reviews yet.