In today’s hybrid work culture, wasted space equals wasted money. Whether you’re managing one office or multiple locations, understanding how your space is used is essential for cost savings, productivity, and employee satisfaction. Our Office Space Utilization Dashboard in Power BI helps you do just that—by turning raw Excel data into dynamic, visual insights! 💼📉
Say goodbye to guesswork and hello to smarter decisions with this ready-to-use Power BI dashboard designed for real estate teams, facility managers, and workplace strategists.
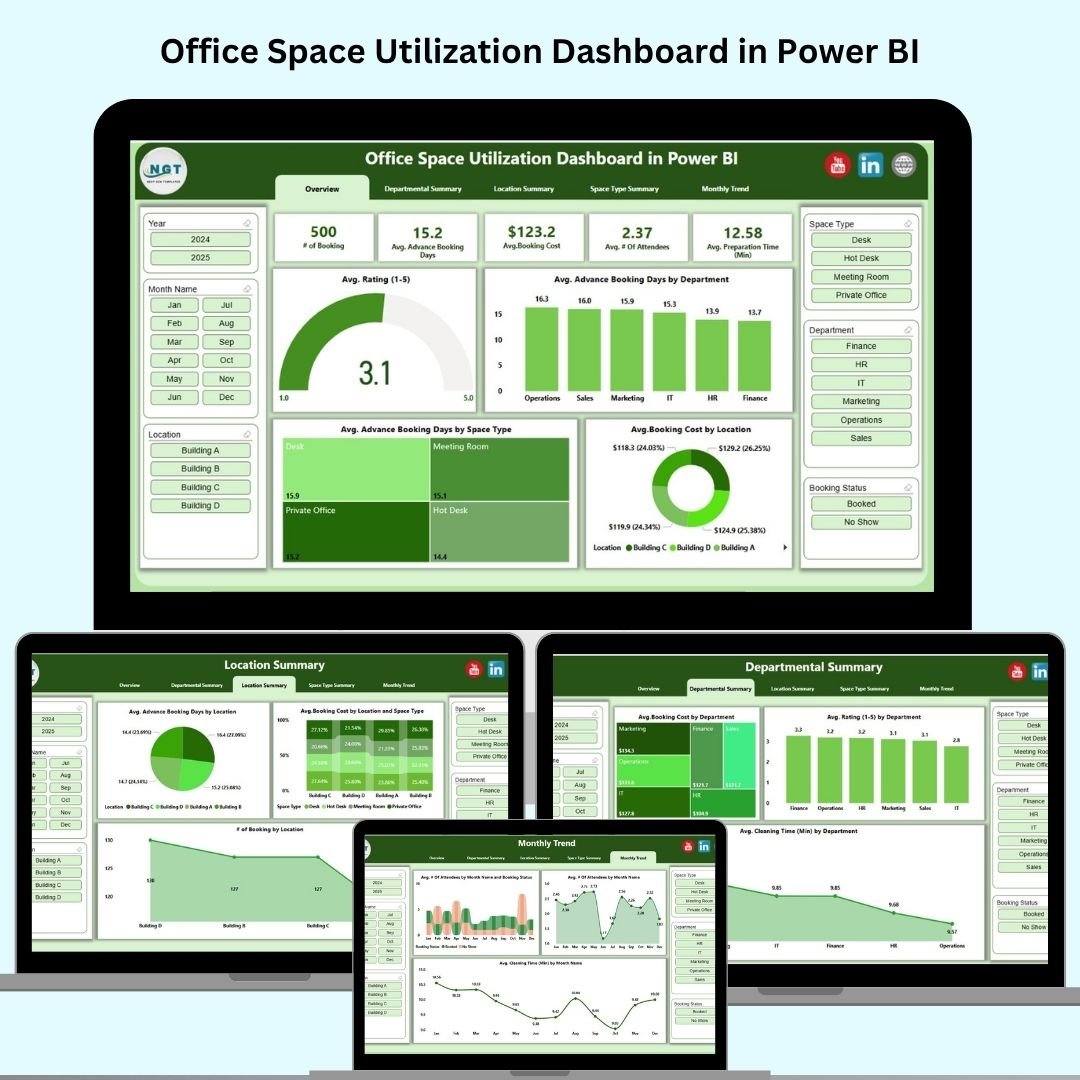
🔧 Key Features of Office Space Utilization Dashboard
🎯 KPI Cards for Instant Metrics
Monitor the most critical insights at a glance:
-
Total Bookings
-
Average Ratings
-
Average Cleaning Time
-
Booking Costs
-
Advance Booking Days
🧩 5 Interactive Pages for Deep-Dive Analysis
Navigate through a multi-page layout that delivers powerful perspectives:
-
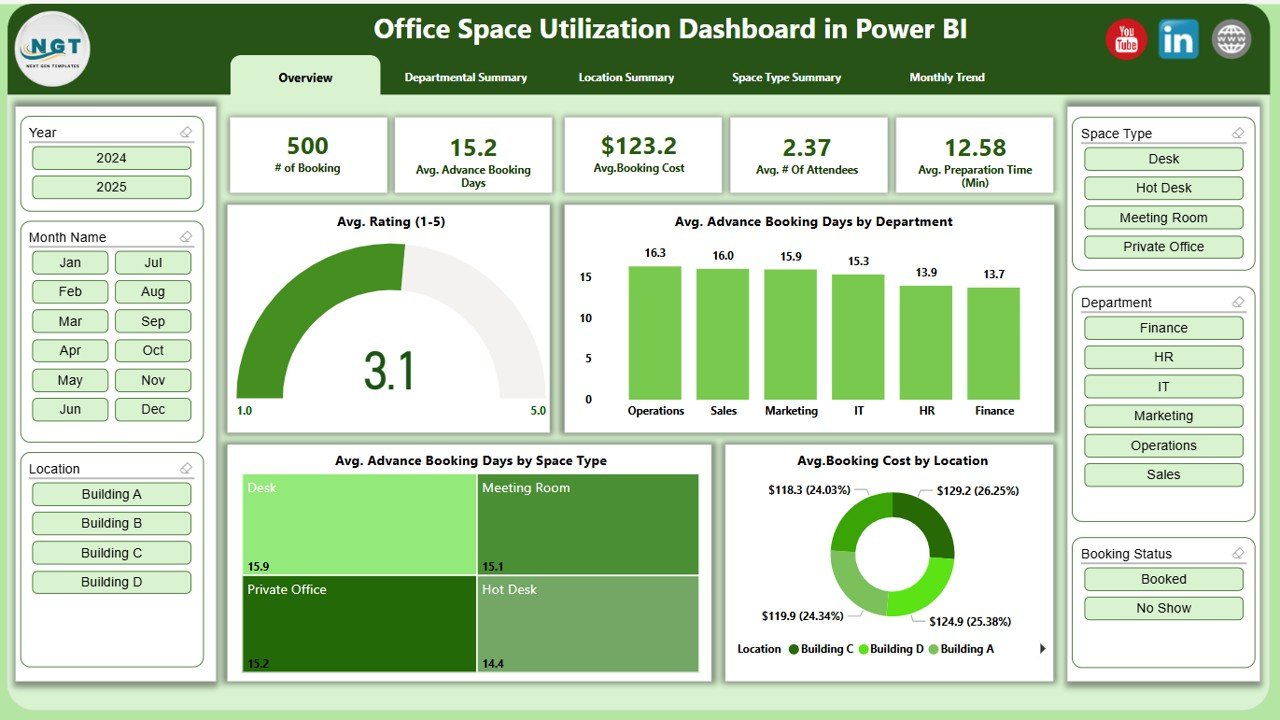
Overview Page: High-level metrics and trends
-
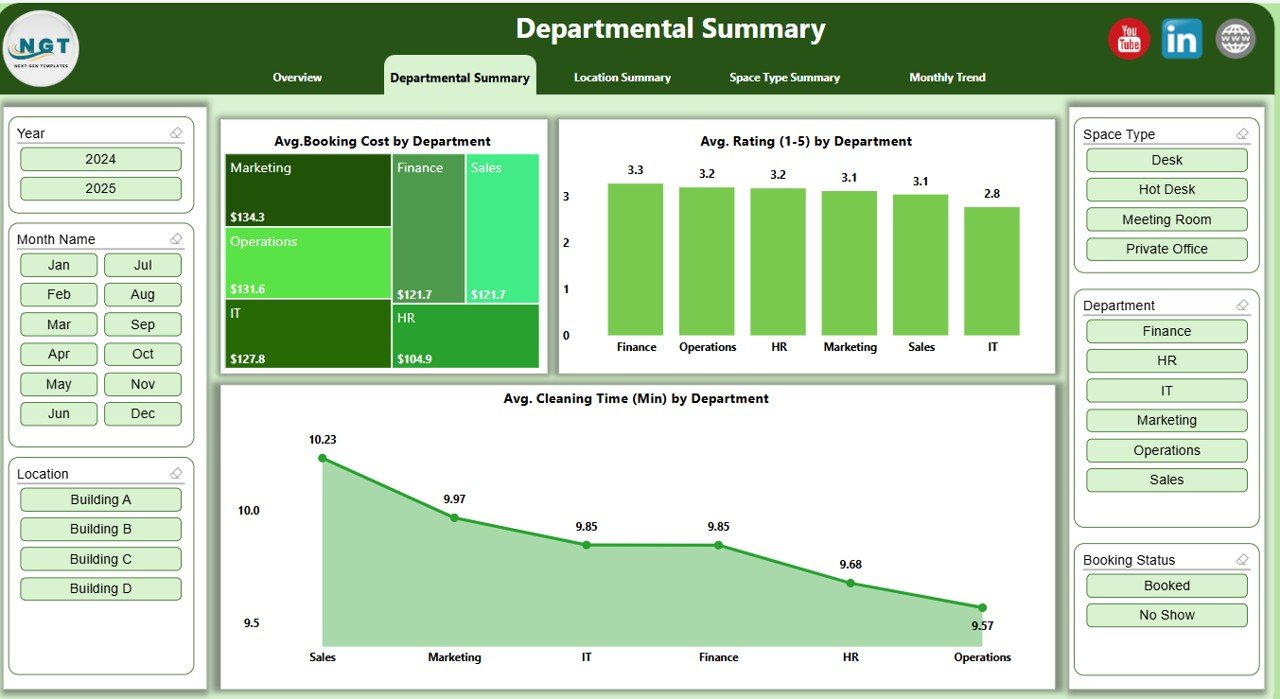
Departmental Summary: Breakdown by departments
-
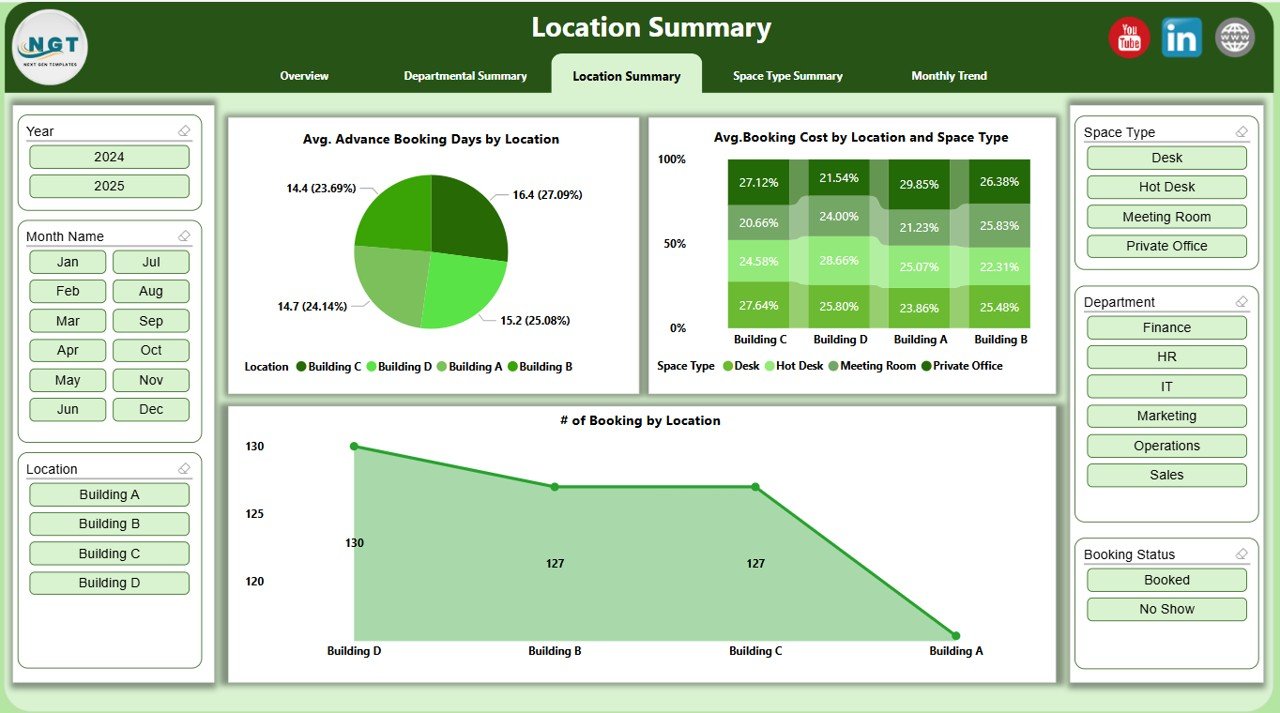
Location Summary: Analyze usage by office locations
-
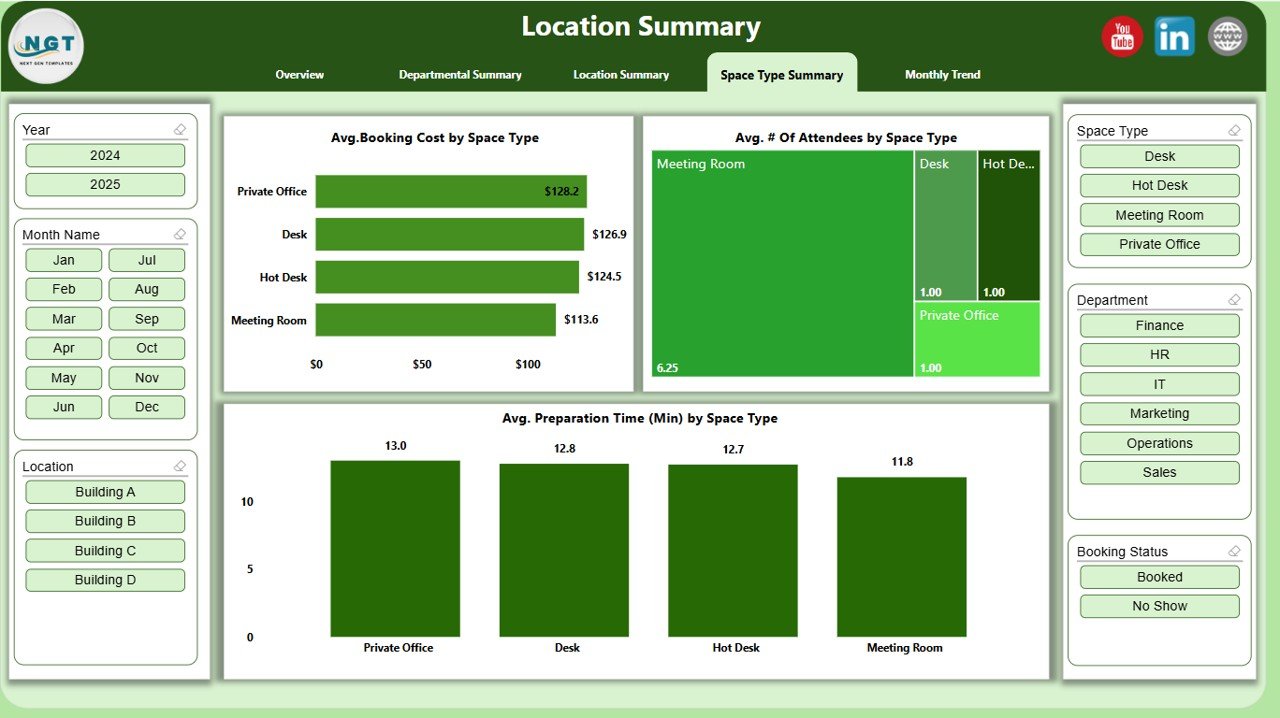
Space Type Summary: Understand how space types are utilized
-
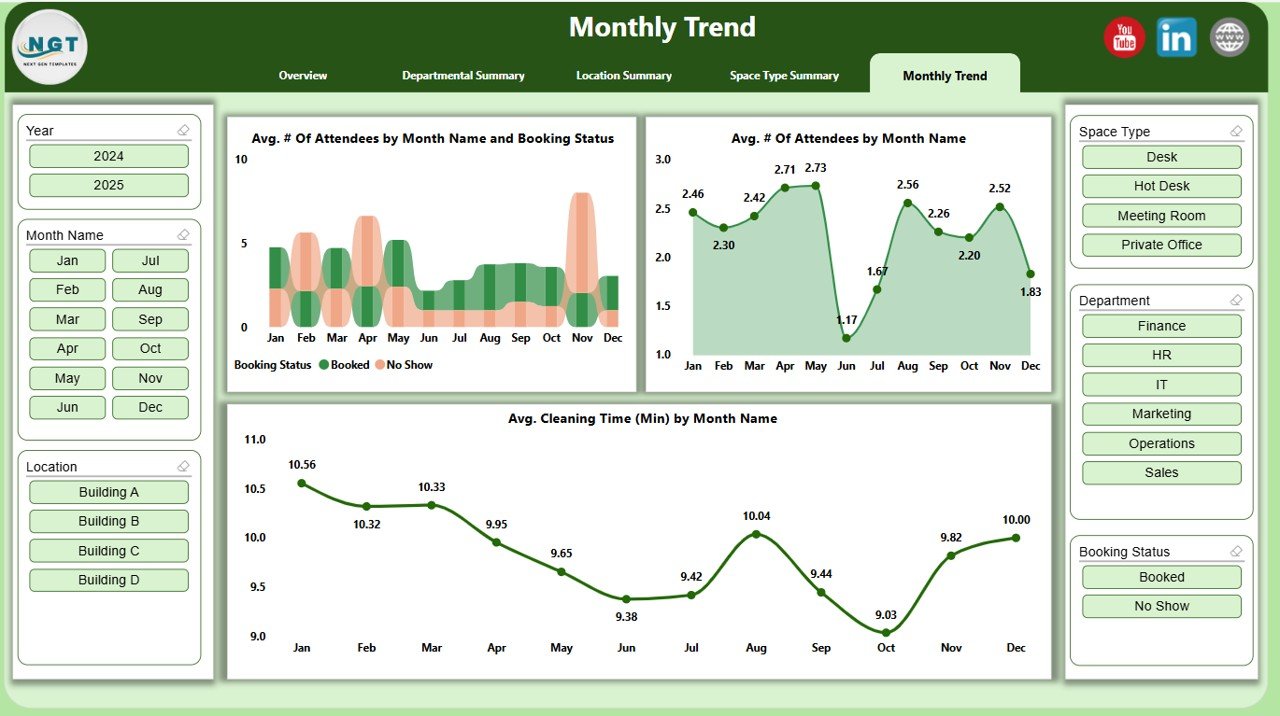
Monthly Trends: See seasonal shifts in attendance, cleaning, and bookings
🔄 Dynamic Slicers for Custom Views
Each page includes 6 slicers to let you filter data by:
-
Department
-
Location
-
Space Type
-
Booking Status
-
Month
-
Attendees
📉 Stunning Charts & Graphs
See your data in action with visual aids:
-
Bar Charts
-
Pie Charts
-
Line Graphs
-
Heatmaps (customizable)
📂 What’s Inside the Office Space Utilization Dashboard
When you download this product, you’ll receive:
✅ A fully functional Power BI dashboard file (.pbix)
✅ Sample Excel dataset for easy customization
✅ Pages pre-loaded with charts, slicers, and visuals
✅ KPI cards configured with auto-calculating DAX formulas
✅ Pre-defined relationships for seamless data interaction
✅ Real-time data update capabilities—just refresh Excel!
✅ Easy-to-follow layout perfect for beginners or experts
🛠️ How to Use the Office Space Utilization Dashboard
1️⃣ Connect Your Excel File: Update the structured Excel template with your company’s booking data.
2️⃣ Open in Power BI Desktop: Launch the dashboard and click “Refresh” to load your data.
3️⃣ Use Filters & Slicers: Slice the data by department, location, space type, etc.
4️⃣ Interpret Visuals: Analyze trends, booking behavior, cleaning time, and user ratings.
5️⃣ Share Insights: Export visuals, generate reports, or publish to Power BI Service (Pro users).
6️⃣ Customize Further: Add your own KPIs, tweak layouts, or expand with DAX logic.
👥 Who Can Benefit from This Dashboard
This dashboard is perfect for:
🏢 Facility Managers – Optimize daily operations and cleaning schedules
👩💼 HR Teams – Improve employee comfort by tracking preferences
🏗️ Real Estate & Infra Teams – Make space allocation decisions
🛠️ Operations Managers – Spot inefficiencies and fix them quickly
🌐 Co-Working Space Owners – Monitor shared desk and room usage
📈 Executives – Make data-backed space investment decisions
If you manage an office, you need this dashboard!
✅ Click here to read the Detailed blog post
🔗 Visit our YouTube channel to learn step-by-step video tutorials


Reviews
There are no reviews yet.