Struggling to stay on top of customer feedback, resolution times, and SLA breaches? The Customer Satisfaction Dashboard in Excel is your all-in-one solution to track, analyze, and improve your customer support performance. Whether you’re managing a small help desk or a full-scale customer service department, this dashboard helps you take full control with interactive charts, KPI cards, and slicers — all in one sleek, easy-to-use Excel file.
💡 Key Features of Customer Satisfaction Dashboard in Excel
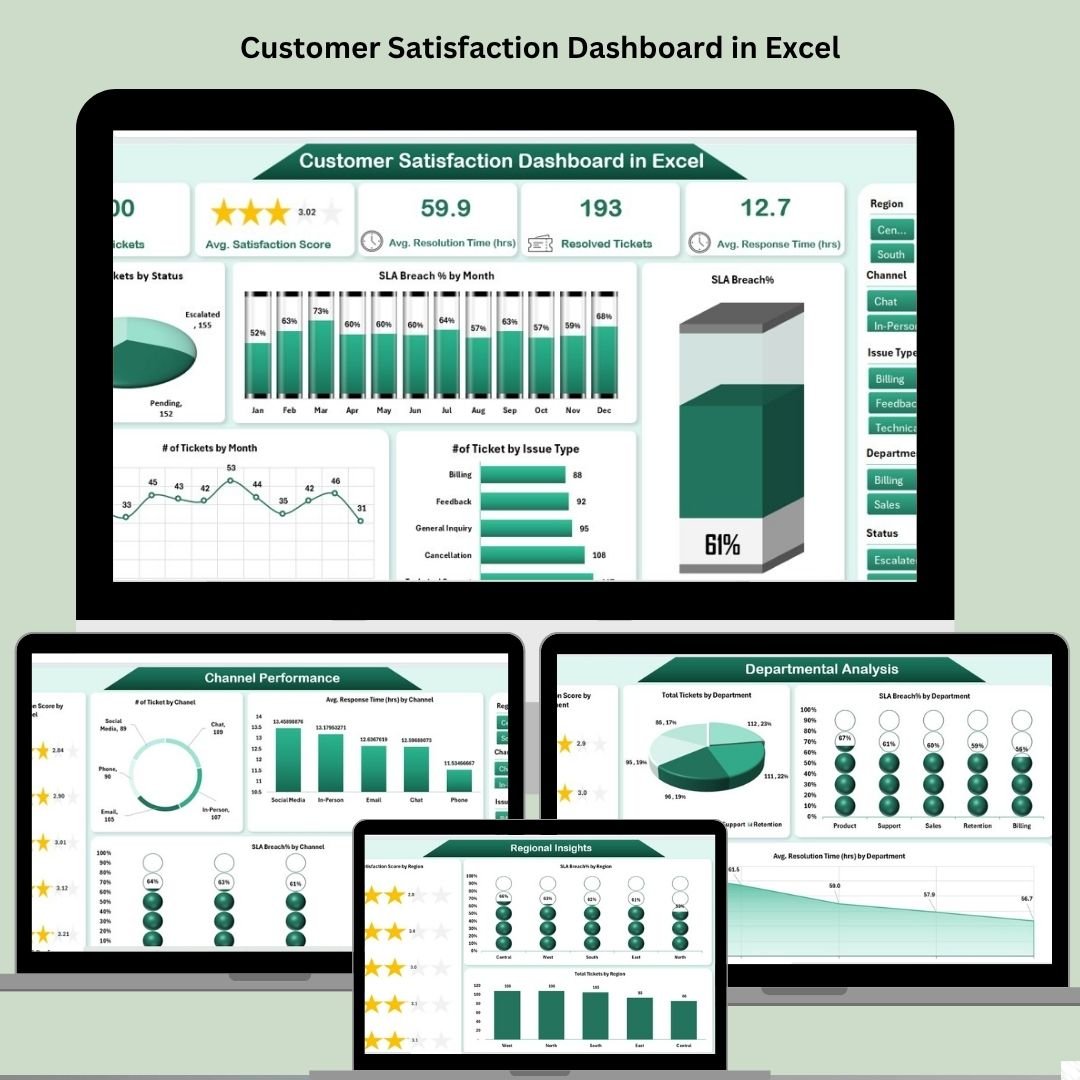
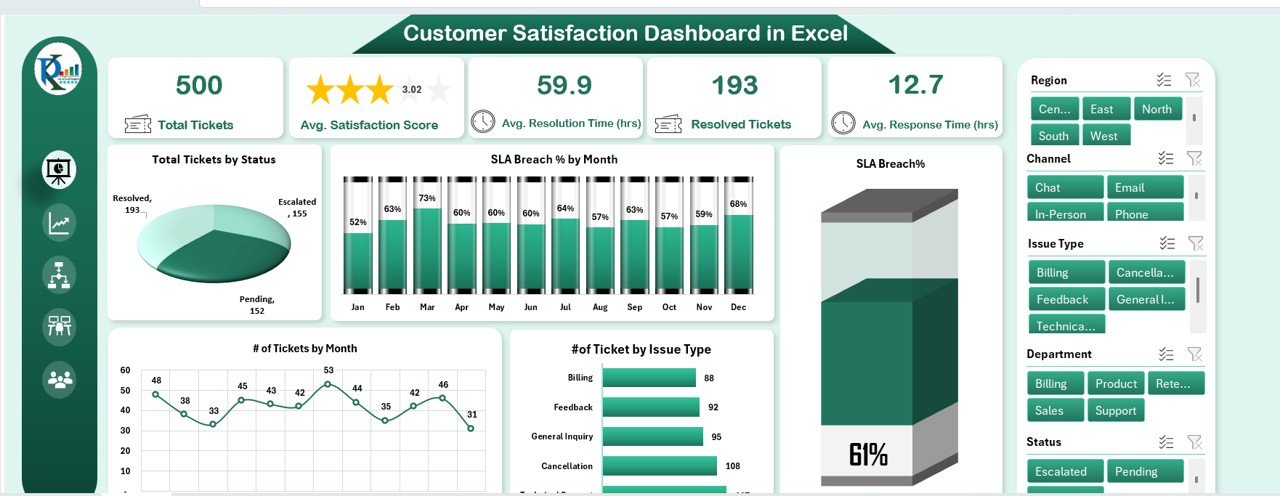
📊 Overview Sheet – One Glance View of Your Performance
Get a top-level snapshot of your team’s performance with:
-
📥 Total Tickets Received
-
😃 Average Satisfaction Score
-
⏱️ Average Resolution Time (hrs)
-
✅ Resolved Tickets Count
-
🔁 Average Response Time (hrs)
Plus, powerful charts that visualize:
-
🟡 Tickets by Status (open, resolved, pending)
-
🚨 SLA Breaches by Month
-
🗓️ Monthly Ticket Volume
-
🔍 Issue Type Distribution
-
⚠️ Overall SLA Breach %
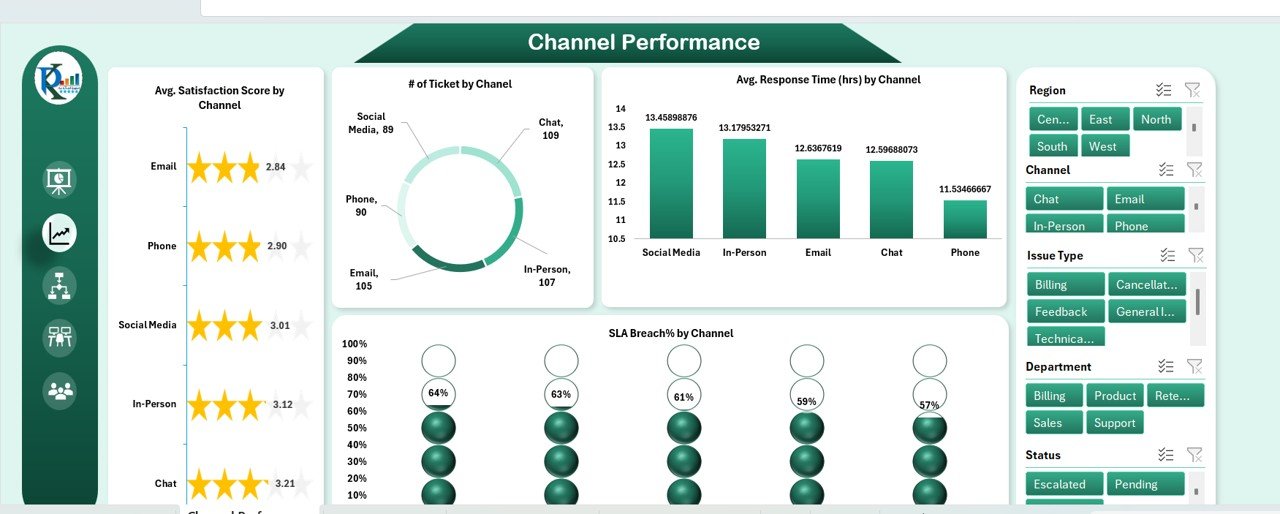
📞 Channel Performance Sheet
Track performance across multiple support channels (Email, Chat, Phone, etc.):
-
⭐ Satisfaction Score by Channel
-
🎧 Ticket Volume per Channel
-
⏰ Avg. Response Time
-
❗ SLA Breach % by Channel
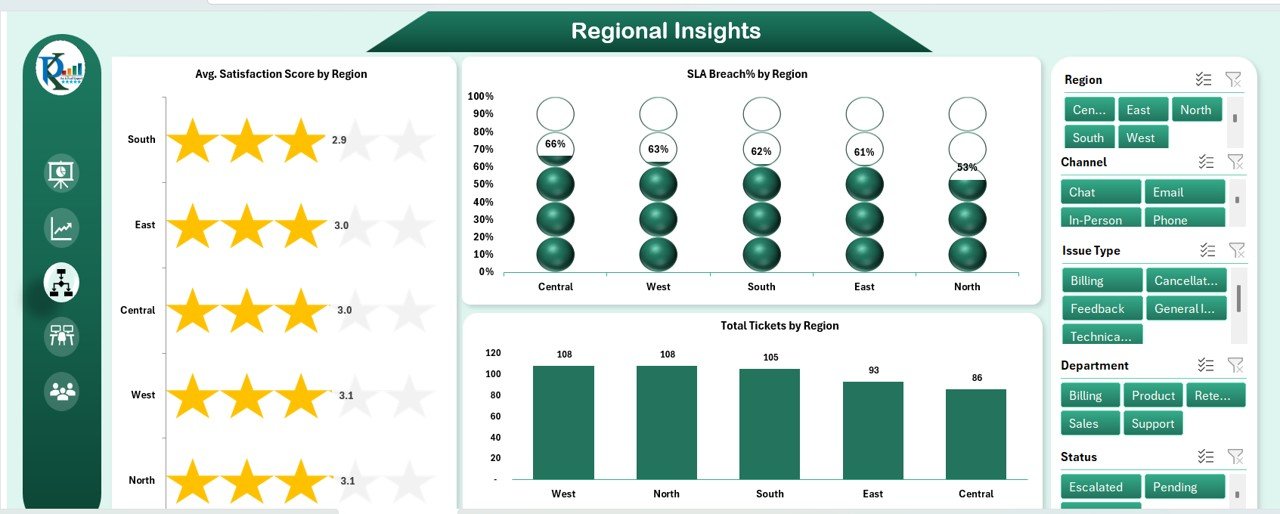
🌍 Regional Insights Sheet
Get detailed performance reports from different regions:
-
🌟 Satisfaction Score by Region
-
🔺 SLA Breach % by Region
-
📦 Tickets Received by Region
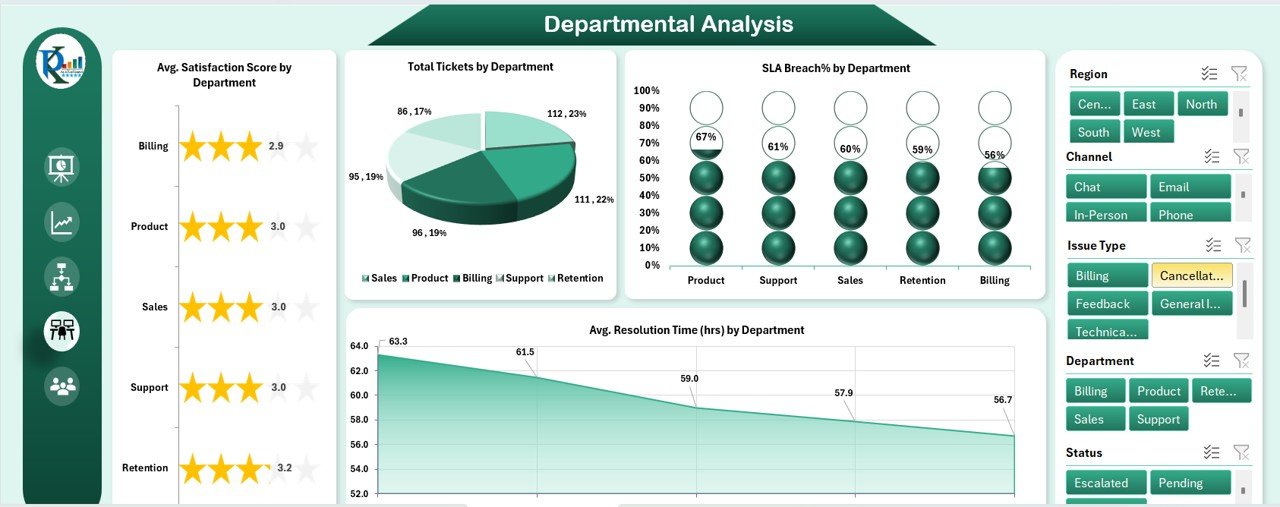
🏢 Departmental Analysis Sheet
Measure how each internal team is performing:
-
⭐ Satisfaction Score by Department
-
🧾 Tickets Assigned
-
⚠️ SLA Breach %
-
🕓 Resolution Time by Department
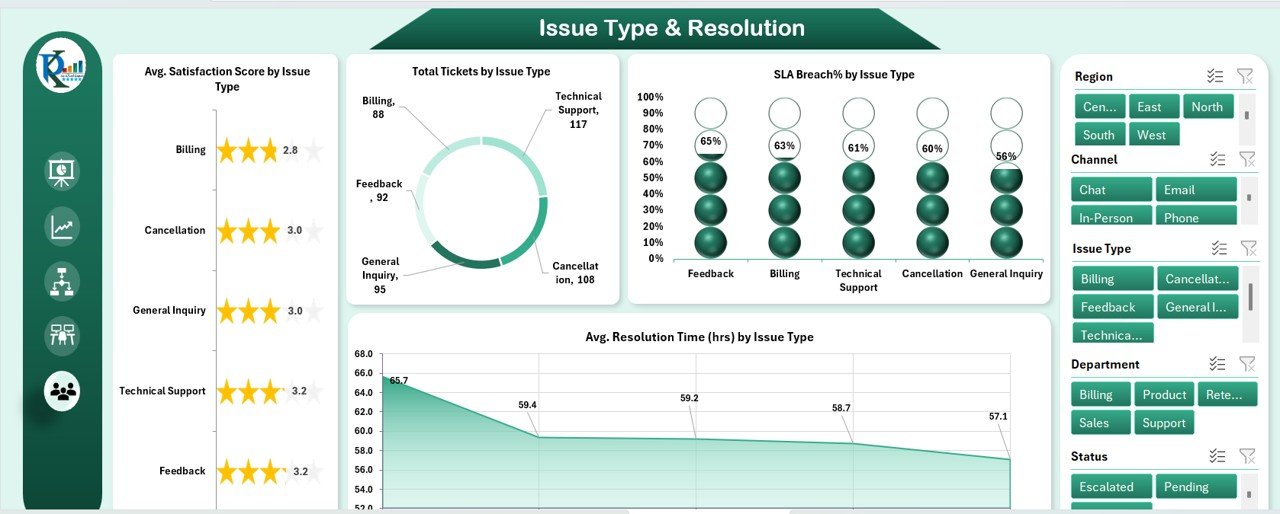
🛠️ Issue Type & Resolution Sheet
Find out what issues are eating up your support bandwidth:
-
🧾 Satisfaction Score by Issue Type
-
📊 Ticket Volume
-
⚠️ SLA Breach %
-
🕒 Avg. Resolution Time
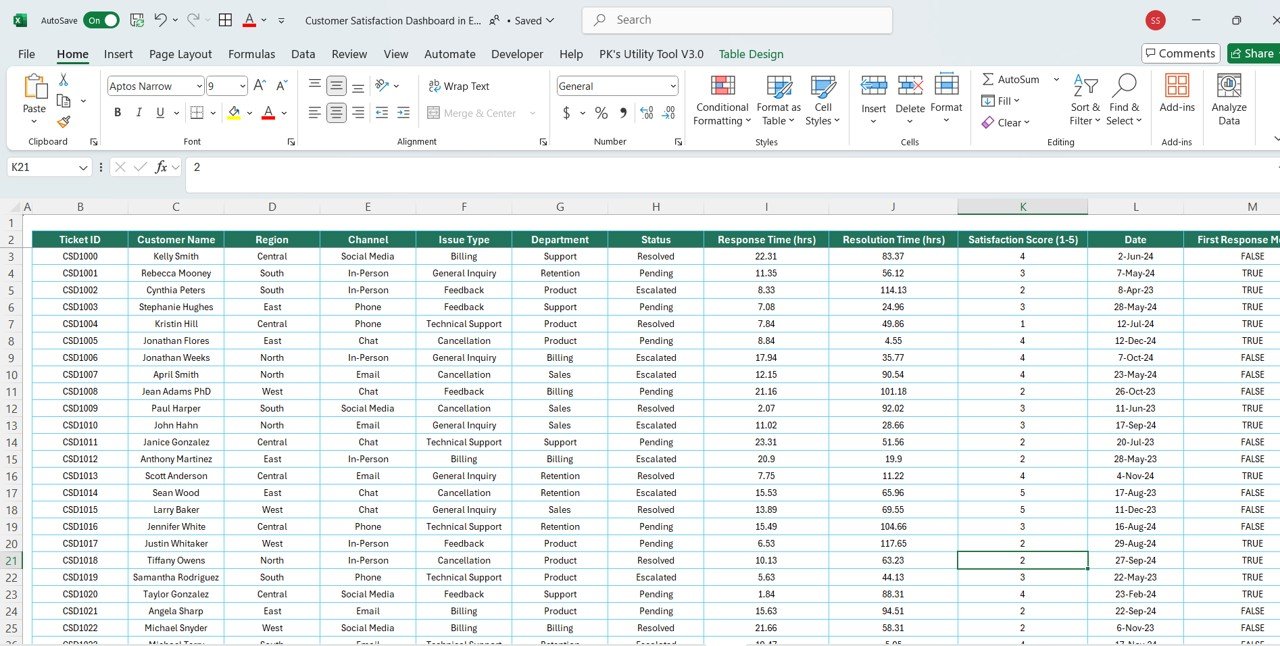
📥 Data Sheet – Centralized Data Entry
Easily manage all your service data in one editable table with fields like:
-
🎟️ Ticket ID, 👤 Customer Name, 📅 Date, 🧾 Issue Type, 💬 Channel, 🏢 Department, ✅ Status, ⌛ Response Time, ⌛ Resolution Time, and 😊 Satisfaction Score
📦 What’s Inside the Customer Satisfaction Dashboard
-
✅ 6 Fully Functional Sheets — From Overview to Data Sheet
-
🧠 Dynamic KPI Cards — Instant insights into your support performance
-
📉 Interactive Charts & Slicers — Easy data filtering and analysis
-
📥 Editable Input Sheet — Manage all data in one place
-
🖥️ Excel-based Dashboard — No coding or add-ins needed
-
🎯 Track KPIs like SLA breaches, resolution time, CSAT scores, and more
-
🎨 Customizable Layouts — Adjust KPIs, chart types, and formatting
🚀 How to Use the Customer Satisfaction Dashboard
-
Enter Data in the Data Sheet
-
Navigate Between Tabs using slicers or buttons
-
View Charts & KPIs auto-updated with new entries
-
Analyze Trends by channel, department, region, and issue type
-
Present Insights to stakeholders using beautiful visuals
Everything is already set up — just input your data and start gaining insights!
👥 Who Can Benefit from This Dashboard
This tool is ideal for:
-
💬 Customer Service Teams – Monitor tickets, feedback, and SLAs
-
🧑💼 Customer Experience Managers – Spot trends and take quick action
-
🏢 Support Departments in any industry
-
📊 Small Business Owners needing structured service tracking
-
🧠 Data-Driven Teams looking for insights without complex tools
If customer happiness matters to your business, this dashboard is a must-have!


Reviews
There are no reviews yet.