

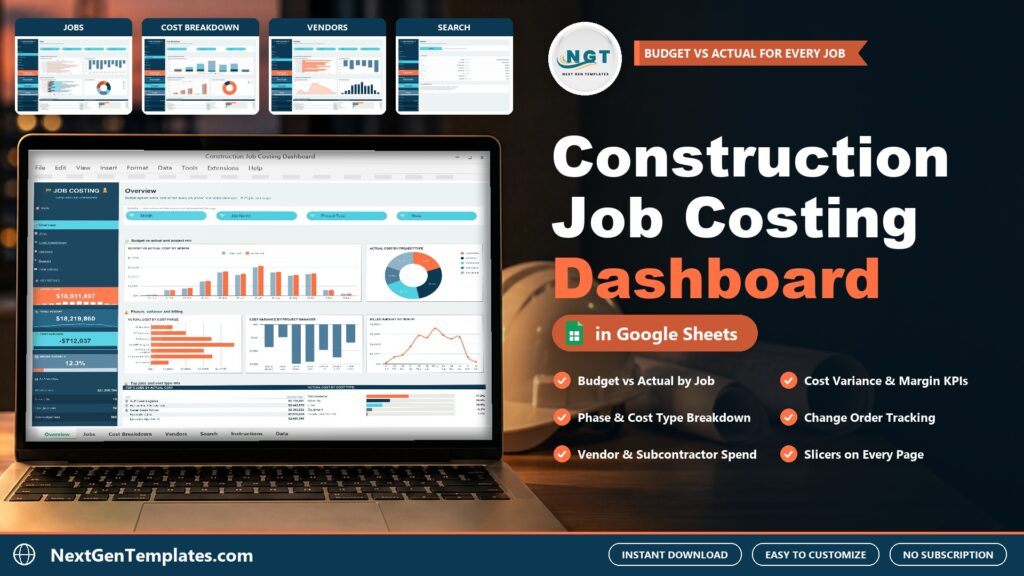
Job costing only helps when it is read before the job closes. The Construction Job Costing Dashboard in Google Sheets puts budget, actual cost, cost variance, billed amount and gross margin for every job on one screen, then breaks them down by cost phase, cost type, vendor, project manager and state.
🌍 Join 10,000+ customers in 180+ countries using NextGenTemplates to replace paid SaaS tools with one-time-purchase Excel, Google Sheets, Power BI and HTML templates.
Watch the Construction Job Costing Dashboard in Google Sheets: Budget vs Actual by Job walkthrough
 Launch offer
Formulas, lookups, QUERY, dynamic arrays, pivot tables, charts, live data and Apps Script, ending with an interactive sales dashboard. 74 lessons by PK with a practice file for every lesson.
What the Construction Job Costing Dashboard does
- Budget vs actual: by month, by job and by cost type, so this construction cost dashboard shows where spend ran ahead of plan.
- Cost variance and margin: Cost Variance and Gross Margin % stay in a side rail on every page.
- Phase and cost type breakdown: actual cost from Site Work to Closeout, split into Labor, Materials, Equipment, Subcontractor and Overhead and Permits.
- Change orders: cost source separates base contract cost from change orders, with change order cost by month.
- Vendors and crews: a ranked view of who you pay and how much.
- Search page: type an Entry ID such as JC-0001 and read the full cost record.
As a job costing template for construction it works in any browser. Sample data is included: fictional job cost entries for ten jobs. The workbook has room for 1,000 entries.
A look at the pages
Overview Page
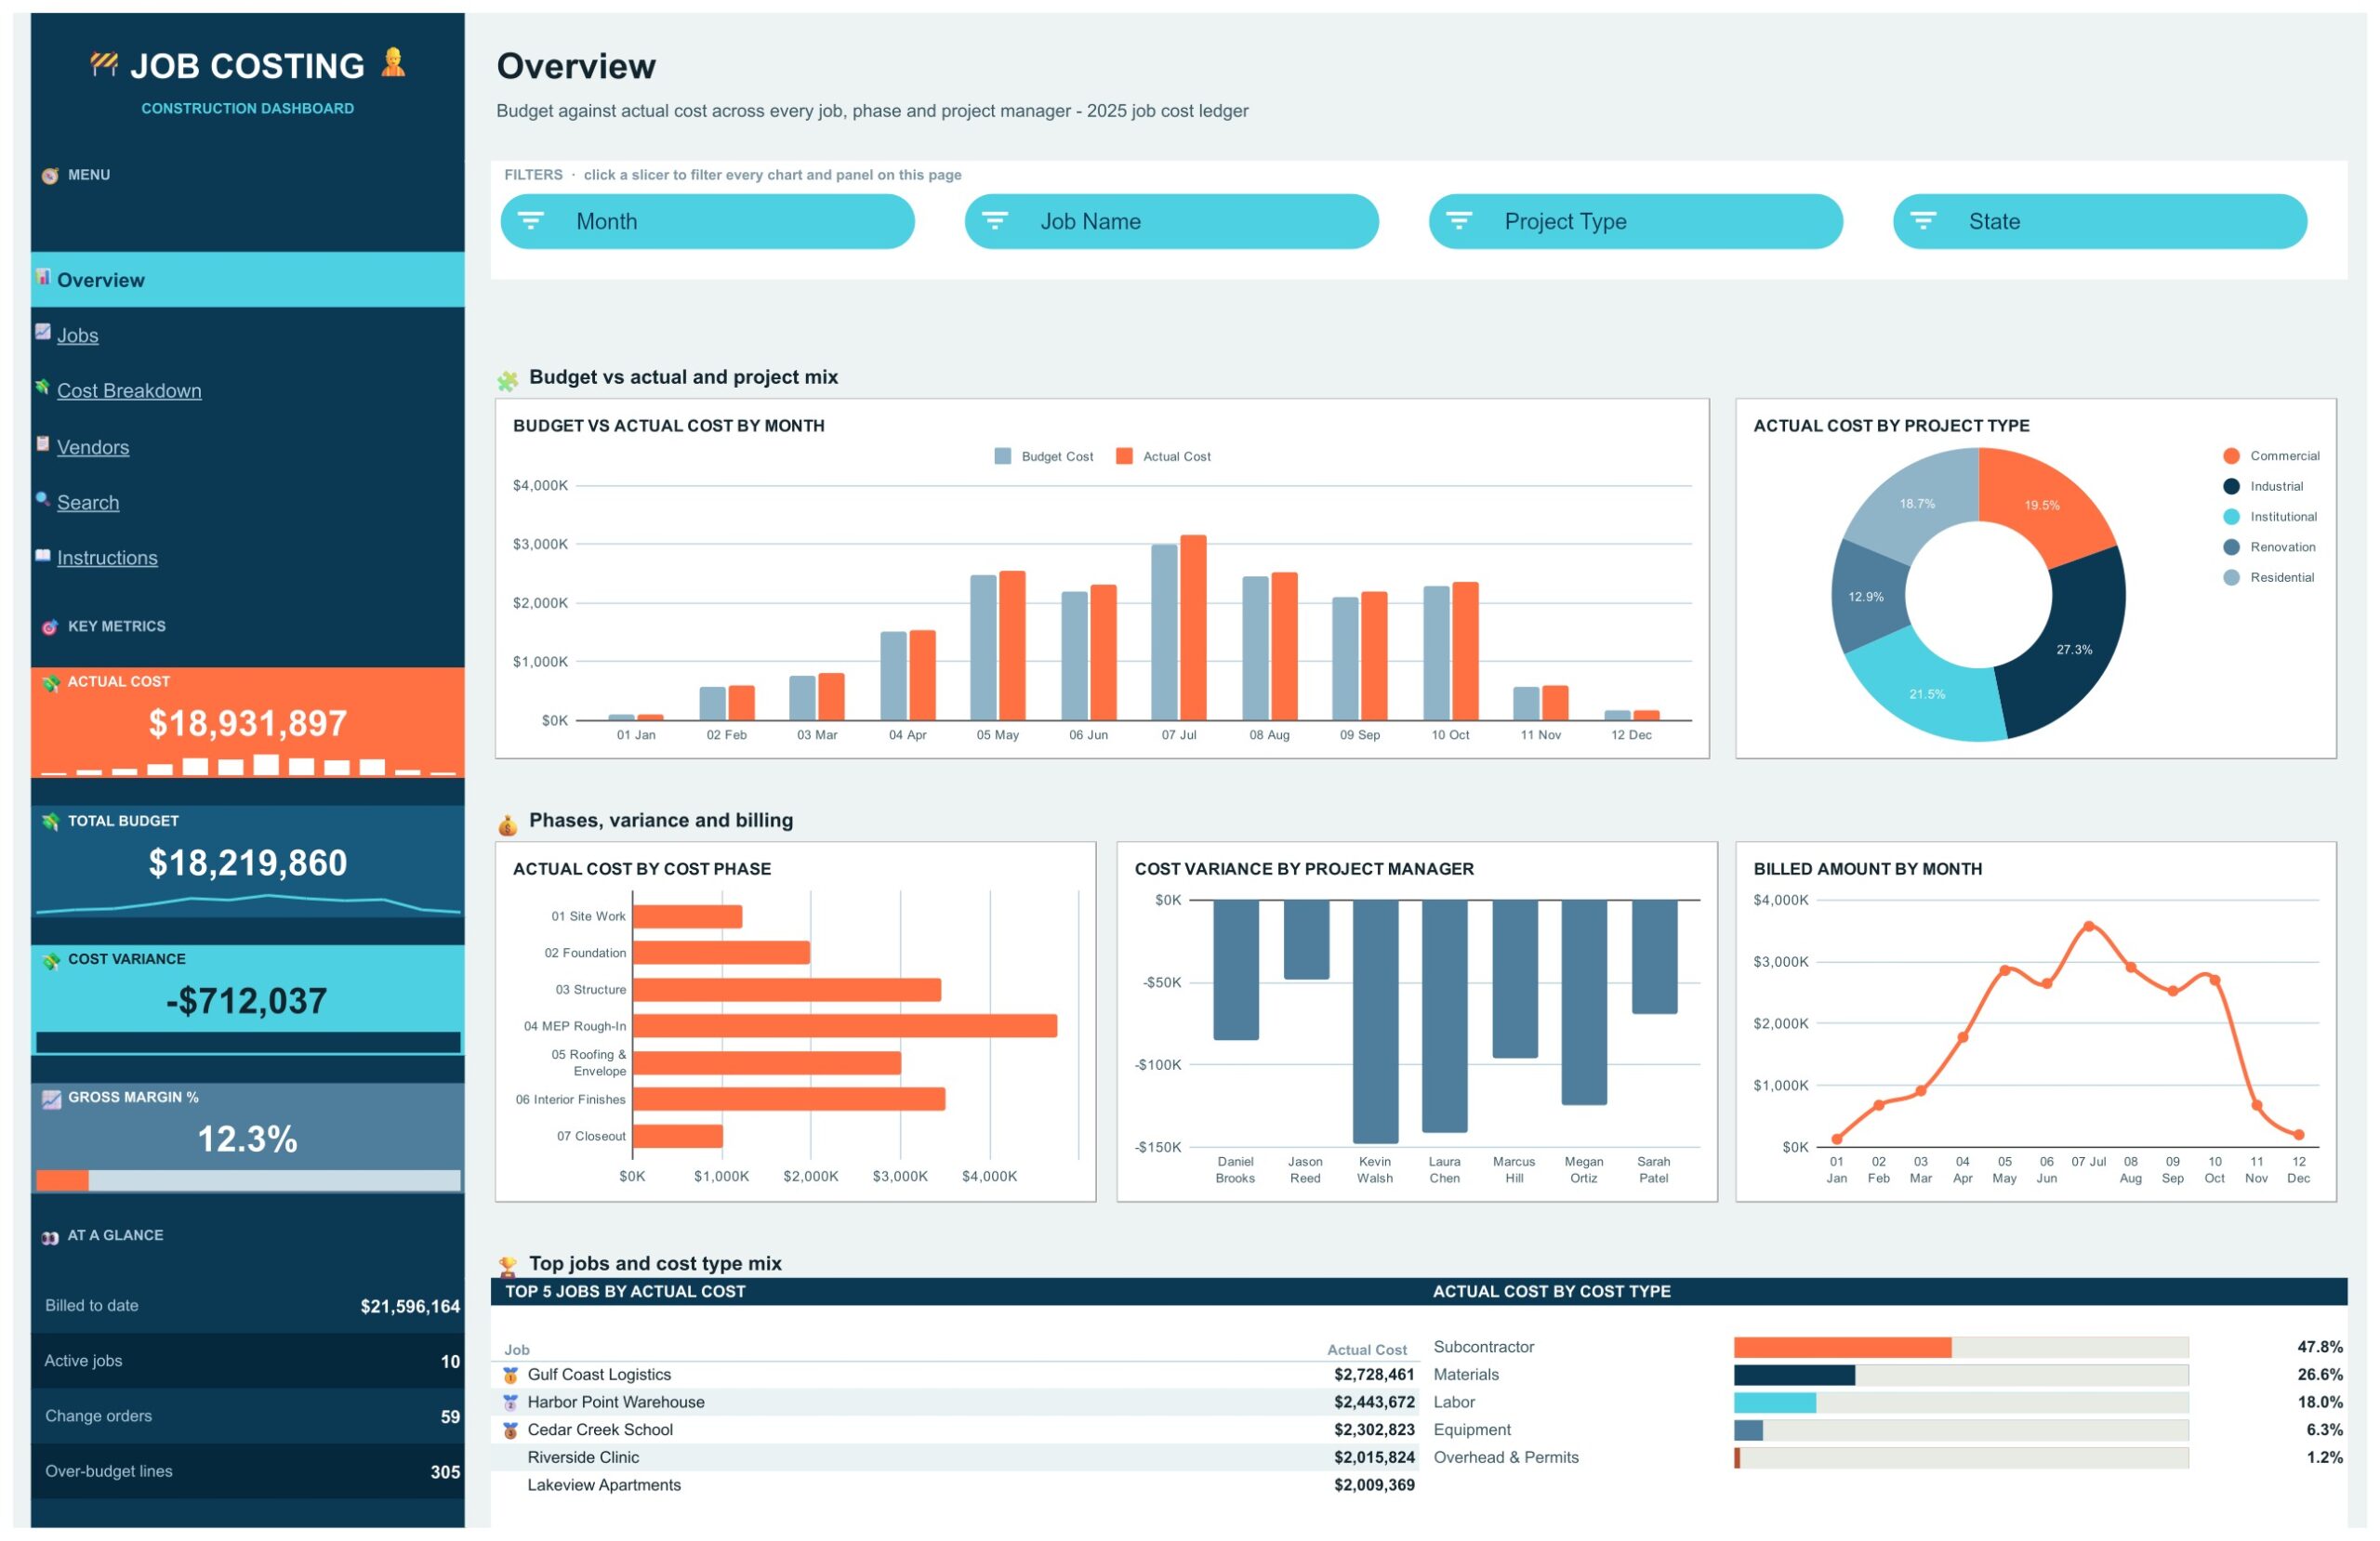
The Overview page leads with the figures a contractor checks first: Actual Cost, Total Budget, Cost Variance and Gross Margin % sit in a side rail that stays in view on every page. Charts show Budget vs Actual Cost by Month, Actual Cost by Project Type, Actual Cost by Cost Phase, Cost Variance by Project Manager and Billed Amount by Month. A Top 5 Jobs by Actual Cost panel and an Actual Cost by Cost Type breakdown finish the page. Month, Job Name, Project Type and State slicers filter everything on it.
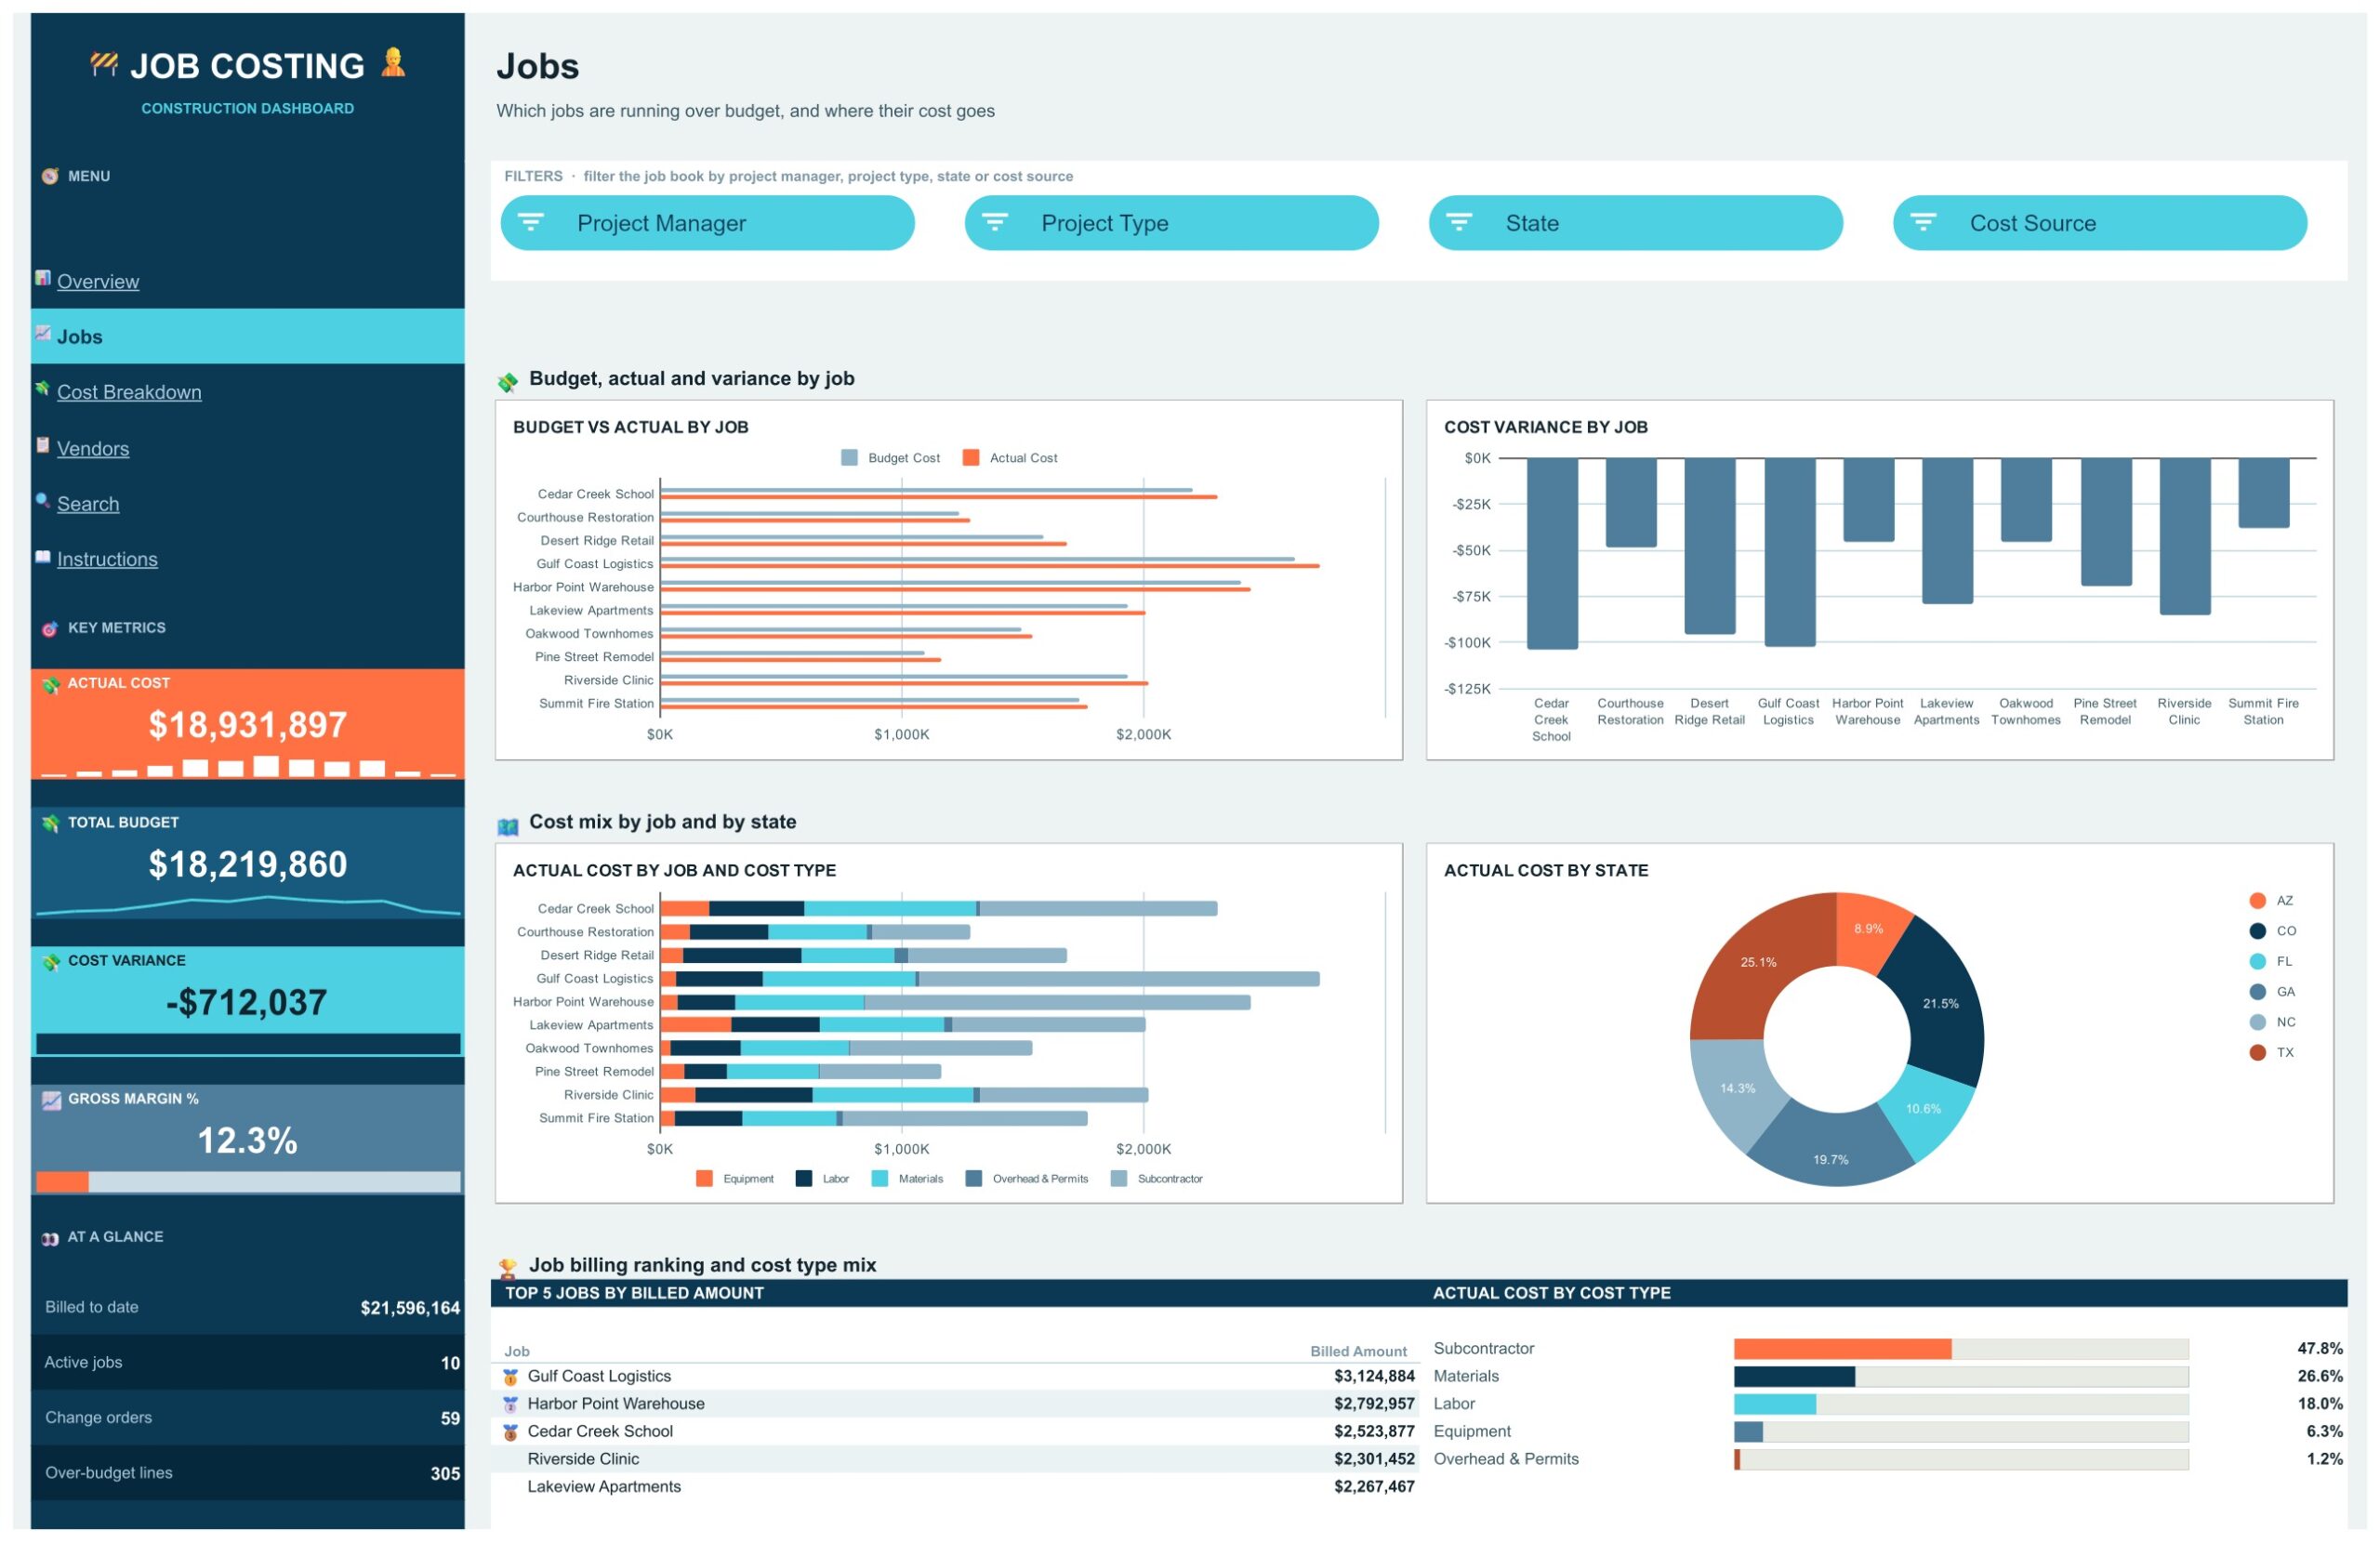
Jobs Page
Shows which jobs are running over budget and where their cost goes. Budget vs Actual by Job, Cost Variance by Job, Actual Cost by Job and Cost Type and Actual Cost by State sit beside a Top 5 Jobs by Billed Amount panel. Project Manager, Project Type, State and Cost Source slicers filter the job book.
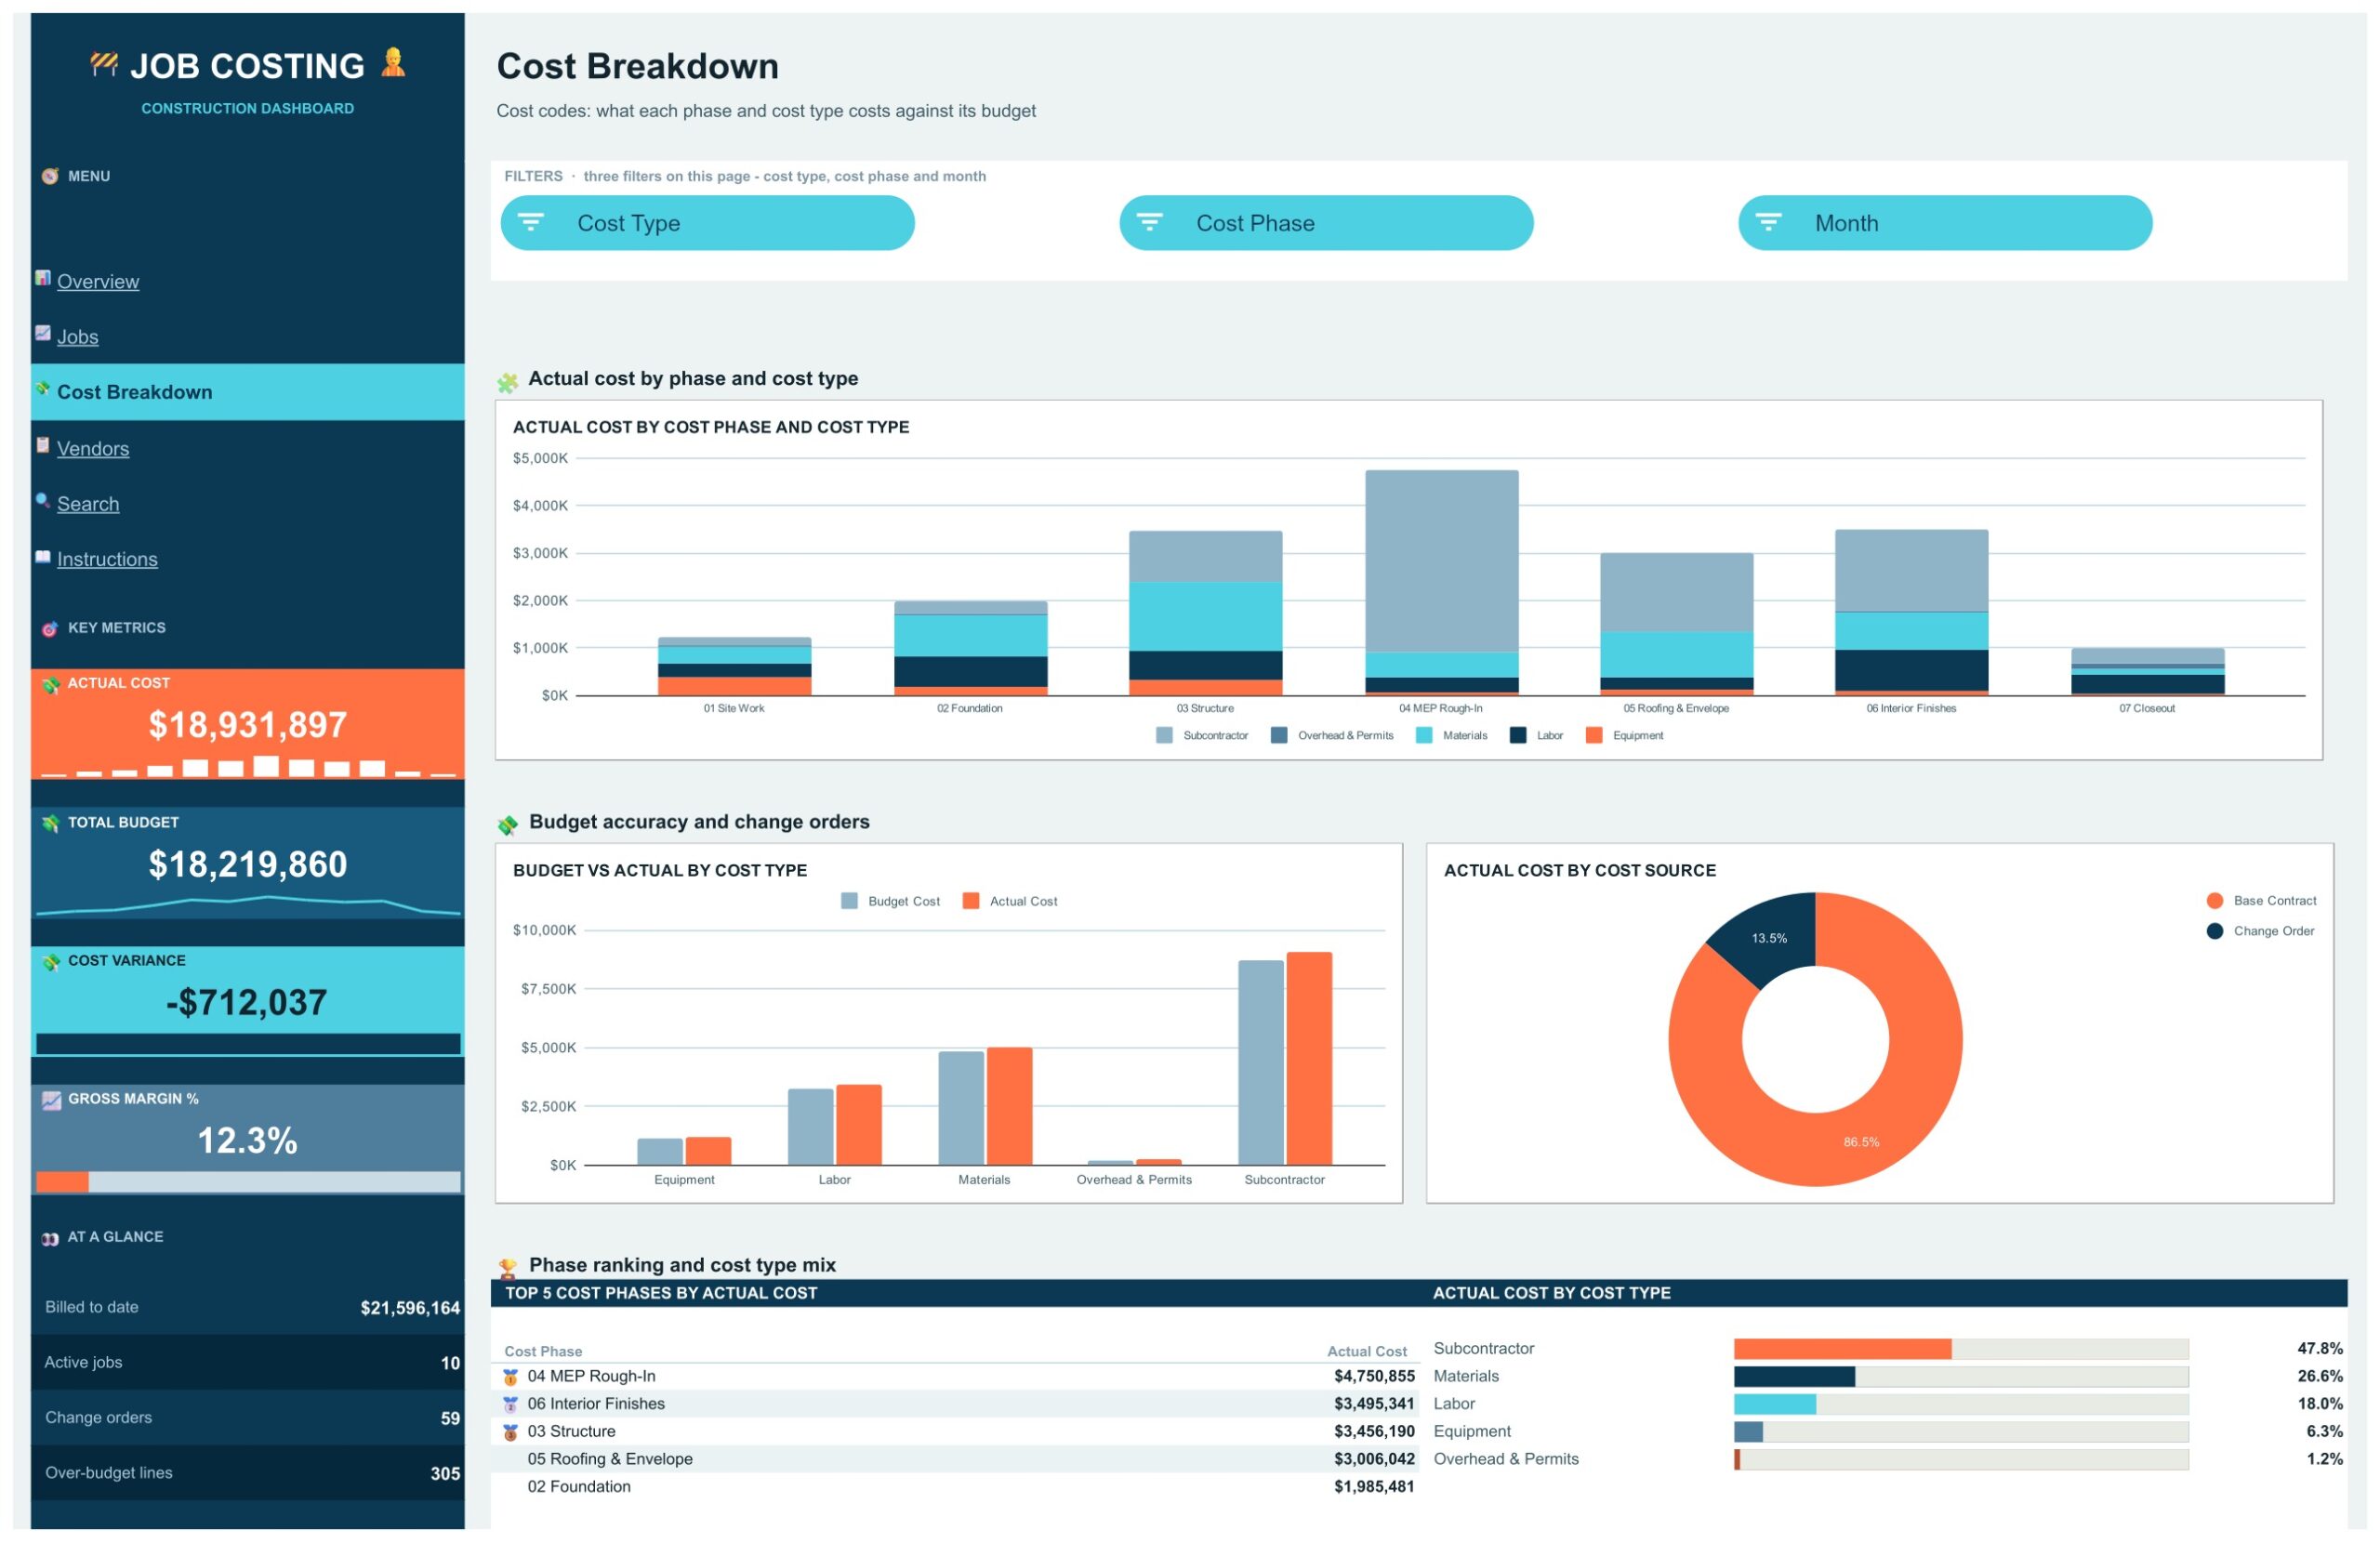
Cost Breakdown Page
Cost codes: what each phase and cost type costs against its budget. Actual Cost by Cost Phase and Cost Type, Budget vs Actual by Cost Type and Actual Cost by Cost Source (base contract against change orders) are joined by a Top 5 Cost Phases panel. Cost Type, Cost Phase and Month slicers filter the page.
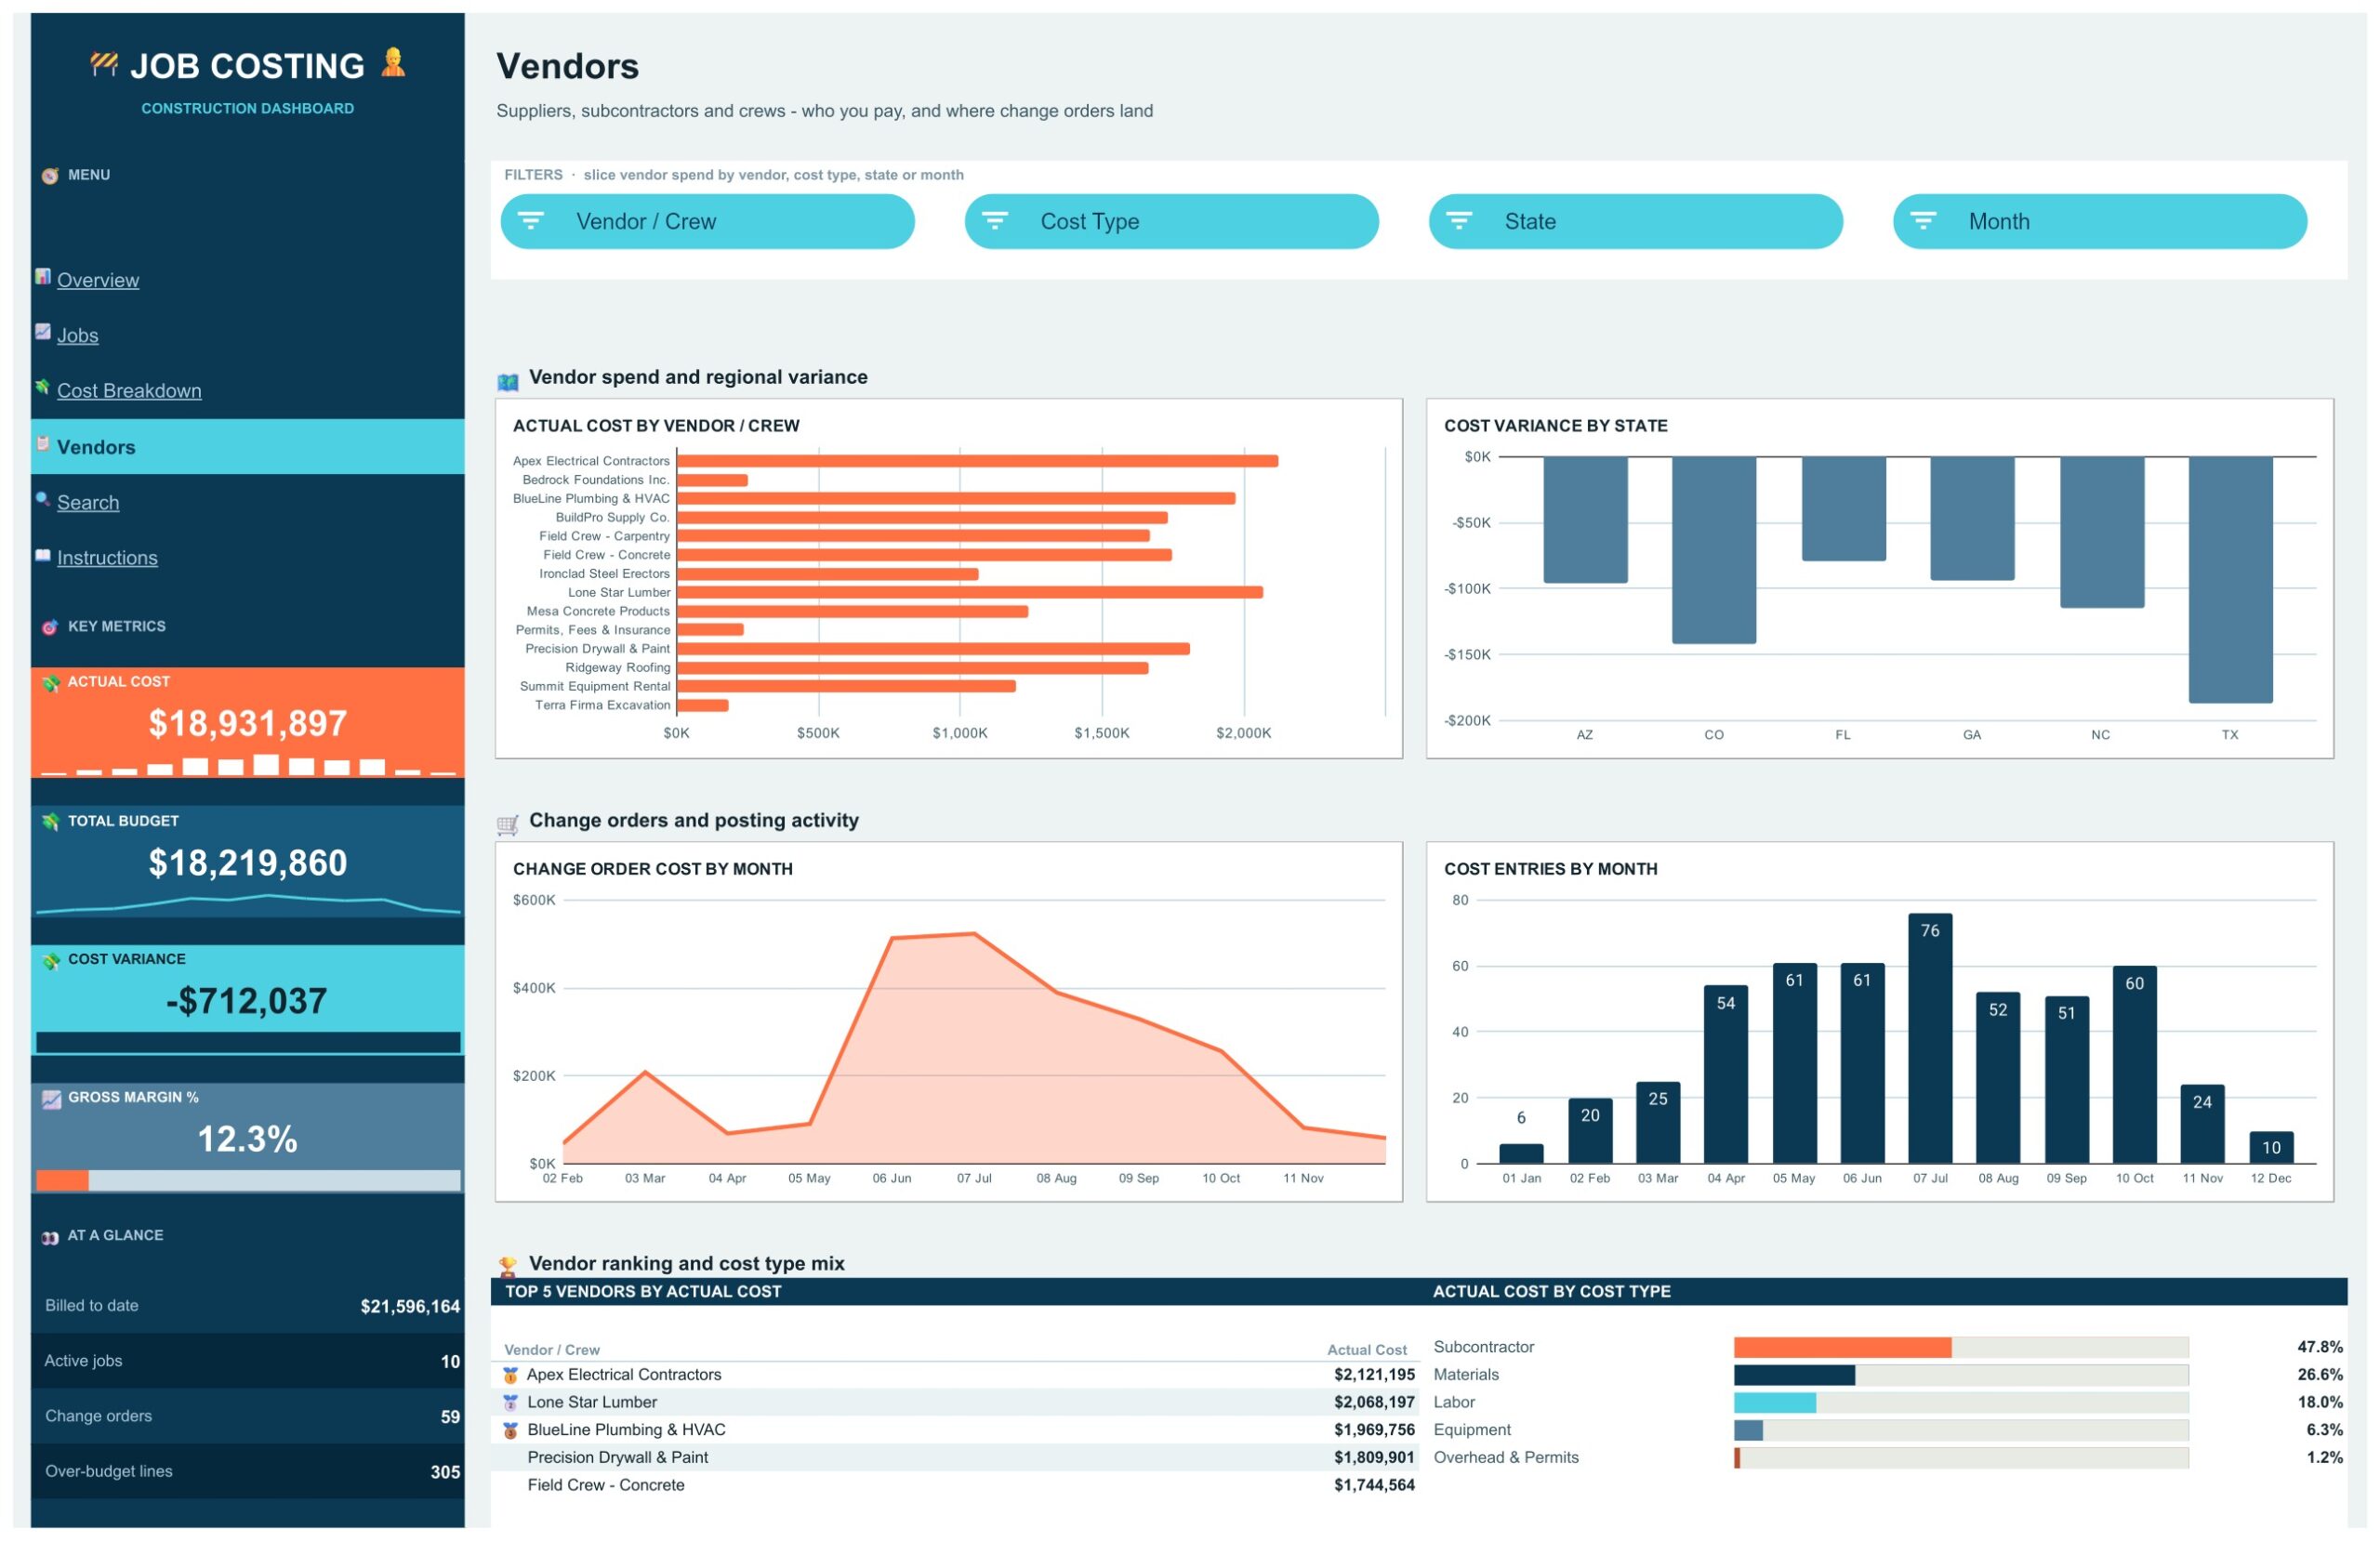
Vendors Page
Suppliers, subcontractors and crews: who you pay, and where change orders land. Actual Cost by Vendor / Crew, Cost Variance by State, Change Order Cost by Month and Cost Entries by Month sit beside a Top 5 Vendors by Actual Cost panel. Vendor / Crew, Cost Type, State and Month slicers filter the page.
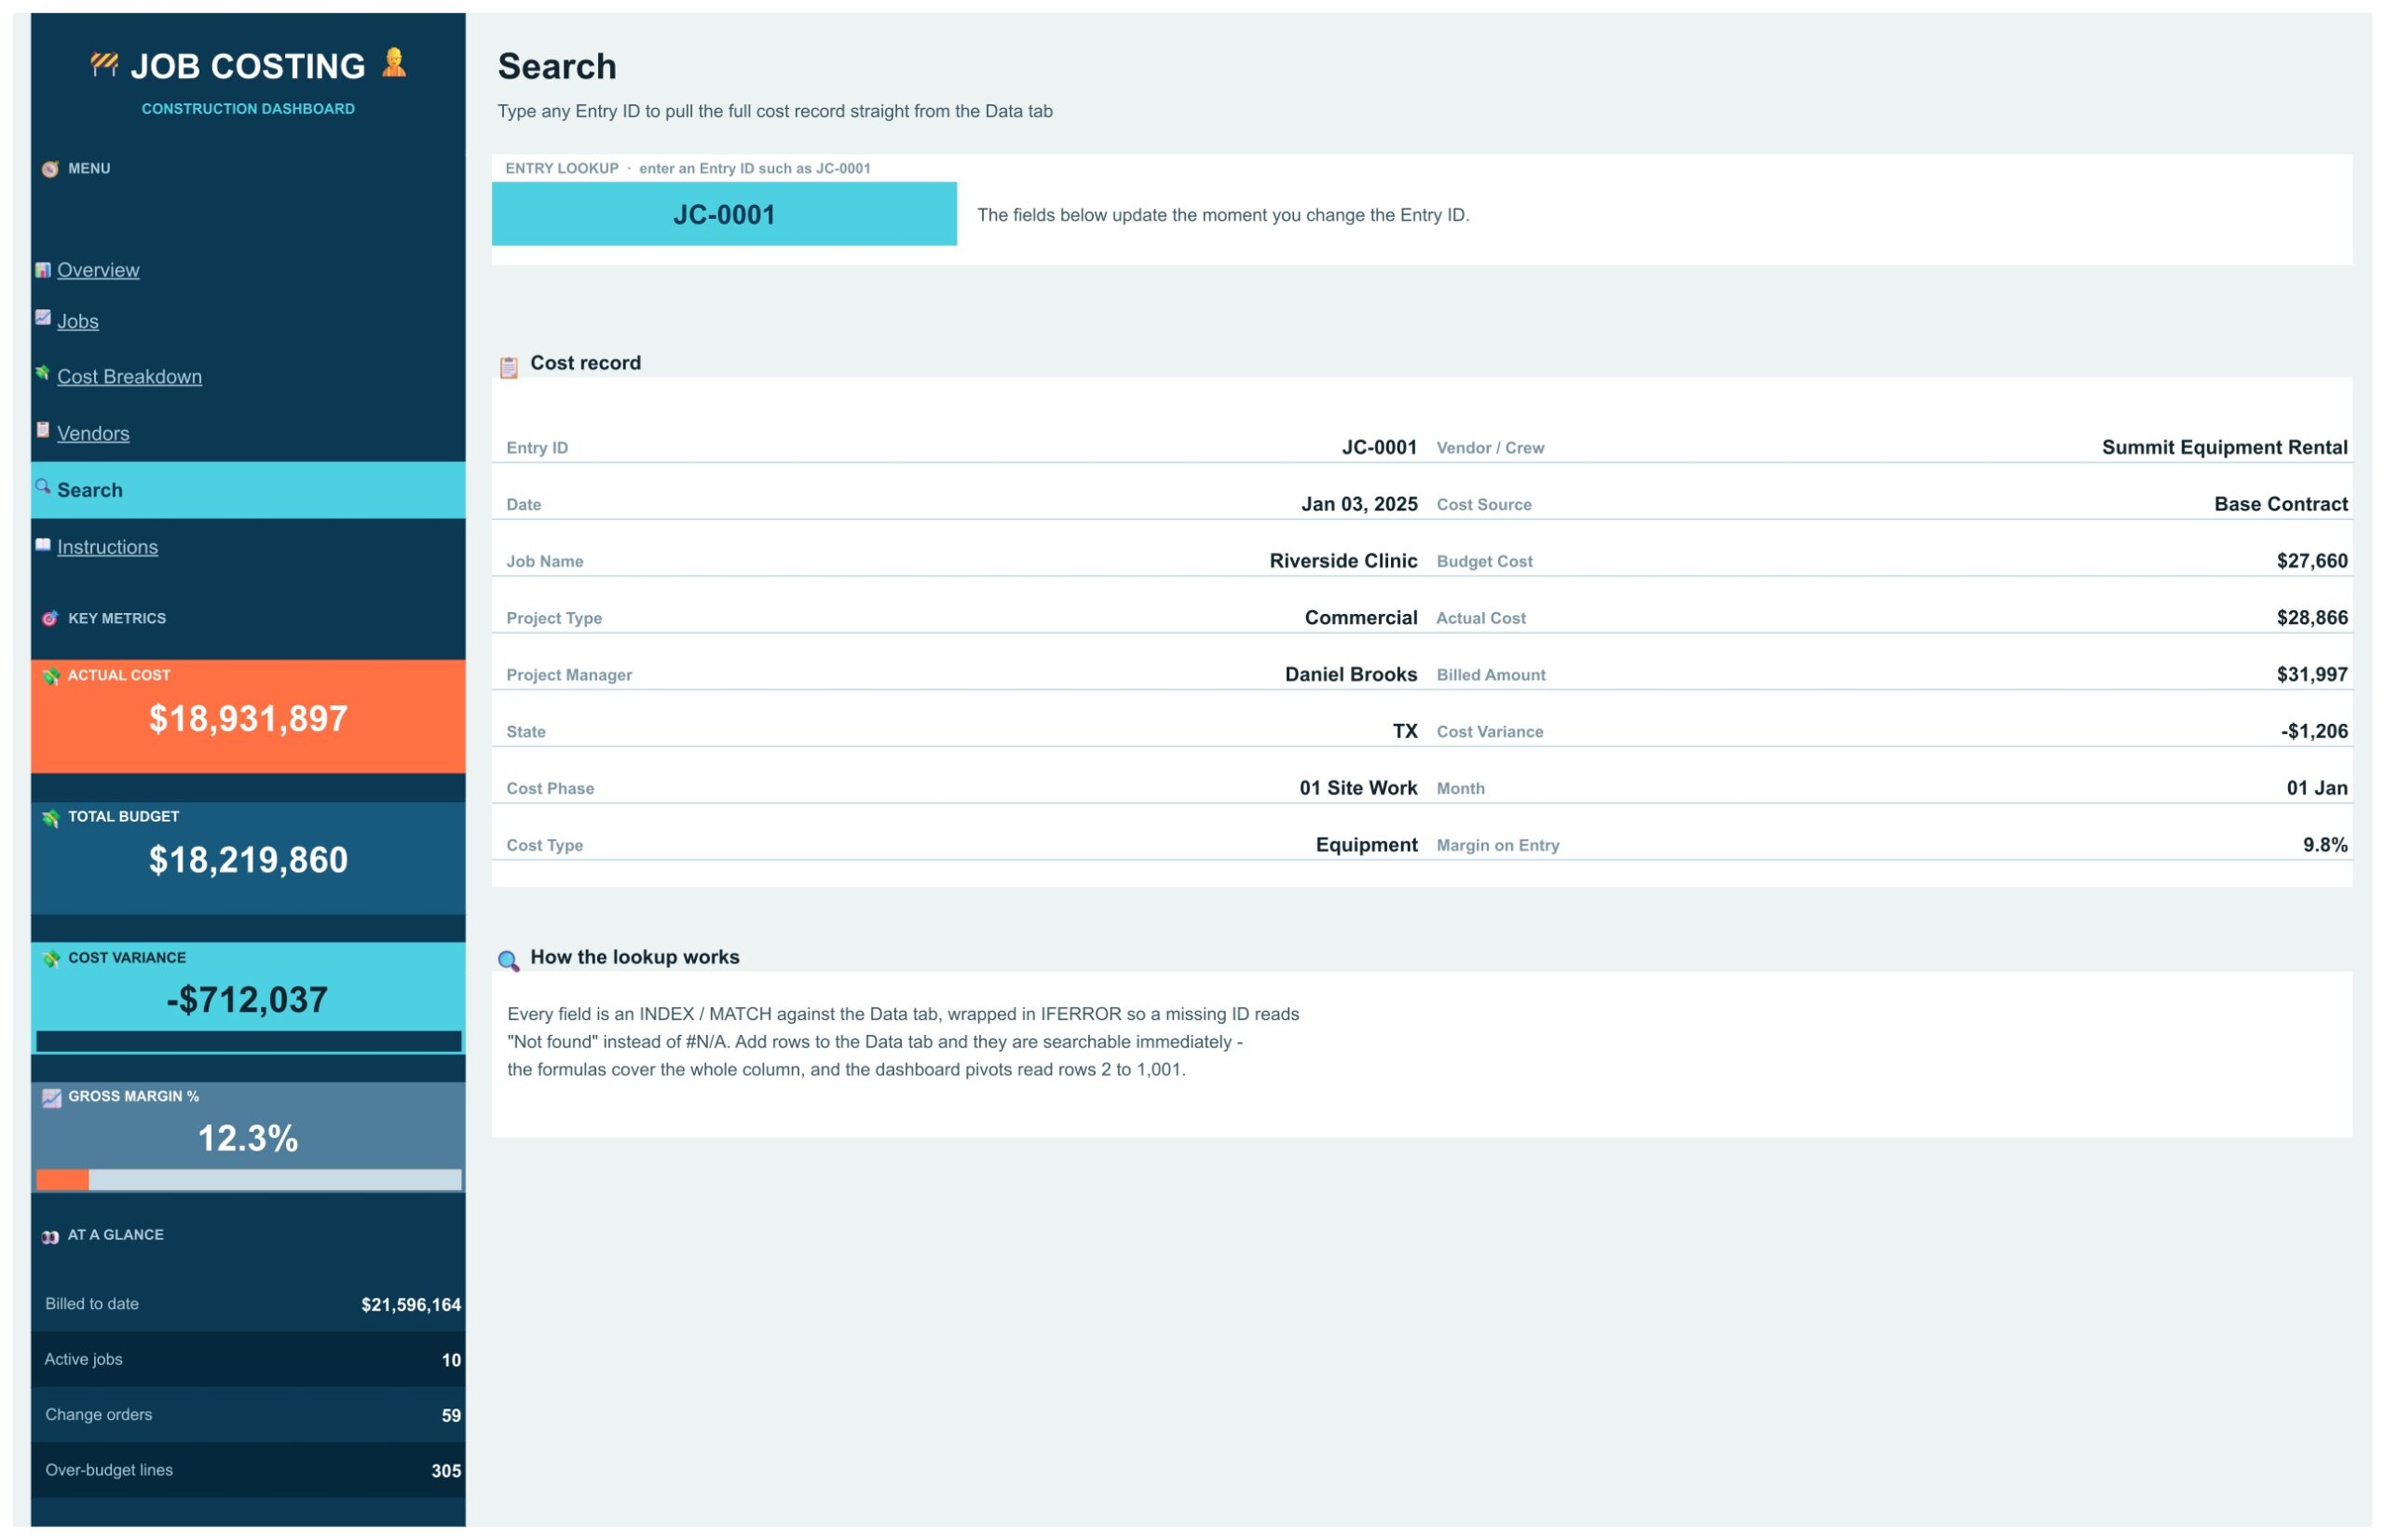
Search Page
Type any Entry ID, such as JC-0001, and the full cost record appears: date, job name, project type, project manager, state, cost phase, cost type, vendor or crew, cost source, budget cost, actual cost, billed amount, cost variance, month and margin on entry. A missing ID reads Not found instead of an error.
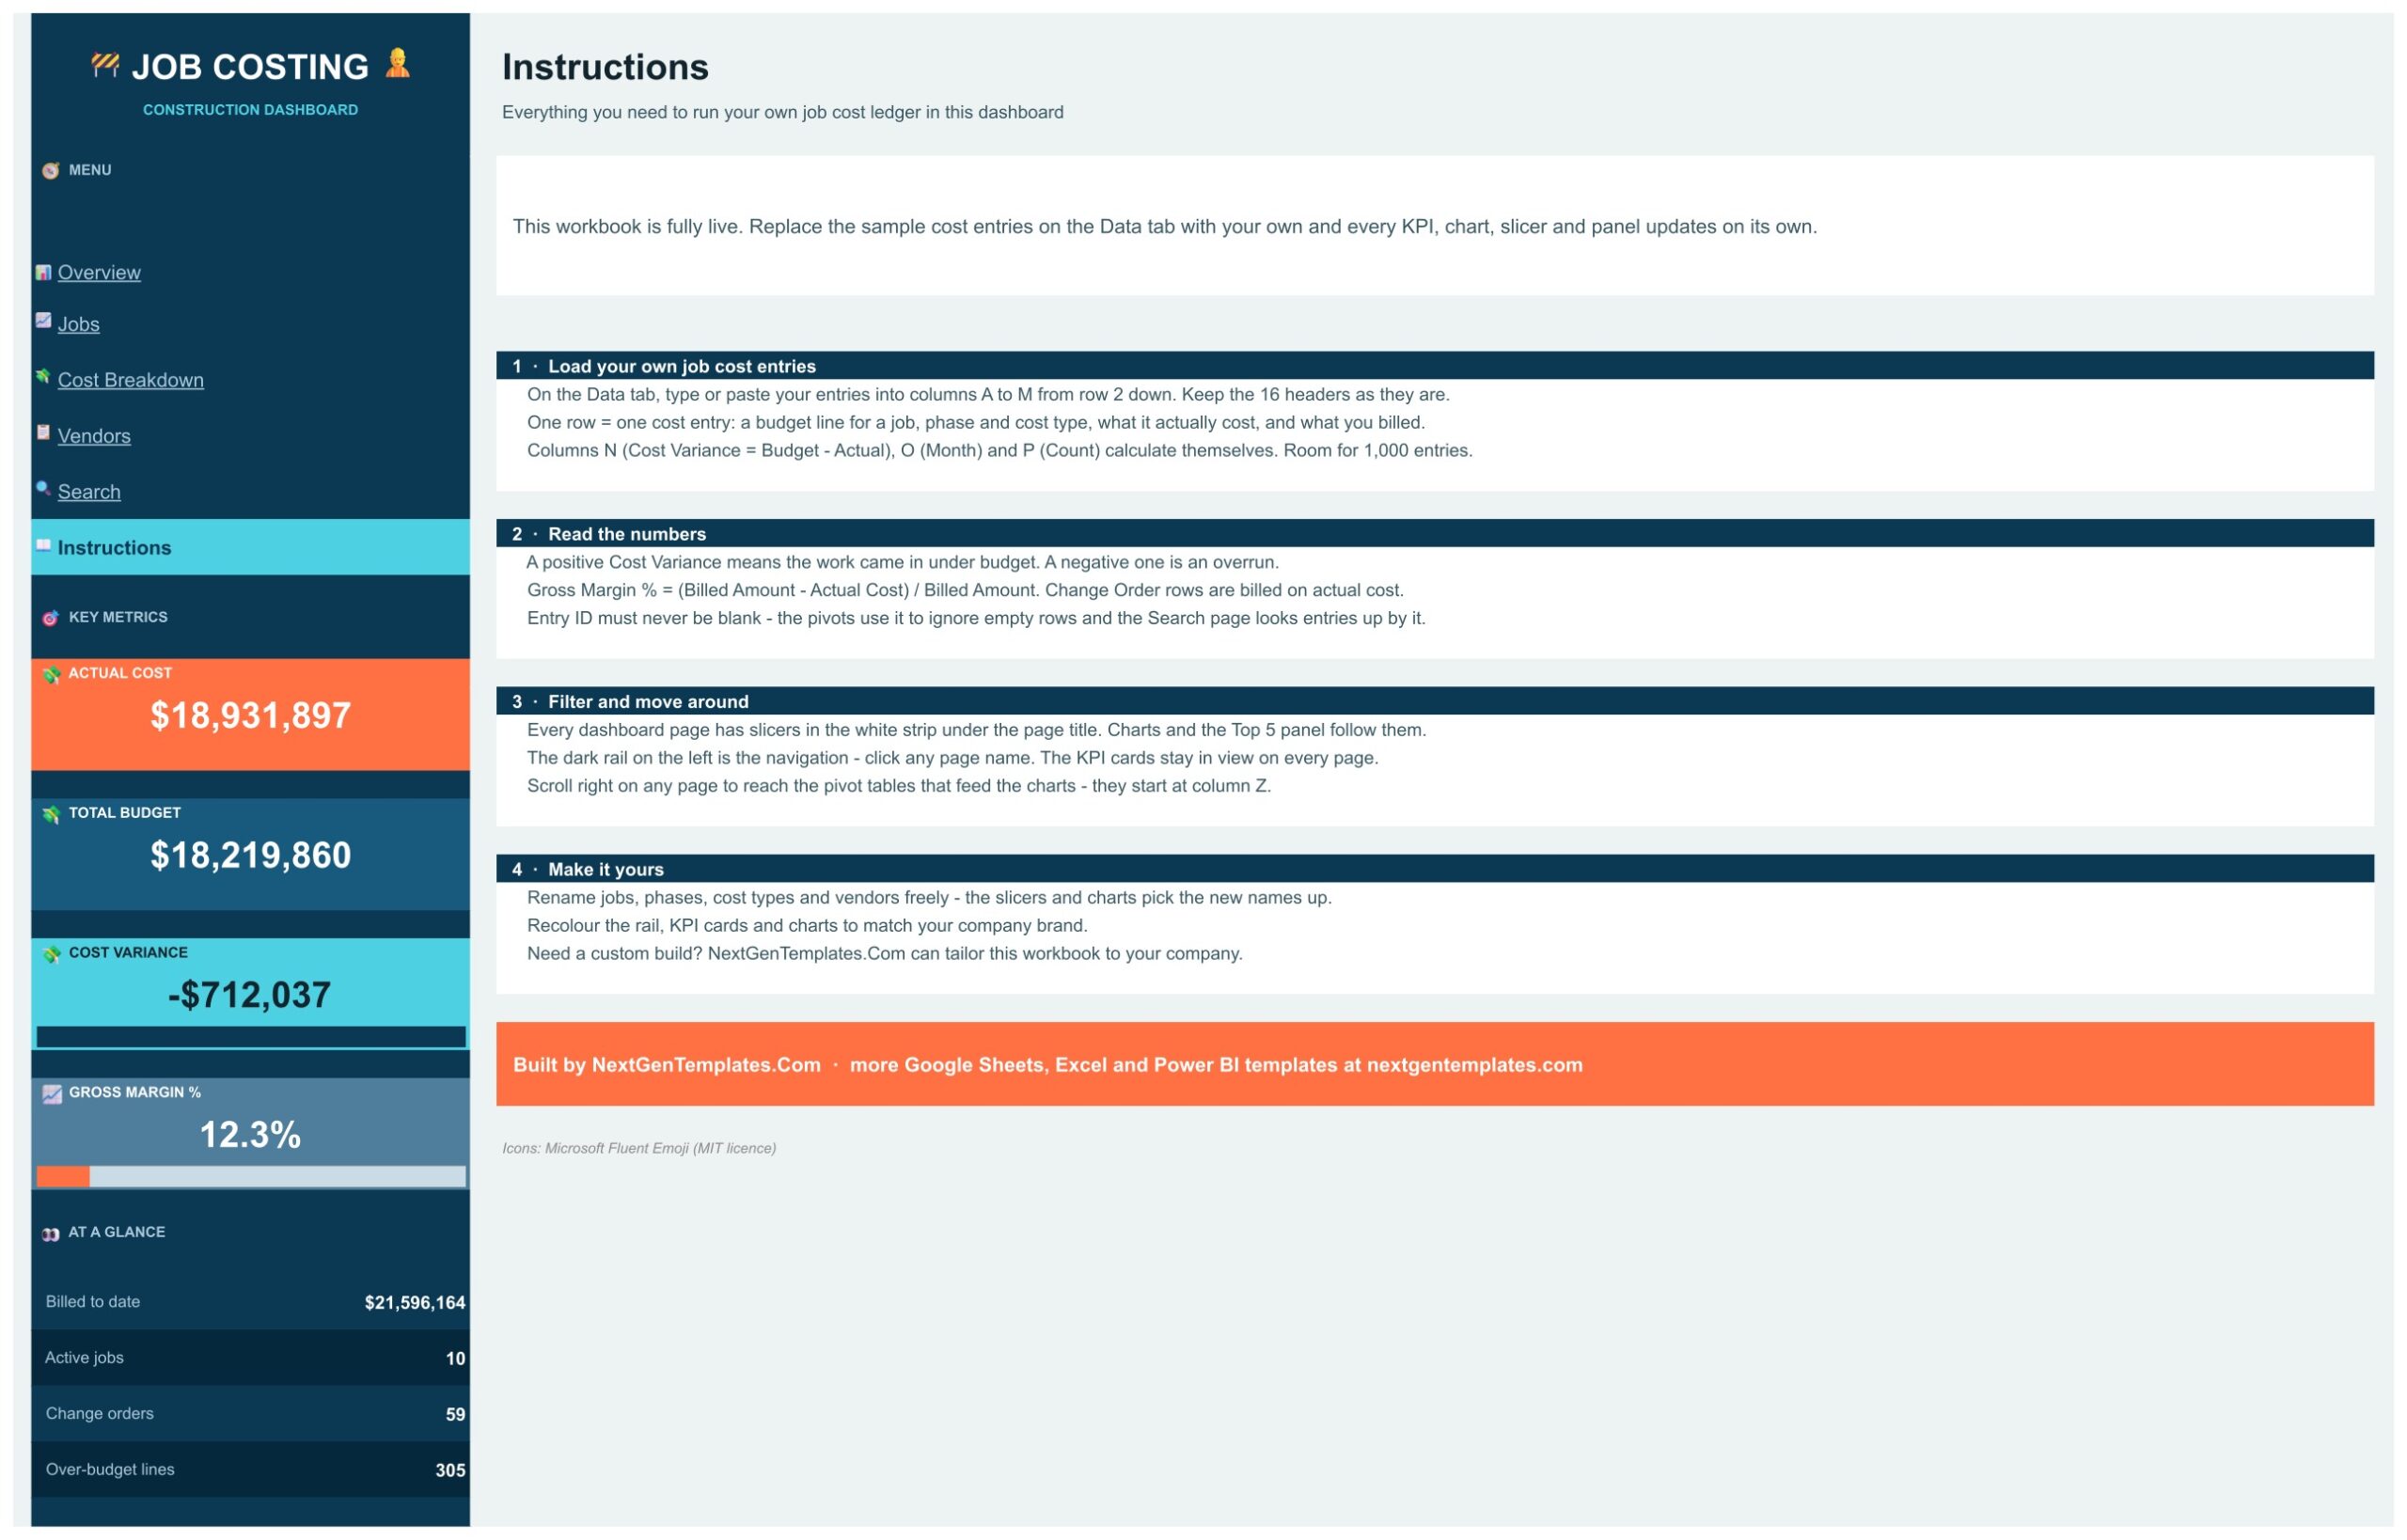
Instructions Page
Four short steps: load your own job cost entries on the Data tab (16 headers, room for 1,000 entries), read the numbers (a positive Cost Variance is under budget, a negative one is an overrun), filter and move around with the slicers and the left rail, and make it yours by renaming jobs, phases, cost types and vendors.
How a weekly job review runs
A job costing dashboard only helps if it fits the way jobs are reviewed. This one follows the routine most project teams use.
Add the cost entries. Paste your ledger into the Data tab: date, job, project type, project manager, state, cost phase, cost type, vendor, cost source, budget, actual and billed amounts. Cost variance, month and entry count calculate on their own.
Read the Overview. Actual Cost, Total Budget, Cost Variance and Gross Margin % tell you in seconds whether the portfolio is on plan.
Find the jobs. The Jobs page ranks every job by budget, actual and variance so the problem jobs stand out.
Find the cause. Cost Breakdown shows which phase and cost type drove the overrun, and Vendors shows who the money went to.
Setting it up with your own data
Open the PDF guide from your download, click the link, and choose File, then Make a copy. Replace the sample rows on the Data tab with your own and keep the 16 headers as they are. Pivot tables and slicers read the new rows on their own, so there is nothing to refresh.
This budget vs actual dashboard is a reporting tool rather than accounting software. To plan the budget it reports against, the Zero-Based Budget Template in Excel and Google Sheets is a good companion.
Construction Job Costing Dashboard vs. a spreadsheet vs. construction software
| Feature | This Google Sheets dashboard | Plain job cost spreadsheet | Construction software |
|---|---|---|---|
| Cost | $9.99 one-time ✅ | Free, but you build it | Monthly subscription |
| Budget vs actual by job, phase and cost type | Yes ✅ | Manual formulas | Yes ✅ |
| Change order cost by month | Yes ✅ | Build it yourself | Varies |
| Estimating, bidding and payroll | No | No | Often included |
Who it is for, and who it is not for
It suits contractors, project managers and owners who track cost job by job. It does not suit teams that need estimating, bidding, scheduling, payroll or accounting, which this dashboard does not include.
Related templates
- Construction Job Costing Dashboard in Excel: the Excel edition.
- Interior Fit-Out Project Management System Web App: manage fit-out projects.
- Kitchen Remodeling KPI Dashboard in Google Sheets: KPIs for remodeling work.
Frequently asked questions
What does the Construction Job Costing Dashboard in Google Sheets show?
It turns a job cost ledger into budget against actual cost, cost variance, billed amount and gross margin, split by job, project manager, cost phase, cost type, vendor, state and month.
Is this construction accounting or estimating software?
No. It is a reporting dashboard. You type or paste cost entries into the Data tab and the pages report on them. It does not estimate, bid, post to a general ledger or replace your accounting software.
How do I get my own copy?
Open the PDF guide in your download, click the link and choose File, then Make a copy. The copy lands in your Google Drive and is fully editable.
Do I need add-ons, scripts or macros?
No. It is built with formulas, pivot tables and native slicers. There is no add-on, no Apps Script and no macro to authorise.
How many cost entries can it hold?
The Data tab has room for 1,000 entries. Each row is one cost entry: a budget line for a job, phase and cost type, what it actually cost and what you billed.
How is cost variance calculated?
Cost Variance is Budget minus Actual. A positive figure means the work came in under budget and a negative figure is an overrun. Gross Margin % is Billed Amount minus Actual Cost, divided by Billed Amount.
Is the sample data real?
No. The ten jobs, project managers, vendors and every figure are fictional sample data. Replace them with your own entries.
Can I rename jobs, phases and vendors?
Yes. Use your own names on the Data tab and the slicers and charts pick them up.
Get the Construction Job Costing Dashboard
One-time payment, no subscription, instant download, PDF guide with the copy link included. See the Construction Job Costing Dashboard in Google Sheets. More dashboards are in the Google Sheets Dashboard category.